Mass Transfer in Multiphase Systems and its Applications Part 13 ppt
Bạn đang xem bản rút gọn của tài liệu. Xem và tải ngay bản đầy đủ của tài liệu tại đây (2.18 MB, 40 trang )
Condensation Capture of Fine Dust in Jet Scrubbers
469
The condition of vapor condensation on particles follows from the equation of mass transfer,
for instance, (5'):
11
ρ
ρ
−
p
> 0, then
pf
dd
τ
m > 0. This condition can be written at τ=0 in the
form
()
1001
11
00 00
0
τ
=
⎛⎞
−
⎜⎟
⎜⎟
⎝⎠
p
PT M
PM
RT RT
> 0, or Р
1
–Р
1p
> 0.
Since from state equation
0
1
0
=
+
d
Р B
K
d
,
1
1p
1
=
+
p
p
d
Р B
K
d
, d
1p
is moisture content determined
by temperature at chamber inlet Т
00
, the condition for the beginning of liquid vapor
condensation on particles takes form
0
d >
1
−
a
K
a
, (32)
where
(
)
1p 00
=
P Т
a
В
. (33)
For instance, for steam and air at B=101325 Pa, Т
00
=333 К (60
0
С), Р
1p
=0.199·10
5
Pa,
К=18/29=0,621. Then, а=0.1964 and d
0
> 0.152 kg/kg of dry air. Therefore, condition (32)
should be taken into account at realization of the above problem.
3. Comparison of calculation results with experimental data
Results of model implementation for the experimental data on soot capture in the jet scrubber
by the method of methane electric cracking from cracked gases are shown in Fig. 4. On the
basis of data from (Uzhov & Valdberg, 1972), we managed to determine approximately the
physical parameters of cracked gases through the comparison with the molecular weights of
the known gases:
11 24
=
g
M
.kgkmole is molecular mass; 24
=
⋅
g
с .kJkgK is specific heat
capacity at constant pressure; coefficients of dynamic viscosity are
1,7
6
0
6,47 10
μ
−
⎛⎞
=⋅
⎜⎟
⎝⎠
g
Т
Т
, Pa·s,
0
273К
=
Т , (34)
and coefficients of heat conductivity are
1,7
2
0
134 10
λ
−
⎛⎞
=⋅
⎜⎟
⎝⎠
g
Т
,
Т
,
⋅
WmK
, (35)
coefficient of steam diffusion in cracked gases is:
32
6
0
0
13,1 10
−
⎛⎞
=⋅
⎜⎟
⎝⎠
T
D
T
, m
2
/s. (36)
Calculations have been carried out for the following conditions (Uzhov & Valdberg, 1972,
Table XIII.1, p.221):
- inlet gas temperature –
0
0
160 180=−t С;
Mass Transfer in Multiphase Systems and its Applications
470
- outlet gas temperature –
(
)
0
50 55==−
out
ttH С;
- inlet velocity of vapor-gas flow –
0
025=U,
m/s;
- irrigation coefficient –
3
71 10
−
=⋅q, m
3
/m
3
;
- inlet soot concentration –
(
)
(
)
33
0
172 / 28 /
ρ
=
p
. g m . g m normalconditions ;
- outlet soot concentration –
(
)
(
)
(
)
33
0 356 / 0 425 /
ρρ
==
pout p
H . g m . g m normalconditions ;
- inlet water temperature –
0
0
20
θ
=
С;
- scrubber diameter –
3
=
D m;
- scrubber height –
12 75
=
H, m;
- water pressure on jets (evolvent) –
300
=
f
P kPa;
- jet nozzle diameter – 12
=
n
d mm;
- density of cracked gases under normal conditions –
(
)
3
051 /
ρ
=
g
, kg m normalconditions
.
Approximated calculation of the size of irrigating fluid droplets by (Uzhov & Valdberg,
1972)gives the values of mean-mass diameter δ
d0
=700 μm and initial velocity of droplets
0
24 5=
d
V, m/s. The estimate of moisture content difference by empirical data of (Uzhov &
Valdberg, 1972) allowed determination of
0 849
Δ
=d, kg/kg of dry air for the given
experiment. Exhaustive search of inlet moisture contents (there is no d
0
in experimental
data) for determination of experimental value
Δ 085
≈
d. kg/kg of dry gas in calculations
allows us to take
0
093
=
d. kg/kg of dry gas. In calculations we have also taken the initial
size of soot particles
0
01
δ
=
p
. μm.
Let’s determine the efficiency values by the ratio of mass flow rates of particles at the
scrubber outlet and inlet by formula (15) with consideration of dependence (9):
(
)
(
)
(
)
(
)
00 00 0
0,356
11
1,72
18
0,081
0,356 325,2
11,24
1 0,899 9
18
1,72 443
0,93
11,24
p
p
HUH THKdH
U Т Kd
ρ⋅ +
η
=− =− =
ρ⋅ +
⎛⎞
+
⎜⎟
⎝⎠
=− =
⎛⎞
+
⎜⎟
⎝⎠
(89, %)
,
where
()
dH and
0
d
are taken by calculation because there is no experimental value of
velocity
(
)
UH in [1],
(
)
ρ
p
H and
0
ρ
p
are real concentrations of particles at scrubber outlet
and inlet, and temperatures Т(H) and Т
00
are assumed average from data presented.
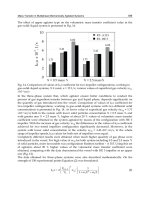
The theoretical value of efficiency for the given version of calculation is η=89.3 %, and the
diagrams in Fig. 4 prove that.
Calculation results on parameters described by the suggested model are shown in Fig. 4.
According to the diagrams, the “spread” density (mass concentration) of dry particles
increases drastically at first, then it starts decreasing slowly. An increase is caused by a fast
reduction in velocity of the vapor-gas flow because of a significant withdrawal of vapors via
their condensation of droplets and particles; then particles with condensation on the surface
are entrapped by droplets and dust concentration in the flow decreases. In this case the size
of particles increases by the factor of 3.5; i.e., their mass increases by the factor of 43.
Condensation Capture of Fine Dust in Jet Scrubbers
471
Calculated outlet gas temperatures differ significantly from the experimental ones, and we
suppose that this is connected with uncertainty of assignment of initial moisture content and
averaging of temperature within 20
0
С from the measured values.
0,00,20,40,60,81,0
5
10
15
20
25
0,0 0,2 0,4 0,6 0,8 1,0
0
1
2
3
4
0,00,20,40,60,81,0
0
1
2
3
4
0,0 0,2 0,4 0,6 0,8 1,0
290
295
300
305
310
0,00,20,40,60,81,0
0,0
0,1
0,2
0,3
0,4
0,0 0,2 0,4 0,6 0,8 1,0
300
350
400
450
0,00,20,40,60,81,0
0,0
0,5
1,0
1,5
0,0 0,2 0,4 0,6 0,8 1,0
300
350
400
450
х/Н
V
dx
, m/s
х/Н
d
pf
/d
p0
ρ
p
, g/m
3
х/Н
Θ
, Κ
х/Н
х/Н
U, m/s
Т, К
х/Н
х/Н
d, кg/кg
х/Н
Т
pf
, К
Fig. 4. Results of model calculations: Н=12.75 m, q=7.1·10
-3
m
3
/m
3
, δ
d0
=7⋅10
-4
m, V
d0
=24.5
m/s, Θ
0
=293 К, Т
00
=443 К, d
0
=0.93 kg/kg, U
0
=0.25 m/s, δ
d0
=10
-7
m, ρ
p0
=1.72 g/m
3
As we can see, the theoretical results correlate well with the experimental values, what
proves model efficiency.
0
p
fp
δ
δ
Mass Transfer in Multiphase Systems and its Applications
472
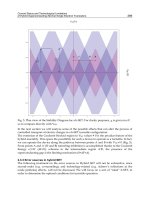
Fig. 5. Comparison of model with experimental data under isothermal conditions for
Venturi scrubber: η was determined by formula (15) and
η
e
– by formula (37)
To assure additionally efficiency of the model, the process of dust capture on water droplets
from air was calculated with the use of this model under the isothermal conditions (at t=20
0
С) without mass transfer in a standard Venturi tube (Uzhov & Valdberg, 1972). Calculation
results are compared in Fig. 5 with the experimental data described by the known
dependence of fractional efficiency on Stokes number (Uzhov & Valdberg, 1972)
3
10 Stk
1 е
η
−
−⋅
=−
qb
e
,
02
p0
0
0
Stk
18
ρδ
μ
δ
=
p
r
d
V
, (37)
at q=0.5·10
-3
m
3
/m
3
, b=1.5 (b is constructive parameter: b=1.25-1.56 (Uzhov & Valdberg, 1972,
Shilyaev et al., 2006)). Difference in a wide range of Stokes numbers Stk does not exceed 2 %.
In calculations velocity of the vapor-gas flow was determined by formula
2
0
00 0
⎛⎞
+
=
⎜⎟
+
⎝⎠
min
х
T К dD
UU
T К dD
, (38)
where
U
0
is velocity of the vapor-gas flow in the throat of tube with diameter D
min
, D
х
is the
current diameter of diffuser:
2tg
2
α
=+
х min
DD x
,
α is diffuser angle, and х is coordinate along the tube axis. The size of fluid droplets, fed into
the tube throat, was calculated by formula of Nukiyama-Tanasava (Shilyaev et al., 2006,
Shvydkiy & Ladygichev, 2002):
Condensation Capture of Fine Dust in Jet Scrubbers
473
045
15
0
0
0 585
53 4
σμ
δ
ρ
ρσ
⎛⎞
⎜⎟
=+
⎜⎟
⎝⎠
,
ff
,
d
rf
ff
,
,q
V
, м, (39)
where σ
f
is coefficient of surface tension of fluid (for water σ
f
=0.072 N/m), ρ
f
is fluid density
(for water ρ
f
=10
3
kg/m
3
), μ
f
is coefficient of dynamic viscosity of fluid (for water μ
f
=10
-3
Pa·s
at t=20
0
С),
00
=−
rgd
VVV, V
g
is gas velocity in the throat of Venturi tube, and V
d0
is velocity
of droplets in the throat of Venturi tube, assumed equal to 4-5 m/s. The density of particles
was taken conditionally
03
10
ρ
=
p
kg/m
3
. The diameter of tube throat was taken D
min
=0.1 m,
length of diffuser part was l=1 m, and angle was α=6
0
.
4. Condensation effect of single particle enlargement in irrigation chamber
Results of model (Shilyaev et al., 2008) implementation together with mass transfer equation
for a single submicron droplet (5') under the condition of fluid vapor condensation on it (32)
are shown in Figs. 6-9 for the air-water system (calculations have been carried out at Т
00
=333
К, δ
d0
=500 μm, q=0.001 m
3
/m
3
, Θ
0
=293 К, U
0
=3 m/s, V
d0
=12 m/s; q is coefficient of
irrigation;
00000
Θ
d
V,U, ,T are inlet velocities and temperatures of irrigating fluid droplets and
vapor-gas flow;
0
δ
d
is initial size of irrigating fluid droplets;
0
δ
is initial size of submicron
droplet; d
0
is moisture content at the inlet to the chamber; and l is chamber length). The
effect of collision between submicron droplet and irrigating fluid droplet was not taken into
account.
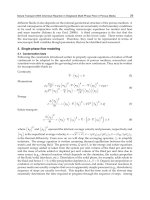
According to Figs. 6 and 7, at high moisture contents the condensation effect is very strong
and inverse to initial size
0
δ
. The droplet size for δ
0
=0.1 μm increases by the factor of 450 up
to 45
μm, for δ
0
=0.01 μm it increases by 4500 times up to the same size. These formations can
be efficiently captured even independently in vortex drop catchers.
Fig. 6. Condensation of fluid vapors in a vertical chamber in direct flow on droplet with size
δ
0
=10
-7
m: l=2 m, d
0
=3 kg/kg of dry air
Results of calculations under outstanding conditions of condensation (32) are shown in Fig.
8. In this case critical value is d
0
=0.15 kg/kg of dry air. According to the figure, the droplet
with initial size δ
0
=0.1 μm evaporates along the whole chamber and disappears almost at the
chamber inlet.
0
δ
δ
Mass Transfer in Multiphase Systems and its Applications
474
Fig. 7. Condensation of fluid vapors in a vertical chamber in direct flow on droplet with size
δ
0
=10
-7
m: l=1m, d
0
=3 kg/kg of dry air
Fig. 8. Droplet evaporation in the vertical chamber at the direct flow: δ
0
=10
-7
m, l=1m,
d
0
=0.15 kg/kg of dry air
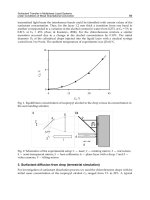
Calculation results for condition (32) satisfied at the inlet are shown in Fig. 9. The process of
mass transfer between particle and flow starts from condensation. The droplet size at initial
moisture content d
0
=0.17 kg/kg of dry air increases until the middle of chamber length and
becomes equal to 4
μm (by the factor of 40), then it starts evaporating and at the distance of
0.7 l it disappears turning to vapor.
Therefore, condensation processes in irrigation chambers under some certain conditions can
effect positively the efficiency of submicron particle capture, but these conditions can be
achieved only on the basis of adequate mathematical models similar to the suggested one
including model equations (Shilyaev et al., 2008) combined by mass and heat balance, heat
and mass transfer equations of particles under the conditions of their absorption by fluid
droplets at the motion along the chamber.
0
δ
δ
0
δ
δ
Condensation Capture of Fine Dust in Jet Scrubbers
475
Fig. 9. Condensation is evaporation of a droplet in the vertical chamber at direct flow:
δ
0
=10
-7
m, l=1m, d
0
=0.17 kg/kg of dry air
Let’s determine the average velocity of vapor at its condensation on a droplet from balance
relationship
()
233
0
6
ρ
π
πδ ρ δ δ
τ
τ
Δ
==−
Δ
Δ
f
vv d
m
w
, (40)
where Δm is droplet mass increase during time
τ
Δ
of its passing along distance l , for
instance, the chamber length;
v
w is vapor velocity to the surface of condensation (droplet);
ρ
v
is the average vapor density on distance l near the droplet surface calculated by its
temperature equal to the temperature of saturation;
0
δ
and
δ
d
are initial and final
diameters of droplet;
ρ
f
is droplet density;
δ
is average size of a droplet on distance l .
Time is
τ
Δ=l/U, where U is velocity of the vapor-gas flow along the chamber axis.
If we assume
d0
δδδ= , from (40) we can obtain
2
0
1
6
ρ
δ
δ
ρ
≈
f
d
v
v
U
w
l
. (41)
In equation (41) we neglect summand
2
0
δ
δ
d
, since
0
δ
δ
<
<
d
. It can be seen from (41) that
velocity
v
w is reverse to the initial size of droplets. This regularity can be also obtained
directly from the equation of droplet mass transfer:
()
22
11
d
d
π
δρβπδρ ρ
τ
== −
vv d
m
w
. (42)
It follows from (42) that
11
1
ρ
ρ
β
ρ
−
=
d
v
d
w , (43)
but since we can assume for small droplets, as it was already mentioned,
2
β
δ
=
D
, it follows
from equation (43) that
1
δ
v
w~
.
0
δ
δ
Mass Transfer in Multiphase Systems and its Applications
476
Let’s estimate with the help of formula (41) condensation rates for Figs. 6 and 7:
at
01m=l.
101
450
δ
δ
=
d
,
1
01
10 μm
δ
−
= ,
1
45μm
δ
=
d
;
at
1m=l
202
4500
δ
δ
=
d
,
2
02
10 μm
δ
−
= ,
2
45μm
δ
=
d
.
Assuming in (41) that values of
ρ
v
U differ slightly in these two considered cases, we
obtain
2
1102
2201
δ
δ
δ
δ
⎛⎞
=
⎜⎟
⎝⎠
vd
vd
w
w
. (44)
Along distance
01м=l,
1
01
1700
δ
δ
=
d
,
2
02
10 μm
δ
−
= ,
2
17μm
δ
=
d
;
2
02
170
δ
δ
=
d
,
1
01
10 μm
δ
−
= ,
1
17μm
δ
=
d
.
As we can see, in two considered cross-sections of chamber two calculation versions give the
same final size of droplets: in the first case it is 45 μm and in the second it is 17 μm.
Thus, it follows from (44) in connection with
12
δ
δ
≈
dd
that
102
201
δ
δ
=
v
v
w
w
. (45)
Relationship (45) proves the fact that the diffusion mechanism of small particle deposition
on large droplets is insignificant because of small diffusion velocities of vapors at
condensation on their surfaces, and it can be neglected; simultaneously it is very important
for small droplets. This conclusion correlates with formula of B.V. Deryagin and S.S. Dukhin
(Uzhov & Valdberg, 1972)
(
)
()
022
00
144
πμ ρ ρ
η
ρ
ρδ δ δ
−
=
−
v
d
pdad d
D
g
. (46)
Here
μ
is dynamic viscosity of vapor-gas flow,
0
ρ
p
is density of particles,
ρ
da
is density of
dry air in the vapor-gas mixture, and
η
d
is capture efficiency of particles with size
0
δ
due to
the diffusion effect.
According to calculations by formula (46), at
0
δ
δ
<
<
d
the efficiency of submicron dust
deposition is low (Shilyaev et al., 2006).
5. Parametrical analysis of condensation capture of fine dust in Venturi
scrubber
The Venturi scrubber (VS) is the most common type of wet dust collector for efficient gas
cleaning from dust particles even of a micron size. Together with dust capture the
absorption and thermal processes can occur in VS. The VS is used in various industries:
Condensation Capture of Fine Dust in Jet Scrubbers
477
ferrous and non-ferrous metallurgy, chemistry and oil industry, production of building
materials, power engineering, etc. The construction of VS includes combination of irrigated
Venturi tube and separator (drop catcher). The Venturi tube has gradual inlet narrowing
(converging cone) and gradual outlet extension (diffuser). A pinch in cross-section of
Venturi tube is called a “throat”. The operation principle of VS is based on catching of dust
particles, absorption or cooling of gases by droplets of irrigating fluid dispersed by the gas
flow in Venturi tube. Usually the gas velocity in the throat of scrubber tube is 30-200 m/s,
and specific irrigation is 0.1-6.0 l/s
3
. In the current section we are considering optimization
of possible application of Venturi scrubber for fine dust capture under condensation
conditions on the basis of the suggested physical-mathematical model.
Results of calculation on the basis of suggested model for VS are shown in Figs. 10 and 11.
According to Fig. 10, at low moisture contents (almost dry air) with a rise of initial particle
concentration the efficiency of their capture increases slightly and with an increase in
moisture content it decreases (Fig. 10а). At that high efficiency of dust capture can be
achieved al low particle concentrations and high moisture contents at the VS inlet (Fig. 10b).
Dependence of dust capture efficiency on diffuser angle of Venturi tube
α
is shown in Fig.
11а, and it is obvious that for the given case the optimal is
α
≈ 7.7
0
. For any other case this
optimal angle can be calculated by the model.
а) b)
Fig. 10. Effect of initial particle concentration and moisture content on dust capture
efficiency: V
0
=5 m/s, Θ
0
=293 К,
0
ρ
p
=10
3
kg/m
3
, q=0.5⋅10
-3
m
3
/m
3
, U
0
= 160 m/s, Т
00
=333 К,
α=6
0
, l=1m,
δ
0
=10
-7
m
Dust capture efficiency vs. relative diffuser length is shown in Fig. 11b, and it can be seen
that the optimal length of diffuser tube, which provides the required dust capture efficiency,
can be determined with the help of the model. Thus, for this case at required efficiency
η
=99
% the length of diffuser should be l=1 m.
According to Fig. 12, efficiency depends significantly on the flow velocity in the tube throat
and irrigation coefficient. Calculations were carried out for diagram а) at following
parameters: l=1 m, V
d0
=5 m/s, δ=0.1 μm, Θ
0
=293 К, α=6
0
, ρ
p0
=1 g/m
3
,
0
ρ
p
=10
3
kg/m
3
, q=2
l/m
3
, U
0
= 80 m/s, Т
00
=303 К, d
0
=0.01193 kg/kg of dry air.
Mass Transfer in Multiphase Systems and its Applications
478
а) b)
Fig. 11. The effect of diffuser angle (а) and diffuser length (b) on dust capture efficiency:
V
0
=5 m/s, Θ
0
=293 К,
0
ρ
p
=10
3
kg/m
3
, q=10
-3
m
3
/m
3
,
U
0
= 80 m/s, Т
00
=333 К, ρ
p0
=1 g/m
3
,
d
0
=0.5 kg/kg of dry air,
δ
0
=10
-6
m
Fig. 12. Calculation results: а) distribution of particle concentration along the diffuser; b)
efficiency of particle capture depending on irrigation coefficient: 1 -
U
0
= 80 m/s, d
0
=0.01193
kg/kg of dry air; 2 - U
0
= 100 m/s, d
0
=0.01193 kg/kg of dry air; 3 - U
0
= 100 m/s, d
0
=0.5 kg/kg
of dry air, other parameters are the same as for Fig. а)
6. Comparison of direct-flow and counter-flow apparatuses of condensation
capture of fine dust
It is interesting to compare specific power inputs for gas cleaning from fine dust under the
conditions of condensation of particle capture on fluid droplets in the direct-flow and
counter-flow apparatuses as well as their sizes under the same conditions. For this purpose
let’s compare the counter-flow jet scrubber (CJS) and Venturi scrubber (VS) under the same
flow rates of cracked gases cleaned from soot particles, corresponding to experimental data
of (Uzhov & Valdberg, 1972) for CJS.
%,
η
Condensation Capture of Fine Dust in Jet Scrubbers
479
Comparative calculations were carried out for the following data. For CJS: q=7.1·10
-3
m
3
/m
3
,
δ
d0
=700 μm, V
d0
=24.5 m/s, Θ
0
=293 К, Т
00
=443 К, d
0
=0.93 kg/kg of dry air, U
0
=0.25 m/s,
δ
0
=0.12 μm, ρ
p0
=1.72 g/m
3
, D=3.0 m, Н=2; 3; 6; 9; 11; and 12.5 m. For VS the diameter of tube
throat D
min
was determined from the equilibrium equation for volumetric flow rates of the
vapor-gas flow at the inlets of the compared apparatuses. Thus, at
U
0
=80 m/s D
min
=0.17 m,
at
U
0
=160 m/s D
min
=0.12 m. Angle α was varied as well as scrubber length l. Initial size of
droplets δ
d0
for VS was calculated by Nukiyama-Tanasava formula (39) depending on (U
0
–
V
d0
), fluid density ρ
f
, q, coefficient of fluid surface tension σ
f
(for water σ
f
=0.072 N/m); the
value of initial velocity of droplets in tube throat V
d0
was set 4.0 m/s.
Calculation results are generalized in Figs. 13 and 14 for optimal angle α=7.7
0
,
corresponding to maximal efficiency of dust capture. According to the figures, with an
increase in the relative length of Venturi tube and relative height of CJS, the efficiency
increases significantly, but the higher
min
lD and HD, the less expressive is this growth.
According to Fig. 13b, the efficiency growth is caused firstly by enlargement of “formations”
(particles with condensate on their surface). Deceleration of efficiency growth depending on
converging cone length and scrubber height is caused by a decrease in particle concentration
in the flow and reduction in probability of collisions between “formations” and fluid
droplets. The suggested model provides a possibility to determine the optimal length of
Venturi tube l or scrubber height Н for the required efficiency of dust capture.
Fig. 13. Results of calculations by the model for Venturi scrubber: q=7.1·10
-3
m
3
/m
3
, V
d0
=4.0
m/s, Θ
0
=293 К, Т
00
=443 К, d
0
=0.93 kg/kg of dry air, U
0
=80 m/s, δ
0
=1.2⋅10
-7
m, ρ
p0
=1.72 g/m
3
,
D
min
=0.17 m, α=7.7
0
Calculation results on the relative size of “formations” and CJS efficiency under the same
conditions as for VS, corresponding to experimental data for CJS on soot capture from
cracked gases (Uzhov & Valdberg, 1972), are shown in Fig. 15 depending on the initial
temperature of droplets. The height of experimental CJS was Н=12.7 m, and diameter was
D=3 m. It can be seen from the figure that with a decrease in droplet temperature at the inlet
Θ
0
efficiency increases significantly. Thus, an increase in Θ
0
from 293 К (20
0
С) to 278 К (5
0
С) increases efficiency by 8 %. This important result proves the fact that the same
experimental efficiency η≈90 % can be obtained at significantly less height of the scrubber.
Thus, according to calculations, at Θ
0
=278 К (5
0
С) this value of efficiency can be achieved at
height Н≈4-5 m instead of 12.7 m, what reduces the dimensions and specific quantity of
metal of the whole construction. The point in Fig. 15b indicates the experimental value of
efficiency, and this means that model operability is proved well by the experiment.
Mass Transfer in Multiphase Systems and its Applications
480
Fig. 14. Results of calculations for CJS: q=7.1·10
-3
m
3
/m
3
, δ
d0
=7⋅10
-4
m, V
d0
=24.5 m/s, Θ
0
=293
К, Т
00
=443 К, d
0
=0.93 kg/kg of dry air, U
0
=0.25 m/s, δ
0
=1.2⋅10
-7
m, ρ
p0
=1.72 g/m
3
, D=3.0 m
Fig. 15. Results of calculations by the model for CJS: H=12.75 m, q=7.1·10
-3
m
3
/m
3
, δ
d0
=7⋅10
-4
m, V
d0
=24.5 m/s, Т
00
=443 К, d
0
=0.93 kg/kg of dry air, U
0
=0.25 m/s, δ
0
=10
-7
m, ρ
p0
=1.72 g/m
3
.
According to analysis, for similar required efficiency, the direct-flow dust catchers (in this
case they are VS), despite their advantage by dimensions over the counter-flow apparatuses,
require higher power inputs for gas cleaning, determined by pressure drops in apparatuses.
Actually, for VS the coefficient of hydraulic resistance can be estimated by formula (Shilyaev
et al., 2006)
07
1063
ρ
ξξ
ρ
⎛⎞
=+
⎜⎟
⎝⎠
f
,
t.v d.t
,q , (47)
where
ξ
d.t
is resistance coefficient of the dry Venturi tube, it is assumed to be 0.12–0.15, ρ is
gas density. Under our conditions for estimate calculation we assume q=7.1·10
-3
m
3
/m
3
,
ρ
f
=10
3
kg/m
3
,
ξ
d.t
=0.12,
0
273
ρρ
≈
m
Т
, Т
m
=397.6 К, where Т
m
=0.5(Т
00
+Т
out
), Т
00
=443 К,
Т
out
=352.2 К, and ρ
0
(273 К)=0.51 kg/m
3
(Uzhov & Valdberg, 1972). Then, ρ=0.35 kg/m
3
.
Condensation Capture of Fine Dust in Jet Scrubbers
481
Substituting these data into (47), we obtain
69
ξ
=
t.v
, . Hence, at U
0
=80 m/s the pressure drop
on the Venturi tube is
2
0
7728
2
ξρ
Δ= =
t.v t.v
U
Р
Pa, and at U
0
=160 m/s
30912Δ=
t.v
Р
Pa.
This resistance exceeds the resistance of CJS, where the main part of energy is spent for fluid
spraying, and hydraulic resistance is low (as usual, the velocity of cleaned gas does not
exceed 1 m/s). At that, the same energy is spent for fluid spraying in Venturi tube. Thus,
specific energy spent for fluid spraying is
Δ
=
f
f
Р qP ,
where Р
f
is pressure of fluid fed to the spraying jets, equal to 300-400 kPa. Thus, in our case
we obtain
(
)
(
)
33
7 1 10 300 400 10 2130 2840
−
Δ= ⋅ − = −
f
Р , J/m
3
.
Moreover, to estimate the total dimensions of VS, the sizes of droplet catcher should be
added to the sizes of Venturi tube and power inputs for overcoming of hydraulic resistance
should be taken into account.
All the above mentioned proves the fact that the counter-flow schemes of condensation dust
capture are in preference to the direct-flow ones.
7. Conclusion
Therefore, the physical-mathematical model of heat and mass transfer and condensation
capture of fine dust in scrubbers was formulated, and its efficiency was determined. The
suggested model can be used for preliminary calculations and estimation of the most
rational determining parameters of apparatuses, which provide efficient gas cleaning.
8. References
Amelin, A.G. (1966). Theoretical Foundations of Fog Formation at Vapor Condensation. –
Moscow: Khimiya.
Pazhi, D.G., Galustov, V.S. (1984). Foundations of Liquids Spraying Technology. – Moscow:
Khimiya.
Shilyaev, M.I., Khromova, E.M. (2008). Simulation of heat and mass transfer in spray
chambers. Theoretical Foundations of Chemical Engineering, Vol. 42, No. 4, P. 404-414.
Shilyaev, M.I., Khromova, E.M., Tumashova, A.V. (2008). Physical-mathmatical model of
heat and mass transfer process in jet irrigation chambers at high moisture contents.
Izv. Vuziv. Stroitelstvo, No. 6, P. 75-81.
Shilyaev, M.I., Shilyaev, A.M., Grischenko, E.P. (2006). Calculation Methods for Dust Catchers.
– Tomsk: Tomsk State University of Architecture and Building.
Shilyaev, M.I., Shilyaev, A.M., Khromova, E.M., Doroshenko, Yu.N. (2008). About
condensation mechanisms of dust capture intensification in CJS and DC. Izv. Vuzov.
Stroitelstvo, No.4, P. 61-67.
Shvydkiy, V.S., Ladygichev, M.G. (2002). Gas Cleaning: Reference Book. – Moscow:
Teploenergetik.
Uzhov, V.N., Valdberg, A.Yu. (1972). Gas Cleaning by Wet Filters. – Moscow: Khimiya.
Mass Transfer in Multiphase Systems and its Applications
482
Valdberg, A.Yu., Savitskaya, N.M. (1993). Calculation of dust capture at condensation
operation of scrubbers. Theoretical Foundations of Chemical Engineering, Vol. 27, No.
5, P. 526-530.
Vitman, L.A., Katsnelson, B.D., Paleev, I.I. (1962). Liquid Spraying by Jets. – Moscow-
Leningrad: Gosenergoizdat.
21
Mass Transfer in Filtration
Combustion Processes
David Lempert, Sergei Glazov and Georgy Manelis
Institute of Problems of Chemical Physics of Russian Academy of Sciences
Russian Federation
1. Introduction
Wave combustion is one of wide-spread regimes of chemical reactions progress in the
systems with the enthalpy excess. Combustion waves in porous medium have some special
features, that let consider them as especial kind of combustion processes. Usually one
denominates the filtration combustion (FC) as the oxidation of any solid combustible at
gaseous oxidizer filtration. The presence of two phase states, intensive heat- and mass
exchange between these two phase states, a constant countercurrent flow of solid and gas
phases complicate considerably theoretical description of FC wave, as well as experimental
results explication. In such systems one has to consider not only heat and concentration
fields, but also the gas flow dynamics and heterogeneous reactions peculiarities. Besides it a
huge difference between densities of components provides the necessity of common
consideration of processes with appreciably different characteristic rates. Anyway due to
some peculiarities filtration combustion waves remain very attractive objects for industrial
application.
Combustion regimes with heat accumulation occupy an especial place in wave combustion
processes. A typical example it is the combustion of a solid fuel at gas oxidizer filtration,
when the combustion front direction coincides with the gas flow one (Aldushin et al., 1999;
Hanamura et al., 1993; Salganskii et al., 2008). In coordinates, cohered with the combustion
front (zone of the exothermic transformation) this process may be considered as the
interaction of gas and condensed flows, coming from the opposite direction, passing
through the chemical reactions zone, and being transformed in this zone with the change of
both chemical content and physical-chemical properties (Fig.1).
The presence of high temperature area with an intensive interphase mass-transfer processes
between counter-current phases flows forms a zone structure. In each zone there are
physical and chemical processes depending on corresponding conditions (temperature,
medium properties, reagents concentration etc.). Space separation of zones supplies an
accumulation of either, one or another substance in the definite zone accordingly to his
physical-chemical properties, and provides possibility of some useful components
extraction. These peculiarities allow to realize some industrial processes in extremely
effective and a low-price regime, basing on heat-effectiveness of combustion wave.
Examples of FC processes industrial application are known. It is waste extermination using
superadiabatic combustion (Manelis et al., 2000; Brooty & Matcowsky, 1991) underground
oil recovery (Chu, 1965; Prato, 1969), metallurgical burden agglomeration (Voice & Wild,
Mass Transfer in Multiphase Systems and its Applications
484
1957; Zhu-lin, 2006) oxidative catalyst regeneration (Kiselev, 1988), self-propagating high
temperature synthesis (Merzhanov & Borovinskaya, 1975; Novozhilov, 1992) etc. These
processes are typical examples of FC with counter-current flow and superadiabatic
overheat.
We have to notice that in this paper we consider heterogeneous combustion only. We do not
consider the FC of gases where preliminary mixed gaseous fuel and oxidizer burns in
porous heated medium (Babkin, 1993), because in these systems heterogeneous processes
are not determinative.
Due to the wave structure the heat, released in chemical reactions, transfers intensively to
source materials with no use of outside heat-exchange devices, only because of extremally
intensive interphase heat-exchange while gas filtration. The heat accumulation may be so
considerable that combustion temperature can exceed by several times the adiabatic
temperature, when it calculated assuming that the initial temperature of any portion of
reacting compounds is equal to the ambient temperature. That is why sometimes one uses
the terms «superadiabatic heating», «superadiabatic regime of filtration combustion», or
simply «superadiabatic combustion».
The term «superadiabatic» seems disputable at first glance, however any heat recuperation
from combustion products to initial substances can increase the adiabatic temperature
(Wainberg, 1971) of the mixture. Really due to an intensive interphase heat exchange in
such system the temperature of initial interacting compounds is far higher than the ambient
temperature and may approach the combustion front temperature. Anyway the term
«superadiabatic» has been used during many years and we guess one should not replace it.
Just in superadiabatic regime the effectiveness of the heat recuperation may be maximally
high, whereby namely when the solid combustible contains enough high amount of an inert
material, and when the gaseous oxidizer contains enough high fraction of inert gas
component (Salganskii et al., 2008). It is due to the FC process organization – inert
components are very effective heat carriers, thus both combustible and oxidizer can be
overheated maximally before they enter into the zone of chemical reactions. Solid
combustible is heated due to gaseous combustion products, while gaseous oxidizer – due to
ash residue and solid inert material.
The most interesting peculiarity of combustion waves in such systems is the independence
of the stationary combustion wave temperature on the value of the reaction heat release (if it
is a positive value). After ignition the temperature in the combustion front increases until
the heat input (due to exothermic reactions) is equal to the side heat losses. Minimizing side
heat losses the thermal equilibrium is reached at very high temperature, enough for
considerable increase of chemical reaction rates. So, heat losses in FC processes play more
important role than in case of classic combustion waves, because in the case of FC the heat
losses determine to more considerable degree the temperature in the reaction zone
Temperature profile of such combustion wave is shown schematically in Fig.2. Due to an
intensive heat exchange between source reagents and combustion products the released
energy is accumulated mainly close to the combustion zone. If the mixture has a small heat
release value (e.g. a mixture of carbon with a high amount of an inert material) the FC
process will accumulate the heat energy with a lower rate and therefore it will reach the
stationary regime longer.
At conditions of counter-current flows of combustible and oxidizer the combustion rate (that
is very important characteristic) is determined mostly not with the heat transfer rate, but
with the rate of reagents supply into the combustion zone (that is with the filtration rate).
Mass Transfer in Filtration Combustion Processes
485
Besides, before the combustion zone (in Fig. 1 and 2 - to the right of the high temperature
area where the main chemical exothermic reactions run with highest effectiveness) the
reducing zone exists with high amount of combustible and rather high temperature, that
results in complete gaseous oxidizer consumption. Behind the combustion zone (in Fig. 1
and 2 - to the left of the high temperature area), contrariwise, there is a hot zone with high
content of oxidizer, that provides the completeness of the material burning.
In view of the aforesaid, it is obvious that the FC process is very attractive for industry,
particularly when it is needed
• To burn cheaply a material containing small amount of combustible
• To obtain high combustion temperatures,
• To provide maximal fullness of solid fuel burning,
• To get space separation of zones (heating, pyrolysis, evaporation, oxidation,
condensation, cooling etc.) in solid porous fuel.
Hereby the energy outlay may be minimal due to effective heat recuperation in FC waves.
Fig. 1. Schema of combustion wave with superadiabatic heating. The solid combustible
material – small balls, while the inert material – big balls. The solid material flow – right to
left, the gas flow – left to right. High-temperature zone – the area with more light
background
Fig. 2. Temperature and concentration profiles of the combustion wave in case of equal heat
capacities of the flows of condensed and gaseous phases
Mass Transfer in Multiphase Systems and its Applications
486
2. Peculiarity of the physical and chemical structure of FC
2.1 The simplest case of FC process
There are many possibilities to realize mass transfer in FC processes. The simplest case in
one-dimensional approximation is the chemical interaction of counter-current of solid fuel
flow with gaseous oxidizer (being filtrating through the solid material) flow when a single
combustion product forms. We are expecting the presence of both inert material in the solid
fuel and other gaseous components (that do not participate in chemical reactions, e.g.
nitrogen) in gaseous oxidizer. Hereby, depending on the phase state of the combustion
product, this product is added to the respective flow through the reaction zone. For
example, at carbon oxidation the combustion product is gaseous carbon dioxide, while at
aluminum oxidation it is solid aluminum oxide. So, we have an interphase mass transfer of
either solid fuel to gaseous product (Fig. 3b) or gaseous oxidizer to solid product (Fig. 3b). In
both cases the whole redox process and the summary heat release are concentrated in the
single reaction zone.
Fig. 3. Mass flows through the reaction front in cases of: a) gaseous products (Pg) and
b) solid products (Ps). Og and Ig – gaseous oxidizer and inert; Fs and Is – solid fuel and inert
substances, correspondingly
Let's presume that the temperature level in the reaction zone is enough high, it allows to
consider this zone width being negligible small in comparison with the warming-up zone of
the combustion wave. Besides we presume that the interphase heat-transfer at the filtration
process is so effective that the difference between temperatures of solid and gaseous phase
is negligible. Then depending on real conditions (combustible concentration in the solid
mixture and oxygen concentration in gaseous oxidizer) the heat structure of the FC wave
may be either like the curve in Fig.4a (”reaction trailing” structure), or like the curve in
Fig.4b (”reaction leading” structure). The type of the heat structure is determined with the
ratio of heat capacities of counter-current solid and gas flows through the reaction front
(Aldushin et al.,1999; Salganskii et al., 2008). The heat, released in combustion, is removed
with the gas flow in the case of the reaction trailing structure, while in the case of the
reaction leading structure it is removed with the solid material flow. These two heat flows
determine the type of the profile of the FC wave. It is possible that two these heat flows are
equal, it provides a symmetric profile of the combustion wave and maximal heat
accumulation in the combustion wave [Aldushin et al.,1999]. In this case the heat of
Mass Transfer in Filtration Combustion Processes
487
chemical reactions is removed with both solid material and gas. In all considered cases an
intensive interphase heat-transfer results in the accumulation of all released heat near the
combustion front. If the reactor is long enough, all products leave it at the initial
temperature. Continuous heat energy accumulation results in the expansion of the
warming-up zone in the direction either of the solid material or gas flow depending on the
type of the heat structure of the FC wave. When side heat losses exist, a stationary profile
of combustion wave can form. When side heat losses are negliglible, a stationary process is
possible at uncompleted heat-transfer only, in this case either gas or solid material leaves at
hot temperature.
Fig. 4. Temperature profiles of combustion wave in case of there is no heat losses: a) –
reaction leading heat structure, b) – reaction trailing structure. Hatchs indicate zones of
chemical reactions
2.2 Attended processes of evaporation and condensation
The heat structure of the FC wave determines conditions of compounds heating at
combustion wave propogation, and all accompanying physical and chemical processes. For
example, the presence of an additional volatile component in the solid fuel (besides the
combustible itself and an inert material) results in the localization of the zone of this
component concentration (evaporation – condensation) in the region of the fuel warming-up
(Fig. 5a). The main heat release, providing the existence of whole FC wave structure, takes
place in the combustion front. Evaporation process occurs due to convective heat flow from
the combustion front. Mass transfer of the vaporized component with the gas flow takes
place before the area of condensation. If the convective heat flow from the combustion front
is higher than heat losses for the evaporation, the zone of the accumulation of the vaporized
component expands. If there are side heat losses the expansion of this zone ends sooner or
later, and further all processes set moves stationary as a batch.
In the case of the reaction leading structure, the evaporation zone is situated near the
combustion front, which determine and provide the FC wave structure. Therefore
considerable heat expenses for the evaporation may decrease the combustion front
temperature, and surely it has an influence on all characteristics of FC waves. In the case of
reaction trailing structure, the heat expenses for the component evaporation decrease the
temperature in the region of warming-up, not in the combustion front, therefore these heat
expenses do not influence the value of heat release in the combustion front. It is an
extraordinary peculiarity of these regimes of the FC. The zone of condensation of vaporized
component is situated a bit farther along the gas flow. The condensation process is
accompanied with some heat release, therefore in this case there is not mass transfer only,
but heat transfer from one zone to another one too.
Mass Transfer in Multiphase Systems and its Applications
488
Typical example of vaporized component presence is the fuel moisture. Due to
superadiabatic heating it is possible to organize the FC regimes where high content of
moisture does not prevent propagation of stable combustion wave (Salganskaya, 2008).
It is not necessary that the condensation of the vaporized component occurs always to its
accumulation in the determined reactor zone. For example, the water condensation occurs to
an aerosol forming. The higher size of drops of the liquid, the easier they sediment on the
initial solid material during the filtration process. Temperature gradients in the FC wave
may be very high. In this case a high rate of the gas cooling occurs to forming very small
drops (less than 10
-6
m), which sediment badly under filtration and may be removed (as a
fog) from the reactor with the gas flow. Thus, it is rather simple to organize the extraction of
a volatile component from the source solid material.
Fig. 5. Heat structure of the FC wave, propagating through a porous solid fuel: (a) – in case
of an evaporating component, and (b) – in case of pyrolytic decomposition of the fuel
2.3 Peculiarities of filtration combustion of carbonic systems
Layer burning of carbonic fuel has been used long since, and many systems of gas
generators, industrial furnaces work still using this process. The combustion of porous
burden containing solid carbonic fuel and incombustible material at air or another oxygen-
containing gaseous oxidizer filtration is of great interest for industrial application in
processes of solid fuel burning optimization, as well as for developing environmentally
friendly methods for different combustible wastes recycling.
Heterogeneous carbon oxidation is a complicated and multistage process. The final product
are carbon dioxide and monoxide. There is no sure answer which one of these two oxides is
the primary product of the carbon particles oxidation, and which one forms already in the
gas phase. It is so difficult to find out it because as soon monoxide forms it may be oxidized
immediately to dioxide, while dioxide at rather high temperature may be reduced to
monoxide above carbon surface. Currently most part of researchers guess that in result of
heterogeneous processes two oxides form together (Lizzio et al., 1990; Bews et al., 2001;
Chao’en & Brown, 2001). Oxidation mechanism and the quantitative ratio of formed oxides
depend on conditions (temperature, pressure etc.) as well as on properties of carbon
particles surface.
At the interaction of the main components of FC in counter-current flows of solid fuel and
gaseous oxidizer, a zone structure forms, each zone differs from another one in temperature
and reagents concentrations. In the main zone of heat release (combustion front) carbon is
Mass Transfer in Filtration Combustion Processes
489
oxidized to CO and CO
2
. In case of ”reaction leading” wave structure solid combustion
products near combustion front stay in oxygen medium at high temperature, that's why
here carbon burns completely. However it is possible that oxygen is not expended
completely because a quickly gas flow cooling behind the combustion front may occur to
oxidation reactions deceleration.
In case of ”reaction trailing” wave structure the appearance of mass transfer is entirely
different. Solid products, leaving the combustion front, cool abruptly. Hereby regimes with
incomplete carbon combustion are possible. Contrariwise, gaseous combustion products get
through high-temperature area with big amount of hot carbon. It leads to complete oxygen
exhaust, as well as to forming the zone of endothermic reactions, where carbon dioxide may
be reduced to monoxide:
CO
2
(g) + C(s) = 2 CO(g) – 172 kJ
Besides if water steam there is in gaseous oxidizer (steam-air gasification), other very
important reaction proceeds in the same zone on the carbon surface:
H
2
O(g) + C(s) = CO(g) + H
2
(g) – 131.2 kJ.
These reactions proceed with considerable rate only at enough high temperature, therefore
they decrease local temperature in the hottest places. Hereby two combustible gases appear
in gaseous combustion products: an additional carbon monoxide, and considerable amount
of hydrogen (at steam-air gasification up to 30 vol.%). So, depending on conditions the FC
of carbonic systems can proceed by considerably different ways, and with different results.
These peculiarities of the heat structure of the FC waves at carbonic systems combustion
have to be considered at industrial realization of technologies based on superadiabatic
condition regimes.
2.4 Attended processes of thermal decomposition at filtration combustion wave
The structure of the FC waves may be rather complicated. The main heat release in the
combustion front determines the common temperature level. When components
predisposed to thermal decomposition there are in the solid fuel, a new zone forms in the
combustion wave structure: zone of corresponding chemical processes. For example, if
there is calcium carbonate (chalk, buhr) in carbonic fuel, during the heating it will
decompose in a varying degree, dependently on temperature. Hereby solid combustion
product (quicklime) remains in the burden, while gaseous carbon dioxide removes
together with other gaseous combustion products. Fig.6a shows the results of the
thermodynamic calculations of the equilibrium CaCO
3
↔ CaO + CO
2
at the pressure 1
atm in air medium at temperatures since 800 up to 1200 K. On the other hand if for
example there is copper oxide CuO in the burden, CuO begins to decompose (Fig.6b) at
high temperature (higher than 1400 K) and an additional oxygen appears in gaseous
combustion products, then this oxygen reacts immediately with the fuel. In this case the
combustion wave structure is complicated because of two new zones (the zone of CuO
decomposition and an additional zone of the fuel oxidation) appearance. Hereby in each
zone individual physical and chemical processes proceed accordingly the temperature
level and reagents concentration.
Mass Transfer in Multiphase Systems and its Applications
490
Fig. 6. Thermodynamic equilibrium in systems containing CaCO
3
(a) and CuO (b)
In this system mass transfer may be too complicated. Details of the temperature profile of
the complex combustion wave reflect all processes with heat release and heat absorption.
2.5 Filtration combustion of fuel able to pyrolytic decomposition
Filtration combustion of organic fuel is a particular case of combustion wave with thermal
decomposition processes. Being heated theses fuels usually pyrolyze forming liquid and
gaseous products, as well as coke residue. Typical examples are organic fuels: wood, peat,
natural coals etc.
In this case the heat wave structure is complicated – a new zone of thermal decomposition
appears before the combustion front (Fig. 5.b). Pyrolysis proceeds in the zone of solid fuel
warming-up where no oxygen presents. Usually thermal effect of pyrolysis is rather small in
comparison with heat release in the combustion front.
Usually solid coke residue, pyrolysis tars, and gaseous destruction products form during
the pyrolysis. Then the coke falls into the combustion zone and burns there. At relatively
high temperature pyrolysis tars stay in gas state and move with the gas flow and gaseous
pyrolysis products from pyrolysis zone into the region with lower temperature. There the
pyrolysis tars, which is a mixture of different hydrocarbons, condense. It provides
appearance of zone of liquid products accumulation, like the zone of the volatilile
components accumulation, but with the only difference – the origin of the products
accumulated in these zones is different.
The content of pyrolysis tars is rather complicated and it may be different depending on the
nature and properties of the material under pyrolysis, as well as on the rate and
intensiveness of the heating. There are thousands of organic substances in pyrolysis tars,
among them many toxic substances. The worth of these tars is not considerable because in
order to obtain any goods (e.g. motor-fuel) it is necessary to organize rather complex
chemical processes. So, at this stage it is appropriate to burn pyrolysis tars and to obtain
heat or electric energy. However we have to consider the possibility to develop technology
of liquid fuel producing from non-petrolic source, moreover this source may free, even have
a negative price (if one utilizes some kinds of organic waste).
Mass Transfer in Filtration Combustion Processes
491
Pyrolysis tars, which condense in gas flow at its cooling, form aerosol by the same way as
volatile components do. And by the same way pyrolysis tars may be removed (as small fog
drops) together with the gas flow from the reactor (Salganskii et al., 2010). Unlike moisture
and other incombustible components, pyrolysis tars are combustible and may be burnt in
presence of gaseous oxidizer.
3. Characteristics of filtration combustion of some metal-containing systems
Investigations on FC processes showed (Manelis et al., 2006) that this process may be
successfully used for some metal extraction, namely metals, which can form relatively
volatile products (products of oxidation as well as of reduction), because even at their low
concentration in the gas phase the may be removed together with gas flow, shifting the
thermodynamic equilibrium to the needed direction. The most interesting is the realization
of FC in superadiabatic regime for extraction less-common metals from unconventional
sources – poor ores, burrows etc.
Mass transfer of different metal derivatives in the FC waves may be successfully realized
because the pressure of saturated steams of some metals themselves and some of their
derivatives at temperatures from 800 to 1200
o
C (typical temperature for FC processes) is
enough for their extraction. As objects of this kind of mass transfer may be considered some
free metals (Zn, Cd, Hg, As, Se, Tl, Ta) as well as some oxidized forms (trioxides of
molybdenum and rhenium, oxides of selenium, tellur, tantalum, tungsten hydroxides). New
possibily appears to develop effective technologies for extraction valuable metals from
unconventional sources.
All physico-chemical processes said above, which can realize mass transfer and extraction of
valuable metals, may be realized without using filtration combustion, that is by known
methods, but only in superadiabatic regime of FC due to maximal level of heat recuperation,
and therefore due to maximal heat efficiency, it is possible to realize the same processes with
minimal energetic expenses, that is maximally effectively from an economic point of view.
Naturally, mass transfer of relatively volatile substances from the reaction zone is
accompanied with incessant processes of evaporation (as the zone of this substance staying
is heated) and condensation (as steams of this substance falls into the zone with lower
temperature). So, when a few products move from the initial mixture they may be separated
spatially depending on their volatility, adsorption coefficients etc. Fig.7 demonstrates that in
FC of mixture where, besides fuel and inert material, additionally iron, zinc, and cadmium
(iron is not volatile, cadmium volatility is far higher than zinc volatility) present , the iron
concentration does not change, while concentration of zinc and cadmium change so manner,
that there is an incessant accumulation of these metals in determined places. The zone of
cadmium maximal accumulation is farther from the combustion front than the zone of zinc
maximal accumulation.
The fact that in filtration combustion process the whole reaction zone anytime is separated
on two parts – oxidation zone and reducing one, is very useful if one considers filtration
combustion regime as a way for metals mass transfer. All reactor volume is not uniform,
there are zones with different temperatures and different redox nature of gaseous phase
there. The zone left to combustion front (Fig. 3a) is the oxidizing zone, right to combustion
front (Fig. 3b) – reducing zone.
This peculiarity should be used for the optimization of processes of different metals
extraction. For example, when we extract molybdenum (MoO
3
is far more volatile is
Mass Transfer in Multiphase Systems and its Applications
492
individual metal) we have to organize a combustion process in ”reaction leading” mode
(Fig. 4a). In this case Mo-containing products form in the oxidizer zone (naturally at rather
high temperature though lower than combustion front temperature) relatively volatile
MoO
3
which moves together with the gas flow behind combustion front.
Fig. 7. Zones of metals accumulation separation in the wave of filtration combustion
When we want to realize mass transfer of metals having rather volatile reducing forms (e.g.
free metals such as Zn, Cd) we have to organize FC in regime with ”reaction trailing”
structure. Then this compounds reduce with carbon monoxide before the combustion front
in hot reducing zone (Fig.4b) and metal vapour moves together with gas flow and may be
extracted or at least accumulated in burden portions left of combustion front.
A correct choice of combustion regime for realization of mass transfer of the giving metal
may be obtained preliminary from results of thermodynamic calculations of equilibrium
concentrations (e.g. using the code TERRA (Trusov, 2002). For example, we are representing
results of thermodynamic estimation of the system containing metallurgy tailing containing
high amount of iron and zinc. We looked for the possibility to extract useful metals from
secondary heavytonnage source (there are million tons of this kind of tailing in Russia only),
which can not be recycled with economic effect using traditional technologies. One of real
samples has been investigated, it contains (mass.%%): Fe-28.4; Zn-12.05; Ca-5; Si-2.65; Mn -
1.26; Pb-1.07; Mg-0.86; Al-0.2; Cr-0.16; Cu-0.11 and P-0.037. Thermodynamic analysis
considered atmosphere pressure and temperature from about 500 till 1300°C with different
oxygen concentration. As result we got the listing of possible reaction products and their
equilibrium concentration in the given conditions. It gave the first resumes and ideas. It was
shown that zinc and lead are the most interesting for their extraction using FC processes. Zn
and Pb forms the most volatile substances. In oxidizing zone (Fig.8) practically all zinc stays
in condensed phase (as ZnO(c)), so it is too hard to extract zinc using the regime ”reaction
trailing” structure of combustion wave. Changing the gas content in direction to CO excess,
Zn-containing substances begin to be reduced starting from determined temperature and
form free metal that moves to the gas phase (vapor pressure of Zn is 0.00002 MPa at 1200 K
and 0.0001 MPa at 1300 K). If initial coal portion in the mixture increases (that is the ratio
O/Zn decreases) Zn vaporizes at lower temperature (compare Fig 8b and 8c), and therefore
it makes process of Zn extraction easier.
Mass Transfer in Filtration Combustion Processes
493
As for lead, unlike Zn even in oxidation zone there are enough Pb-containing substances
(different oxides) in the gas phase, at temperature higher than ~1000
o
C practically a half of
Pb is already in the gas phase, up to~1400
o
C mainly in the forms of Pb2O(g) and PbO(g).
Change of gas medium properties (in reducing medium) gaseous Pb appears beginning
from ~800
o
C, and by ~1200
o
C it remains practically the only Pb-containing gaseous product
(vapor pressure of Pb is 0.00016 MPa at 1200 K, and 0.0028 MPa at 1300 K). Unlike the case
with Zn, systems, containing Pb, do not change with the change of reducing potential
(compare curves on Fig. 8b and 8c, they are practically the same.
Fig. 8. Main substances, containing Zn and Pb
a) in oxidizing gas medium with oxygen excess,
b) in reducing gas medium, where the most part of carbon is in CO,
c) in reducing gas medium, where the most part of carbon is in carbon itself