Mass Transfer in Multiphase Systems and its Applications Part 14 pptx
Bạn đang xem bản rút gọn của tài liệu. Xem và tải ngay bản đầy đủ của tài liệu tại đây (2.15 MB, 40 trang )
Mass Transfer in Hollow Fiber Supported Liquid Membrane for
As and Hg Removal
from Produced Water in Upstream Petroleum Operation in the Gulf…
509
4. HFLSM applications for arsenic and mercury removal
Types of the extractants and stripping solutions are pivotal to the success of As and/or Hg
separation. Iberhan and Wisniewski (Iberhan and Wisniewski, 2002) extracted As(III) and
As(V) using the organic extractants of Cyanex 925, Cyanex 301 and a mixture between
Cyanex
925 and Cyanex 301 at different volumetric ratios. The result showed that Cyanex
301
provided higher extraction of As(III) than As(V). The mixture of Cyanex 925 and Cyanex
301 helped remove As(V) significantly, while pure Cyanex 925 could extract As(V) a little
better than As(III). Fabrega and Mansur (Fabrega & Mansur, 2007) extracted Hg(II) from
HCl solution by Aliquat 336 dissolved in commercial Kerosene Exxol D-80. Mercury was
almost extracted within 5 min at pH ≥ 1 and was satisfactorily stripped out about 99% by
using thiourea as the stripping solution. Chakrabarty (Chakrabarty et al., 2010) found that
by using triocthyamine (TOA) as the extractant in liquid membrane, Hg(II) could be
extracted from pure solution more than lignosulfonate-mixed solution.
Knowledge from the past researches elicited our research group to progress further for the
effective removal of arsenic/mercury ions from the produced water via HFSLM.
Sangtumrong (Sangtumrong et al., 2007) simultaneously separated Hg(II) and As(III) ions
from chloride media via HFSLM by TOA dissolved in toluene as the extractant and NaOH
as the striping solution. Prapasawat (Prapasawat et al., 2008) used Cyanex 923 dissolved in
toluene to separate As(III) and As(V) ions from sulphate media with water as the stripping
solution via HFSLM. It was found that more As(V) could be extracted than As(III). Uedee
(Uedee et al., 2008) obtained 100% extraction and 97% recovery of Hg(II) ions from chloride
media via HFSLM using TOA dissolved in kerosene as the extractant and NaOH as the
stripping solution. Recently, Pancharoen (Pancharoen et al., 2009; 2010) separated arsenic
and mercury ions from the produced water from different gas fields in the Gulf of Thailand
by HFSLM. Aliquat 336 dissolved in kerosene was a proper extractant with 91% arsenic
extraction for the produced water without mercury contamination.
The discussions of the results from our research group are provided in the following sub
topics (1) selective arsenic removal, (2) selective mercury removal and (3) simultaneous
arsenic and mercury removal.
4.1 Selective arsenic removal
A number of researchers sought the organic extractants to remove arsenic ions, mostly they
worked in a lab scale using synthetic feeds. Cyanex 301, Cyanex 923, Cyanex 925, a mixture
of Cyanex 301 and Cyanex 925, tri-n-butylphosphate (TBP), hydrophobic glycol and
hydroxamic acids were used to remove As(III) and As(V) from sulfuric acid solution by
liquid–liquid extraction. The acidic reagent, Cyanex 301, could extract As(III) better than
As(V). Cyanex 925 and Cyanex 923 were found more suitable for As(V) extraction than
As(III) (Wisniewski, 1997; Meera et al., 2001).
Arsenic in the produced water is predominantly in the species of arsenite As(III) and arsenate
As(V). The As(III) normally occurs as H
3
AsO
3
and H
2
AsO
3
−
complexes. While As(V) occurs as
H
3
AsO
4
, H
2
AsO
4
−
, HAsO
4
2−
and AsO
4
3−
. But for the produced water from the Gulf of Thailand,
As(III) usually presents in un-dissociated neutral H
3
AsO
3
and As(V) presents in dissociated
anion complexes of H
2
AsO
4
−
and HAsO
4
2−
(Wilson et al., 2007). The As(V) takes majority part
of total arsenic in the produced water where the pH is found in the range of 6-6.5. It appears
that the removal of arsenic from produced water has to deal with spectroscopic range of
arsenic in the water. Therefore, three different types of potential organic extractants for arsenic
removal have been investigated in which the summary resultsare provided herewith.
Mass Transfer in Multiphase Systems and its Applications
510
(a) (b) (c)
Fig. 6. Chemical structures of the organic extractants: (a) Aliquat 336, (b) Cyanex 301, and (c)
Cyanex 923 (Mohapatra and Manchanda, 2008)
4.1.1 Arsenic extraction using aliquat 336 (basic extractant)
Aliquat 336 (CH
3
R
3
NCl) is the basic organic extractant which has an ability to react with
both dissociated forms (H
2
AsO
4
−
and HAsO
4
2−
) and un-dissociated form (H
3
AsO
3
) of the
arsenic ions. The transport mechanism for arsenic removal is driven by the concentration
gradient of hydroxide ion (OH-) in counter with arsenic ion transport direction. For clear
illustration, the schematic transport mechanism is provided in Figure (7) for the extraction
of H
2
AsO
4
−
using Aliquat 336. The extraction reaction and recovery reaction are
demonstrated in Equations (25) – (30). Term X
−
in the equations is denoted as Cl
−
in feed
and membrane phases for the first cycle, and OH
−
(a counter ion in the stripping phase) will
take over the place of Cl
−
in the next cycles (Porter, 1990).
Extraction reactions of dissociated arsenic forms by Aliquat 336
2 4 33 33 2 4
()()HAsO CHRN X CHRN HAsO X
−
+− + − −
+⋅ +U (25)
22
433 3324
2( ) ( ) ( ) 2HAsO CH R N X CH R N HAsO X
−
+− + − −
+⋅ +U (26)
Extraction reactions of un-dissociated arsenic forms by Aliquat 336
33 33 33 33
()()H AsO CH R NCl CH R NCl H AsO+ U (27)
Recovery reactions of arsenic-Aliquat 336 complex
33 24 33 24
()()CH R N H AsO NaOH CH R N OH NaH AsO+⋅+U (28)
33 2 4 33 2 4
()()2 2CH R N HAsO NaOH CH R N OH Na HAsO+⋅+U (29)
33 3 3 33 3 3 2
()()3 3CH R NCl H AsO NaOH CH R NCl Na AsO H O+++U (30)
Using 0.75 M (35% v/v) Aliquat 336 as the organic extractant and 0.5 M NaOH as the
stripping solution, successful reduced arsenic to meet the permissible limit (< 250 ppb). The
percentage of the recovery of arsenic ions increased with the concentration of sodium
hydroxide up to 0.5 M. After 3-cycle operation, 91% of arsenic extraction from the produced
water and 72% of arsenic recovery were achieved (Pancharoen et al., 2009).
Mass Transfer in Hollow Fiber Supported Liquid Membrane for
As and Hg Removal
from Produced Water in Upstream Petroleum Operation in the Gulf…
511
Fig. 7. Schematic representation of H
2
AsO
4
−
coupled transport with Aliquat 336
Fig. 8. Schematic representation of AsO
+
coupled transport with Cyanex 301
4.1.2 Arsenic extraction using cyanex 301 (acidic extractant)
Cyanex 301 is an acidic organic extractant which is recommended as an effective extractant
for cation arsenic such as AsO
+
from the dissolution of H
3
AsO
3
(Iberhan & Wisniewski,
2002). The transport mechanism is schematically illustrated in Figure (8). The process is
driven by the hydrogen ion in counter with arsenic ion transport. The extraction and
recovery reactions are described in the following equations:
AsO HR RAsO H
+
+
++U (31)
Mass Transfer in Multiphase Systems and its Applications
512
2
RAsO NaOH NaR HAsO++U (32)
For arsenic extraction using Cyanex 301 via HFSLM, the results were reported with
relatively high percentage of extraction but with very low percentage of recovery
(Pancharoen et al., 2009). The poor performance of recovery is explained by the strong bond
that arsenic ions (AsO
+
) make with Cyanex 301 and it is difficult for the stripping solution to
break the bond (Iberhan & Wisniewski, 2002). This finding does not promote the favor of
using Cyanex 301 as it offers an effective extraction while obtaining unacceptable recovery.
4.1.3 Arsenic extraction using cyanex 923 (neutral extractant)
Cyanex 923 or trialkylphosphine oxides (TRPO) is a neutral extractant which is
recommended to use for the removal of un-dissociated neutral arsenic ions (Wisniewski,
1997; Meera et al., 2001). In the produced water, HAsO
2
is the neutral species of As(III) and
H
3
AsO
4
is the neutral species of As(V). The extraction of As(III) and As(V) by Cyanex 923 is
proposed in Equations (33) and (34), respectively.
22
HAsO H TRPO HAsO H TRPO
++
++ ⋅⋅U (33)
34 34
HAsO H TRPO HAsO H TRPO
++
++ ⋅⋅U (34)
Using water as the stripping solution in the study, the recovery reactions are described as
follows:
222
HAsO H TRPO H O HAsO H TRPO
++
⋅⋅ + ++U (35)
34 2 34
H AsO H TRPO H O H AsO H TRPO
++
⋅⋅ + ++U (36)
All equations above can be presented in the schematic diagram of arsenic transport as
shown in Figure (9). Our work (Prapasawat et al., 2008) reported the study of using Cyanex
923 (30% v/v) diluted in toluene as the organic extractant and water as the stripping
solution, the maximum arsenic extraction was 38% for As(III) species and 45% for As (V)
species. Poor arsenic extraction performance was observed from Cyanex 923. This should be
attributed to the low contribution of neutral arsenic in the feed and Cyanex 923 can work
with neutral species only.
Fig. 9. Schematic representation of neutral As(III) with Cyanex 923
Of all three investigated extractants, Aliquat 336 attains high percentages of extraction and
recovery of arsenic ions. This is due to its ability to react with both dissociated forms
Mass Transfer in Hollow Fiber Supported Liquid Membrane for
As and Hg Removal
from Produced Water in Upstream Petroleum Operation in the Gulf…
513
(H
2
AsO
4
−
and HAsO
4
2−
) and un-dissociated form (H
3
AsO
3
) of the arsenic which takes the
majority part of total arsenic contribution in the produced water.
4.2 Selective mercury removal
Most of mercury in the produced water is an elemental form Hg(0) with the rest of inorganic
form such as HgCl
2
or Hg(II). To remove mercury, the elementary mercury is normally
taken by a chemical treatment process using an oxidant, ferric ions and flocculent to form a
removable sludge containing mercury, which is known as an effective solution for the
removal of mercury of high concentration. The residual mercury after the chemical
treatment will be diluted and extracted via HFSLM subsequently. Uedee (Uedee et al., 2008)
revealed that high extraction and recovery performances of mercury using HFSLM could be
constantly maintained under the dilute mercury concentration system.
Normally, the mercury species after chemical treatment are in the form of Hg(II). The
existence of Hg(II) comes from inorganic mercury HgCl
2
originally in the produced water
and the undesired conversion of elementary mercury in the chemical treatment process. For
the latter, the oxidation reduction potential is the contributory factor for the conversion. If
the oxidation reduction potential exceeds the controlled limit, the elementary mercury is
often converted to ionic mercury form of Hg(II) resulting in seriously degradation in the
overall treatment process (Frankiewicz & Gerlach, 2000).
Sangtumrong (Sangtumrong et al., 2007) and Uedee (Uedee et al., 2008) removed Hg(II)
from Hg(II) contaminated synthetic chloride water using tri-n-octylamine (TOA) by
HFSLM. Pancharoen (Pancharoen et al., 2010) succeeded a similar work but used the
produced water as the feed. The results corresponded closely; implying that the
predominant Hg(II) species in the produced water is valid.
TOA is a basic organic extractant and its chemical structure can be referred to Figure (6).
TOA in
toluene is found to be the most selective mercury extractant (Sangtumrong et al.,
2007; Uedee et al., 2008). However, feed pretreatment is necessary in order to deprotonate
the Hg(II) of neutral HgCl
2
to anion form which is suitable for the function of the basic
extractant (Ramakul & Panchareon, 2003). Equation (37) shows the Hg(II) deprotonation by
HCl.
2
24
22H
g
Cl HCl H
g
Cl H
−
+
+→ + (37)
Subsequent to the feed pretreatment, mercury ions in the form of HgCl
4
2−
will react with the
organic extractant (TOA, shown as R
3
N) to form the complex species as seen in Equation
(38):
2
43324
22 ( )H
g
Cl H R N R NH H
g
Cl
−+
++ ⋅U (38)
The mercury complex species diffuse to the opposite side of the liquid membrane by the
concentration gradient and react with NaOH, a stripping solution. The HgCl
4
2−
ions are
recovered to the stripping phase, shown in Equation (39):
2
32 4 3 4 2
() 2 2 2R NH HgCl OH R N HgCl H O
−−
⋅+ + +U (39)
After the stripping reaction, TOA is diffused back to the feed-membrane interface according
to its concentration gradient, and again TOA is reacted with HgCl
4
2−
ions from the feed.
Mass Transfer in Multiphase Systems and its Applications
514
Thus, the transport mechanism of Hg(II) ions in the produced water through liquid
membrane can be illustrated in Figure (10).
Fig. 10. Co-transport scheme of HgCl
4
2−
by TOA extractant
Pancharoen (Pancharoen et al., 2010) found that the highest percentages of extraction and
recovery of 99.8% and 62%, respectively were achieved in 300 min by a 6th-cycle operation,
pH of the feed solution of 2.5, 2% (v/v) TOA, 0.5 M NaOH using 50 mL/min of feed and
stripping solutions.
4.3 Simultaneous arsenic and mercury removal
A successive attempt on simultaneous removal of arsenic and mercury from the produced
water was investigated. The focused species to be extracted were dissociated As(V) as
H
2
AsO
4
-
and Hg(II) as HgCl
2
since they were key contaminated arsenic/mercury in the
produced water. To enhance the separation of arsenic and mercury, the synergistic
extraction by using the mixture of the organic extractant was examined. Equation (40)
defines the synergistic extent in terms of synergistic coefficient (R) relating to the
distribution coefficients (Luo et al., 2004).
max
12
D
R
(D D )
=
+
(40)
D
max
is the maximum distribution coefficient or the distribution ratio of the synergistic
system to extract the specifed ions, and (D
1
+ D
2
) is the summation of the distribution
coefficient from each single extraction system. The greater synergistic coefficient means that
the mixture of the extractant has synergistic effect on arsenic/mercury extraction. Figure
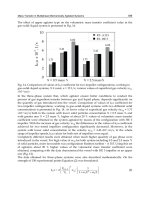
(11) shows a comparative plot of the maximum percentages of the extraction of arsenic and
mercury ions from the produced water against the different extractants. The sequences of
the percentages of extraction are as follows.
As: Aliquat 336+Cyanex 471 > Aliquat 336 > Bromo-PADAP > Cyanex 471 > Cyanex 923,
Hg: Aliquat 336+Cyanex 471 > Aliquat 336 > Cyanex 923 > Bromo-PADAP
≈ Cyanex 471
It was reported that the mixture of 0.22 M Aliquat 336 and 0.06 M Cyanex 471 provided the
highest extraction of both arsenic and mercury. The calculated synergistic coefficient (R) to
arsenic ions of Cyanex 471 was 2.8; the value greater than 1 indicated that the mixture of
Aliquat 336 and Cyanex 471 had the synergistic effect on arsenic extraction.
Among the stripping solutions used in this work, i.e., NaOH, DI water, HNO
3
and H
2
SO
4
,
thiourea (NH
2
CSNH
2
) was found to be the best stripping solution for arsenic and mercury.
Thiourea with large anion in the structure was strong enough to strip mercury complex ion
from Aliquat 336, which was composed of a large organic cation associated with a chloride
Mass Transfer in Hollow Fiber Supported Liquid Membrane for
As and Hg Removal
from Produced Water in Upstream Petroleum Operation in the Gulf…
515
Fig. 11. The maximum percentages of arsenic and mercury ions extraction from produced
water against types of the extractants: (A) 0.22 M Aliquat 336, (B) 0.002 M Bromo-PADAP,
(C) 0.06 M Cyanex 471, (D) 0.51 M Cyanex 923, (E) 0.22 M Aliquat 336 + 0.06 M Cyanex 471
ion. Moreover, water in aqueous thiourea also contributed to the recovery performance
according to the report of using water as the stripping solution for As(III) and As(V)
separation (Prapasawat et al., 2008). Using thiourea, no trace of the precipitates was
observed unlike NaOH which produced the precipitates with Hg resulting in membrane
fouling and poor transport performance in the membrane phase. The discharge
concentrations of mercury and arsenic in the produced water to the environment complied
with the legislation limits determined by the Ministry of Industry within 1-cycle separation
and 3-cycle separation, respectively.
−+
)ClNR(CH
33
-
Cl
-
42
AsOH
m(TIBPS)
m
-
4233
(TIBPS))AsO(H)NR(CH ⋅⋅
+
TIBPS
TIBPSH M
⋅
⋅
OH
2
M
+
H
22
CSNHNH
M
+
H
Fig. 12. Schematic extraction and stripping mechanisms of H
2
AsO
4
-
by the synergistic
extractant of Aliquat 336 and Cyanex 471 (TIBPS) with thiourea as the stripping solution
−2
4
HgCl
−+
)ClNR2(CH
33
n(TIBPS)
n
-2
4233
)TIBPS()(HgCl)NR(CH ⋅⋅
+
−
Cl2
)CSNHy(NH
22
y222
)CSNHNH(HgCl
Fig. 13. Schematic extraction and stripping mechanisms of HgCl
4
2-
by the synergistic
extractant of Aliquat 336 and Cyanex 471 (TIBPS) with thiourea as the stripping solution
Mass Transfer in Multiphase Systems and its Applications
516
The descriptive illustrations of the extraction and stripping mechanisms of arsenic/mercury
ions by the mixture of Aliquat 336 ((CH
3
R
3
N
+
)Cl
-
) and Cyanex 471 (TIBPS) as the synergistic
extractant, and thiourea (NH
2
CSNH
2
) as the stripping solution, are shown in Figures (12)
and (13).
The synergistic extraction reactions are shown in Equations (41) - (44).
Extraction by Aliquat 336
As(V)
-+- +-
24 33 33 24
H AsO CH R N Cl (CH R N ) (H AsO ) Cl
−
+⋅+ (41)
Hg(II)
2- + + 2-
433 3324
H
g
Cl 2CH R N Cl (CH R N ) (H
g
Cl ) 2Cl
−
−
+⋅+ (42)
Extraction by the mixture of Aliquat 336 and Cyanex 471 (TIBPS)
As(V)
24 33 33 24 m
H AsO CH R N m(TIBPS) (CH R N ) (H AsO ) (TIBPS)
++
++ ⋅⋅ (43)
Hg(II)
2 2-
433 3324 n
H
g
Cl 2(CH R N ) n(TIBPS) (CH R N ) (H
g
Cl ) (TIBPS)
−+ +
++ ⋅⋅ (44)
where, the stoichiometric coefficients of m and n were calculated from the distribution
coefficients of the relevant components at various concentrations of the extractant used.
Extraction by Cyanex 471 (TIBPS) for un-dissociated arsenics
As (III &V)
M
H TIBPS M H TIBPS
+
++ ⋅⋅
(45)
where, M stands for H
3
AsO
3
(As(III)) or H
3
AsO
4
(As(V)). Cyanex 471 (TIBPS) is the neutral
organic extractant and effective for un-dissociated ions (Wisniewski, 1997) including un-
dissociated arsenic such as H
3
AsO
3
(As(III)) and H
3
AsO
4
(As(V)) in the produced water.
Accordingly, it is regarded as an enhancement to arsenic extraction, on top of primarily
focused species of dissociated H
2
AsO
4
-
.
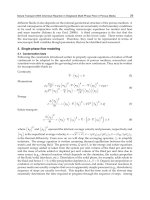
4.3.1 Distribution coefficients and extraction equilibrium constants
Subject to the mass transport analysis, the following terms of the extraction equilibrium
constant (K
ex
)
and
the
distribution ratio are expressed
by
Equations (46) – (49).
The extraction equilibrium constants (K
ex
) of arsenic and mercury ions:
m
33
-
42
m
-
4233
Asex,
]TIBPS][NRCH][AsO[H
](TIBPS))AsO(H)NR[(CH
K
+
+
⋅⋅
=
(46)
n
2
33
-2
4
n
-2
4233
Hgex,
[TIBPS]]NR[CH][HgCl
] (TIBPS))(HgCl)NR[(CH
K
+
+
⋅⋅
=
(47)
The distribution coefficients (D) for arsenic and mercury extractions by the mixture of
Aliquat 336 and Cyanex 471 (TIBPS):
Mass Transfer in Hollow Fiber Supported Liquid Membrane for
As and Hg Removal
from Produced Water in Upstream Petroleum Operation in the Gulf…
517
m
33Asex,
-
42
m
-
4233
As
[TIBPS]]NR[CHK
]AsO[H
](TIBPS))AsO(H)NR[(CH
D
+
+
=
⋅⋅
=
(48)
n
2
33Hgex,
-2
4
n
-2
4233
Hg
[TIBPS]]NR[CHK
][HgCl
](TIBPS))(HgCl)NR[(CH
D
+
+
=
⋅⋅
=
(49)
The distribution coefficients (D) of arsenic and mercury from the extraction by HFSLM,
shown in Table (2), are estimated from Equations (48) and (49). The increase of the
distribution coefficient indicates the enhancement of the extractability. From Table (2), the
distribution coefficients increased with the concentration of Cyanex 471. The maximum
distribution coefficients of arsenic and mercury were attained at 0.06 M Cyanex 471 and 0.07
M Cyanex 471, respectively.
Distribution coefficients
Cyanex 471 (M)
Arsenic Mercury
0.02 0.63 -
0.04 1.13 4.52
0.05 1.32 5.57
0.06 1.47 6.59
0.07 - 8.72
Table 2. The distribution coefficients at Cyanex 471 concentration of 0.02 – 0.07 M mixed
with 0.22 M Aliquat 336 (0.5 M NaOH as the stripping solution)
The distribution coefficients in Equations (48) and (49) were rewritten as follows:
[TIBPS] mlog)]NR[CH(K logD log
33Asex,As
+⋅=
+
(50)
[TIBPS] nlog)]NR[CH(K logD log
2
33Hgex,Hg
+⋅=
+
(51)
The stoichiometric coefficients (m and n) were calculated from the plots of log D
As
and log
D
Hg
against log [TIBPS]. The linear relationships with slopes m = 0.7917 or 4/5 for arsenic
extraction and n = 1 for mercury extraction were observed. The slopes, m and n, were
substituted in the synergistic extraction Equations (43) and (44). The extraction equilibrium
constants of arsenic ions (K
ex,As
) and mercury (K
ex,Hg
) were determined by Equations (46)
and (47). The equilibrium constant of mercury (1,622 (L/mol
3
)) was much higher than that
of arsenic (62.7 (L/mol
9/5
) suggesting that the extraction of mercury was higher than
arsenic, which was in accordance with the results obtained from the study.
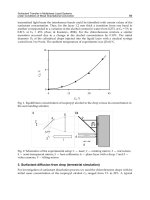
4.3.2 Permeability coefficients
The permeability coefficients of arsenic and mercury, which related to the concentration of
Cyanex 471 from 0.02 – 0.07 M, were obtained from Equations (13) and (14) and the slopes
(AP β/(β+1)) of the plot between -V
f
ln(C
f
/C
f,o
) versus t in Figure (14). From Table (3), it
could be observed that the permeability coefficients increased when the concentration of
Cyanex 471 increased. The permeability coefficients of mercury were higher than those of
arsenic, implying higher mass transfer or higher extraction of mercury ions.
Mass Transfer in Multiphase Systems and its Applications
518
P x 10
3
(cm/s) P x 10
3
(cm/s)
Cyanex 471 (M)
Arsenic Mercury
0.02 5.47 -
0.04 8.90 33.98
0.05 9.81 40.94
0.06 11.54 48.37
0.07 - 53.14
Table 3. The permeability coefficients at Cyanex 471 concentration of 0.02 – 0.07 M mixed
with 0.22 M Aliquat 336
Fig. 14. Plot of –V
f
ln (C
f
/C
f,o
) of arsenic and mercury ions in feed solution against time with
different concentrations of Cyanex 471 mixed with 0.22 M Aliquat 336 for synergistic
organic extractant
4.3.3 Mass transfer coefficients
Equations (52) and (53) were defined assuming the stripping reactions of arsenic and
mercury were instantaneous and no contribution of resistance in the stripping phases.
54
33mAsex,
lm
i
iAs
[TIBPS]]NR[CHkK
1
r
r
k
1
P
1
+
⋅+=
(52)
[TIBPS]]NR[CHkK
1
r
r
k
1
P
1
2
33mHgex,
lm
i
iHg
+
⋅+=
(53)
Mass Transfer in Hollow Fiber Supported Liquid Membrane for
As and Hg Removal
from Produced Water in Upstream Petroleum Operation in the Gulf…
519
where, P
As
and P
Hg
were the permeability coefficients of arsenic and mercury, respectively.
The organic-phase and aqueous-phase mass transfer coefficients (k
m
and k
i
) of arsenic were
determined from the plot of 1/P against 1/([CH
3
R
3
N
+
][TIBPS]
4/5
). The slope and the
ordinate were (r
i
/r
lm
)(1/K
ex
k
m
) and 1/ k
i
. Accordingly, k
m
and k
i
of arsenic were obtained at
1.02x10
-4
and 0.0392 cm/s. Similarly, the values of mercury were obtained at 1.27x10
-5
and
2.210 cm/s from the plot of 1/P against 1/([CH
3
R
3
N
+
]]
2
[TIBPS]). According to the
calculated k
m
and k
i
where the organic-phase mass transfer coefficient was lower than the
aqueous-phase mass transfer coefficient, thus, the mass transfer within membrane was
the rate controlling step of this extraction system.
5. Conclusions
The outstanding feature of HFSLM technique is its ability to treat metal ions of a very low
concentration that are hardly treated or impractical by the conventional techniques.
Therefore, based on the concept of mass transfer we, for example, deployed the HFSLM to
remove low concentrations of arsenic and mercury in the produced water. The result was
successfully achieved by using the HFSLM in conjunction with the selection of the
suitable single or synergistic organic extractant, and the stripping solution. The removal
of mercury contamination was very effective. In many cases, the mercury content could be
reduced to meet the permissible discharge limit to the environment from only single
extraction cycle. The removal of arsenic was found inferior to the mercury. More than one
extraction cycles were required to treat arsenic in the produced water. Of all the potential
organic extractants in the study for arsenic treatment, Aliquat 336 was the best extraction
since it could extract both dissociated and un-dissociated arsenic under a basic or weak
acidic condition.
Synergism extraction was much of interest aiming for the simultaneous removal of arsenic
and mercury. By using the mixture of 0.06 M Cyanex 471 and 0.22 M Aliquat 336, it
promoted the synergistic effect on arsenic extraction. The calculated synergistic coefficient to
arsenic ions was 2.8, implying 2.8 times of arsenic being extracted by the synergistic
extractant more than by the single organic extractant. The 0.1 M thiourea was found to be
the best stripping solution. The arsenic/mercury contaminated in the effluent produced
water complied with the legislation limit after 1-cycle extraction for mercury and 3-cycle
extraction for arsenic. Mass transfer during the whole extraction process starting from feed
phase through the stripping phase was followed the Fick’s law diffusion mass transport.
The parameters describing mass transport were determined, i.e., (1) equilibrium constant
(K
eq
), (2) distribution ratio (D), (3) permeability coefficient (P), (4) mass transfer coefficient
in the feed phase stagnant layer (k
f
) and (5) mass transfer coefficient in the
immobilized liquid membrane (k
m
). In this extraction via HFSLM system for the
simultaneous removal of arsenic and mercury, the rate controlling step was found at the
membrane phase.
6. Acknowledgments
Sincere thanks go to the Thailand Research Fund (TRF), the Office of Small and Medium
Enterprises Promotion (OSMEP) and Chulalongkorn University for granting research funds;
Mass Transfer in Multiphase Systems and its Applications
520
Ratchadaphiseksomphot Endownment Fund (FW012A). Contributions and efforts by the
students to run the experiments are very much appreciated.
7. Notation
A Membrane area (cm
2
)
C Concentration within the membrane (mol / cm
3
)
C
aq
Concentration in the aqueous phase (mol / cm
3
)
C
f
Concentration in the feed phase (mol / cm
3
)
C
f 0
Initial concentration in the feed phase (
mol
/ cm
3
)
C
*
f
Concentration at the feed interface with liquid membrane (mol / cm
3
)
C
m
Concentration in the liquid membrane phase (mol / cm
3
)
C
s
Concentration in the stripping phase (mol / cm
3
)
C
s 0
Initial concentration in the stripping phase (
mol
/ cm
3
)
C
*
s
Concentration at the stripping interface with
the liquid
membrane (mol /
cm
3
)
D Distribution ratio
D
e
Effective diffusivity (cm
2
/s)
D
0
Free bulk diffusion coefficient (cm
2
/s)
HFSLM Hollow Fiber Supported Liquid Membrane
J Flux (mol/cm
2
.s)
j
f
Flux across the feed interface film (mol/cm
2
.s)
j
m1
Flux at feed-liquid membrane interface (mol/cm
2
.s)
j
m2
Flux at liquid membrane-stripping interface (mol/cm
2
.s)
j
r1
Flux following the extraction reaction (mol/cm
2
.s)
j
r2
Flux following the recovery or stripping reaction (mol/cm
2
.s)
j
s
Flux across the stripping interface film (mol/cm
2
.s)
K
e
Equilibrium constant of the interfacial reaction in the feed phase
K
s
Equilibrium constant of the interfacial chemical reaction in stripping phase
K
f
Dimensionless form of mass transfer coefficient in the feed phase
K
s
Dimensionless form of mass transfer coefficient in the stripping
phase
k
1
Forward interfacial reaction rate constant in the feed
phase
(m/s M)
k
-1
Backward interfacial reaction rate constant in the feed
phase
(m/s M)
k
2
Forward interfacial reaction rate constant in the stripping phase (m/s M)
k
-2
Backward interfacial reaction rate constant in the stripping phase (m/s M)
k
f
Mass transfer coefficient in the extraction boundary layer (cm/s)
k
s
Mass transfer coefficient in the stripping boundary layer (cm/s)
L Length of the hollow fiber (cm)
l
if
and l
is
Thickness of feed interface film and stripping interface film (cm)
M
w
Molecular weight (g/mol)
N Numbers of hollow fibers in the module
m, n Stoichiometric coefficient
P Permeability coefficient (cm/s)
Q
f
Volumetric flow rate of feed solution (cm
3
/s)
Mass Transfer in Hollow Fiber Supported Liquid Membrane for
As and Hg Removal
from Produced Water in Upstream Petroleum Operation in the Gulf…
521
R Synergy coefficient
r
i
Internal radius of the hollow fiber (cm)
r
o
External radius of the hollow fiber (cm)
r
lm
Log-mean radius of the hollow fiber
T Absolute temperature (K)
V
A
Molar volume of the target component at its normal boiling temperature
(cm
3
/mol)
V
f
Volume of the feed phase (cm
3
)
V
f 0
Initial volume of the feed phase (cm
3
)
V
m
Volume of the membrane phase (cm
3
)
V
s 0
Initial volume
of the stripping phase (cm
3
)
V
s
Volume of the stripping phase (cm
3
)
x
0
Membrane thickness (cm)
ε Porosity of the hollow fiber (%)
ϕ Association factor of solvent (dimensionless)
μ
Viscosity (cP)
Subscripts
aq Aqueous
f Feed phase
m Membrane phase
org Organic
s Stripping phase
8. References
Arpa, C.; Basyilmaz, E.; Bektas, S.; Genç, O. & Yurum, Y. (2000). Removal of Hg, Cd and Pb
from waste water, In:
J. Fuel Process. Technol., Vol. 68., pp. 111-120
Bringas, E.; San Rom´an, MF.; Irabien, JA. & Ortiz, I. (2009). An overview of the
mathematical modelling of liquid membrane separation processes in hollow fiber
contactors, In:
J. Chem Technol Biotechnol, Vol. 84., pp. 1583–1614
Chakrabarty, K.; Saha, P. & Ghoshal, A.K. (2010). Simultaneous separation of mercury and
lignosulfonate from aqueous solution using supported liquid membrane, In:
J.
Membr
. Sci., Vol. 346 ., pp. 37-44
Dabrowski, A.; Hubicki, Z.; Podkoscielny, P. & Robens, E. (2004). Selective removal of the
heavy metal ions from waters and industrial wastewaters by ion-exchange method,
In:
J. Chemosphere, Vol. 56 ., No. 2., pp. 91-106
Danesi, P.R. (1984). A simplified model for the coupled transport of metal ions through
hollow-fiber supported liquid membranes, In:
J. Membrane Sci., Vol. 20., pp. 231-248
Department of Mineral Fuels (DMF), Ministry of Energy, Thailand. (2010).
/ index.php?act=service&sec=year Production, dated 20-
July-10
Department of Mineral Fuels (DMF), Ministry of Energy, Thailand. (2009).
file/Concess270309.png
Mass Transfer in Multiphase Systems and its Applications
522
Fábrega, F.d.M. & Mansur, M.B. (2007). Liquid-liquid extraction of mercury(II) from
hydrochloric acid solutions by Aliquat 336, In:
J. Hydrometallurgy, Vol. 87., pp. 83-90
Frankiewicz, T.C. & Gerlach, J. (2000). Removal of hydrocarbons, mercury and arsenic from
oil-field produced water, In:
U.S. patent number 6117333
Gallup, D.L. & Strong, J. B. (2007). Removal of Mercury and Arsenic from Produced Water,
Chevron Corporation, pp. 1-9
Huang, D.; Huang, K.; Chen, S. & Liu, S. (2008). Rapid Reaction-Diffusion Model for the
Enantioseparation of Phenylalanine across Hollow Fiber Supported Liquid
Membrane, In:
J. Sep. Sci. and Tech., Vol. 43., pp. 259–272
Iberhan, L. & Wisniewski, M. (2002). Extraction of arsenic(III) and arsenic(V) with Cyanex
925, Cyanex 301 and their mixtures, In:
J. Hydrometallurgy, Vol. 63., pp. 23-30
Korte, N.E. & Feernando, Q. (1991). A review of arsenic(III) in groundwater, In:
Criti. Rev.
Environ. Sci. Technol.
, Vol. 21., pp. 1-39
Lothongkum, A.W.; Khemglad, Y.; Usomboon, N. & Pancharoen, U. (2009). Selective
recovery of nickel ions from wastewater of stainless steel industry via HFSLM, In:
J.
Alloy Compd
., Vol. 476., pp. 940-949
Lothongkum, A.W.; Ramakul, P.; Sasomsub, W.; Laoharochanapan, S. & Pancharoen, U.
(2009). Enhancement of uranium ion flux by consecutive extraction via hollow fiber
supported liquid membrane, In:
J. Taiwan Inst. Chem. Eng., Vol. 40., pp. 518-523
Luo F., Li D. & Wei P. (2004). Synergistic extraction of zinc(II) and cadmium(II) with
mixtures of primary amine N1923 and neutral organophosphorous derivatives, In:
J. Hydrometallurgy, Vol. 73., pp. 31-40
Meera, R., Francis, T. & Reddy, M.L.P. (2001). Studies on the liquid-liquid extraction of
mercury(II) from acidic chloride solutions using Cyanex 923, In:
J. Hydrometallurgy,
Vol. 61., pp. 97-103
Mohapatra, P.K. & Manchanda, V.K. (2008). Liquid Membrane-Based Separations of
Actinides
, In: Handbook of Membrane Separations, ISBN-13: 978-0-8493-9549-9, CRC
Press., Taylor & Francis Group
Pancharoen, U.; Somboonpanya, S.; Chaturabul, S. & Lothongkum, A.W. (2010). Selective
removal of mercury as
HgCl
4
2-
from natural gas well produced water by TOA via
HFSLM, In:
J. Alloys and Compounds, Vol. 489., pp. 72-79
Pancharoen, U.; Poonkum, W. & Lothongkum, A.W. (2009). Treatment of arsenic ions from
produced water through hollow fiber supported liquid membrane, In:
J. Alloys and
Compounds
, Vol. 482., pp. 328-334
Pancharoen, U.; Ramakul, P. & Patthaveekongka, W. (2005). Purely Extraction and
Separation of Mixture of Cerium(IV) and Lanthanum(III) Via Hollow Fiber
Supported Liquid Membrane, In:
J. Ind. Eng. Chem., Vol. 11., No. 6., pp. 926-931
Porter, M.C., (1990).
Handbook of Industrial Technology Membrane, Noyes Publications, ISBN:
0815512058, New Jersey, USA
Prapasawat, T.; Ramakul, P.; Satayaprasert, C.; Pancharoen, U. & Lothongkum, A.W. (2008).
Separation of As(III) and As(V) by hollow fiber supported liquid membrane based
on the mass transfer theory, In:
Korean J. Chemical Engineering, Vol. 25., No. 1., pp.
158-163
Mass Transfer in Hollow Fiber Supported Liquid Membrane for
As and Hg Removal
from Produced Water in Upstream Petroleum Operation in the Gulf…
523
Ramakul, P.; Supajaroon, T.; Prapasawat, T.; Pancharoen, U. & Lothongkum, A.W.
(2009). Synergistic separation of yttrium ions in lanthanide series from rare earths
mixture via hollow fiber supported liquid membrane, In:
J. Chem. Eng., Vol. 15.,
pp.224-228
Ramakul, P.; Prapasawad, T.; Pancharoen, U. & Pattaveekongka, W. (2007). Separation of
radioactive metal ions by hollow fiber supported liquid membrane and
permeability analysis, In:
J. China. Inst. Chem. Engrs., Vol. 38., pp. 489-494
Ramakul, P.; Pattaweekongka, W. & Pancharoen, U. (2006). Mass transfer modeling
of membrane carrier system for extraction of Ce(IV) from sulfate media using
hollow fiber supported liquid membrane, In:
Korean J. Chem. Eng., Vol. 23., No. 1.,
pp. 85-92
Ramakul, P.; Songkun, E.; Pattaweekongka, W.; Hronec, M. & Pancharoen, U. (2006).
Permeation study on the hollow fiber supported liquid membrane for the
extraction of Cobalt(II), In:
Korean J. Chem. Eng., Vol. 23., No. 1., pp. 117-123
Ramakul, P.; Nakararueng, K. & Panchareon, U. (2004). One-through Selective Separation of
Copper, Chromium and Zinc Ions by Hollow Fiber Support Liquid Membrane, In:
Korean J. Chem. Eng., Vol. 21., No. 6., pp. 1212-1217
Ramakul, P. & Panchareon, U. (2003). Synergistic extraction of mixture of lanthanum and
neodymium by hollow fiber supported liquid membrane, In:
Korean J. Chem. Eng.,
Vol. 20., No. 4., pp. 724-730
Rathore, N. S.; Rathore, N.S.; Sonawane, J.V.; Venugopalan, A. K. & Shukla, J.P. (2001).
Hollow fiber supported liquid membrane: a novel technique for separation and
recovery of plutonium from aqueous acidic wastes, In:
J. Membr. Sci., Vol. 189., pp.
119-128
Sangtumrong, S.; Ramakul, P.; Satayaprasert, C.; Pancharoen, U. & Lothongkum,
A.W. (2007). Purely separation of mixture of mercury and arsenic via hollow
fiber supported liquid membrane, In:
J. Ind. and Eng. Chem., Vol. 13., No. 5., pp. 751-
756
Uedee, E.; Ramakul, P.; Pancharoen, U. & Lothongkum, A.W. (2008). Performance of hollow
fiber supported liquid membrane on the extraction of mercury (II) ions, In:
Korean J.
Chem. Eng
., Vol. 25., No. 6., pp. 1486-1494
Usapein, P.; Lothongkum, A.W.; Ramakul, P. & Pancharoen, U. (2009). Efficient transport
and selective extraction of Cr(VI) from waste pickling solution of the stainless steel-
cold rolled plate process using Aliquat 336 via HFSLM, In:
Korean J. Chem. Eng.,
Vol. 26 ., No. 3., pp. 791-798
U.S. Environmental Protection Agency (EPA). (2007). Treatment Technologies for Mercury
in Soil, Waste, and Water, pp. ES-4
U.S. Environmental Protection Agency (EPA). (1984). EPA-600/8-83-021F: Health
Assessment Document for Inorganic Arsenic, pp. 10-28
Van der Vaart, R.; Akkerhuis, J.; Feron, P. & Jansen, B. (2001), Removal of mercury from gas
streams by oxidative membrane gas absorption, In:
J. Membr. Sci., Vol. 187., pp. 151-
157
Mass Transfer in Multiphase Systems and its Applications
524
Wilson, S.D.; Kelly, W.R.; Holm, T.R. & Talbott, J.L. (2007). Arsenic removal in water
treatment facilities: survey of geochemical factors and pilot plant experiments,
Midwest Technology Assistance Center, pp. 10–11
Wisniewski, M. (1997) Extraction of arsenic from sulphuric acid solutions by Cyanex 923, In:
J. Hydrometallurgy
., Vol. 46., pp. 235-241.
23
Mass Transfer in Fluidized
Bed Drying of Moist Particulate
Yassir T. Makkawi
1
and Raffaella Ocone
2
1
Chemical Engineering & Applied Chemistry, Aston University, Birmingham B4 7ET,
2
Chemical Engineering, Heriot-Watt University, Edinburgh EH14 4AS,
UK
1. Introduction
Bubbling fluidized bed technology is one of the most effective means for the interaction
between solid and gas flow, mainly due to its good mixing and high heat and mass transfer
rate. It has been widely used at a commercial scale for drying of grains such as in
pharmaceutical, fertilizers and food industries. When applied to drying of non-porurs moist
solid particles, the water is drawn-off driven by the difference in water concentration
between the solid phase and the fluidizing gas. In most cases, the fluidizing gas or drying
agent is air. Despite of the simplicity of its operation, the design of a bubbling fluidized bed
dryer requires an understanding of the combined complexity in hydrodynamics and the
mass transfer mechanism. On the other hand, reliable mass transfer coefficient equations are
also required to satisfy the growing interest in mathematical modelling and simulation, for
accurate prediction of the process kinetics.
This chapter presents an overview of the various mechanisms contributing to particulate
drying in a bubbling fluidized bed and the mass transfer coefficient corresponding to each
mechanism. In addition, a case study on measuring the overall mass transfer coefficient is
discussed. These measurements are then used for the validation of mass transfer coefficient
correlations and for assessing the various assumptions used in developing these
correlations.
2. Two phase model of fluidization
The first model to describe the essential hydrodynamic features in a bubbling fluidized bed,
usually referred to as the simple two phase model, was proposed in the early fifties of the
last century by Toomey and Johnstone (1952). The model assumes that all the gas in excess
of the minimum fluidization velocity,
m
f
U , passes through the core of the bed in the form of
bubbles. The rest of the gas, usually referred to as emulsion gas, was described to pass
through a dense solid phase surrounding the bubbles, at a low velocity close or equal to
m
f
U . Later experimental investigations on bubbles formation and rise in two and three
dimensional fluidized beds, utilizing conventional photographing and x-ray imaging
techniques, have shown a rather more complicated flow pattern of gas around bubbles. A
more accurate model, describing the movement of gas/solid and pressure distribution
Mass Transfer in Multiphase Systems and its Applications
526
around a rising bubble was then proposed by Davidson and Harrison (1963). This model
describes the gas flow through a three dimensional fluidized bed mainly in a spherical or
semi-spherical shape bubbles through the core, however, depending on the emulsion gas
velocity; the region around the bubble may be surrounded by a cloud as a result of emulsion
gas circulation between the dense solid phase and the core of the bubble. This can be
schematically described as shown in Fig. 1. The existence of a cloud around fast rising
bubbles has been later verified experimentally by a number of researchers. Most recently,
Makkawi and Ocone (2009), utilizing Electrical Capacitance Tomography (ECT) imaging
have further confirmed the existence of cloud around a single isolated bubble rising through
a fluidized bed as shown in Fig. 2. In terms of mass transfer, the existence of cloud and gas
circulation between the bubble and its surrounding have a significant contribution to the
overall mass transfer mechanism in a bubbling fluidized bed dryer as will be discussed
later.
(a) fast rising bubble (b) slow rising bubble
Fig. 1. Proposed gas streamlines in and out of a single rising bubble as described in
3. Mass transfer mechanisms
With the confirmed existence of different phases in a bubbling fluidized bed, it is postulated
that in a bubbling fluidized bed dryers different mechanisms can regulate the mass transfer
process, depending on the bubbles characteristics and the degree of water content in the
bed. The different phases, which all contribute to the removal of moisture from the wet
particles, are the bubble phase, its surrounding cloud and the dense annular solid phase.
The most widely used mass transfer model of Kunii and Levenspiel (1991) expresses the
overall mass transfer in a bubbling bed in terms of the cloud-bubble interchange and dense-
cloud interchange. The cloud-bubble interchange is assumed to arise from the contribution
of circulating gas from the cloud phase and in and out of the bubble, usually referred to as
throughflow, in addition to the diffusion from a thin cloud layer into the bubble. The dense-
cloud interchange is assumed to arise only from diffusion between the dense phase and the
cloud boundary. Kunii and Levenspiel (1991) also suggested additional mass transfer
resulting from particles dispersed in the bubbles, however, recent advanced imaging
technique, have shown bubble free particles in most cases as will be demonstrated later.
Mass Transfer in Fluidized Bed Drying of Moist Particulate
527
For particles of about 500 μm, some researchers assume that the transfer is of a purely
diffusional nature, and thus neglect the contribution of bubble throughflow. However, Walker
[1975] and Sit and Grace [1978] pointed out that, pure diffusional model may significantly
underestimate, the overall mass transfer coefficient. Kunii and Levenspiel (1991) reported
that the true overall mass transfer coefficient may fall closer to either of the acting
mechanisms depending on the operating conditions (particle size, gas velocity, etc.). They
suggested accounting for the first mechanism by summing the diffusional and throughflow,
and adding those to the second mechanism in a similar fashion as for additive resistances.
Fig. 2. Dense-cloud and cloud-bubble phases demonstrated in a typical ECT image of an
isolated rising clouded bubble in a fluidized bed
4. Mass transfer coefficient from literature
Because of the growing interest on modelling as a tool for effective research and design,
researchers on bubbling fluidized bed drying or mass transfer in general are nowadays
seeking to validate or develop new mass transfer coefficient equations required for accurate
prediction of the process kinetics. Recently, different mass transfer coefficients for drying in
fluidized beds have been reported in the literature, most of them are based on the two phase
model of fluidization.
Ciesielczyk and Iwanowski (2006) presented a semi-empirical fluidized bed drying model
based on cloud-bubble interphase mass transfer coefficient. To predict the generalized
drying curve for the solid particles, the interchange coefficient across the cloud-bubble
boundary was given by:
0.5 0.25
1.25
4.5 5.85
mf
cb
b
b
u
g
K
d
d
⎛⎞
⎛⎞
=+
⎜⎟
⎜⎟
⎜⎟
⎜⎟
⎝⎠
⎝⎠
D
(1)
d
b
Mass Transfer in Multiphase Systems and its Applications
528
where the bubble diameter,
b
d , is given by modified Mori and Wen (1975) model for the
bubble diameter as follows:
,
,,0
0.12
exp
mf
bm b
bm b c
H
dd
dd D
⎛⎞
−
=−
⎜⎟
⎜⎟
−
⎝⎠
(2)
where
,bo
d and
,bm
d are the initial bubble diameter at the distributor level and at its
maximum size respectively, and given by:
(
)
2
,
0.376
bo mf
dUU=−
(3)
()
0.4
,
1.636
bm c mf
dDUU
⎡
⎤
=−
⎣
⎦
(4)
According to Davidson and Harrison (1963), the first term in the right side of Eq. 1 is
assumed to represent the convection contribution as a result of bubble throughflow. The
second term arises from the diffusion across a limited thin layer where the mass transfer
takes place. Using area based analysis, Murray (1965) suggested that the first term on the
right side of Eq. 1 to be reduced by a factor of 3, which then gives:
0.5 0.25
1.25
1.5 5.85
mf
cb
b
b
u
g
K
d
d
⎛⎞
⎛⎞
=+
⎜⎟
⎜⎟
⎜⎟
⎜⎟
⎝⎠
⎝⎠
D
(5)
Ciesielczyk and Iwanowski (2006) have shown satisfactory agreement between the above
outlined correlation and experimentally determined drying rate and mass transfer
coefficient for group B particles of Geldart classification.
Kerkhof (2000) discussed some modeling aspect of batch fluidized bed drying during
thermal degradation of life-science products. In this model, it is assumed that the
contribution from particle raining or circulating in and out from a bubble is important,
therefore the cloud-bubble interphase exchange, given by Eq. 1 above, was combined with
the dense-cloud exchange in addition to contribution from the particle internal diffusion to
give an overall bed mass transfer coefficients,
bed
p
bdb
Sh Sh Sh
=
+ (6)
where the first sherwood number,
p
b
Sh , represents the mass transfer added from the
particles dispersed in the bubble and expressed in terms of the mass transfer coefficient for a
single particle, given by,
()
0.5 0.33
20.664Re
pb p
p
kSc
d
=+
D
(7)
The second Sherwood number,
p
b
Sh , represents the combined cloud-bubble and dense-
cloud exchanges and given in terms of a single mass transfer coefficient,
db
k , as follows,
111
db dc cb
kkk
=+ (8)
Mass Transfer in Fluidized Bed Drying of Moist Particulate
529
where the cloud-bubble mass transfer coefficient,
cb
k , was given earlier in Eq. 1 in terms of
interchange coefficient. Note that the interchange coefficient is expressed as a rate constant
(1/s) , which can then be multiplied by the bubble volume per unit area to give the mass
transfer coefficient in (m/s) as follows:
6
b
d
kK=
(9)
The dense-cloud mass transfer coefficient,
dc
k , which appear in Eq. 8 was adopted from
Higbie penetration model, which is expressed in terms of the bubble-cloud exposure time
and the effective diffusivity as follows:
0.5
2
emf
dc
k
t
ε
π
⎛⎞
=
⎜⎟
⎜⎟
⎝⎠
D
(10)
where
c
b
d
t
u
= is the exposure time between the bubble and the cloud. Kerkhof (2000) made
two simplifications to Eq. 10; first, it is assumed that the cloud thickness is negligible,
therefore the bubble diameter can be replacement for the cloud diameter (i.e.
cb
dd≈ ),
second, it is assumed that the effective diffusivity is better approximated by the gas
molecular diffusivity (i.e.
e
≈
DD). Accordingly, Eq. 10 reduces to
0.5
3
6.77
mf b
dc
b
u
k
d
ε
⎛⎞
=
⎜⎟
⎜⎟
⎝⎠
D
(11)
Recently, Scala (2007) experimentally studied the mass transfer around a freely active
particle in a dense fluidized bed of inert particles. The results suggested that the mass
transfer coefficient for a single particle is best correlated by a modified Foressling (1938)
equation for Sherwood number,
0.5 0.33
,
20.7Re
mf p mf
Sh Sc
ε
=+
(12)
where
,
Re
p
m
f
is the Reynolds number expressed in terms of the voidage
m
f
ε
(i.e.
/
m
fp
m
f
ud
ρ
με
= ). The above correlation was found to be independent of the fluidization
velocity or regime change from bubbling to slugging. Accordingly, Scala (2007) concluded
that in a dense bubbling bed the active particle only reside in the dense phase and never
enters the bubble phase, hence it has no direct contribution to the bubble-dense phase
interchanges. This contradicts the observation noted by Kunii and Levenspiel (1991) and
others (e.g. Kerkhof, 2000; Agarwal, 1978), were it is assumed that the contribution of
particles dispersed in the bubble should not be neglected. Agarwal (1978) claimed that the
particles do circulate in and out of the bubble with 20% of the time residing within the
bubble phase.
Clearly, despite of the considerable effort on developing fluidized bed mass transfer
coefficients, there still remain uncertainties with respect to the assumptions used in
developing these coefficients.
Mass Transfer in Multiphase Systems and its Applications
530
5. Characteristic drying rate profiles
Early experimental observations on fluidized beds suggest that the mass transfer at the
single particle level generally occurs at two different drying regimes; one at which the free
moisture, either at the particle surface or within large pours, is rapidly withdrawn at a
constant rate, followed by a slower rate regime at which the process is controlled by slow
diffusion from the fine pores to the particle surface. These are usually referred to as
“constant rate” and “falling rate” respectively. The moisture content at the transition
between these two regimes is called the critical moisture content. Fig. 3 illustrates the
characteristic drying rate curve as function of time and moisture content. There is an
argument that these drying curves are in fact oversimplification of the process, and such
profiles may change considerably with respect to particle size and material type. Keey (1978)
pointed that the drying rate at the beginning of the process may not be constant at all, or at
least changes to a small degree, therefore, he recommended calling this as “initial drying
period” instead of the commonly used term “constant drying”. The same applies to the
“falling rate” regime, where it is preferred to call it “second drying period”. The existence of
the critical moisture content point, on the other hand, is true in most cases.
For non-pours particles, regardless of the material type, the drying process occurs at a single
regime, where the moisture residing at the particle surface is rapidly withdrawn, driven by
difference in moisture concentration. To a great extent, this resembles free water diffusion
into a moving air stream. Fig. 4 shows an example of this behaviour during drying of wet
glass beads in a bubbling fluidized bed using air at ambient conditions.
Here it is clear that the drying rate falls exponentially within the first 15 minutes, after
which the drying process ends. This confirms a single drying regime rapidly driven by the
difference in moisture content between the fluidizing air and particle. Using the data in Fig.
4, one can obtain the water concentration in the fluidized bed as a function of the drying
time by the integration of the drying curve function,
(
)
Ft, such that
()
0
t
to
ww Ftdt=−
∫
(13)
where
o
w
is the initial water content.
Fig. 3. Characteristic drying curves for moist particles
Mass Transfer in Fluidized Bed Drying of Moist Particulate
531
Fig. 4. Drying rate profile for moist glass beads in a bubbling fluidized bed using ambient
air (Makkawi and Ocone, 2009).
6. Case study
Experiments have been carried out with the primary objective to measure the mass transfer
coefficient for a drying process in a conventional bubbling fluidized bed. This required
detailed knowledge of the fluidized bed hydrodynamics and drying rate. For this purpose,
non-porous wet solid particles of glass beads were contained in a vertical column and
fluidized using air at ambient temperature. The fluidising air was virtually dry and obtained
from a high-pressure compressor. An advanced imaging ECT sensor was used to provide
dynamic information on the fluidized bed material distribution. The sensor was connected
to a data acquisition unit and a computer. The air outlet temperature and its relative
humidity were recorded using a temperature/humidity probe. Since the air condition at the
inlet of the fluidization column was constant and completely independent of the bubbling
bed operating conditions, only one probe was installed at the freeboard (air exit). The
detailed experimental set-up is shown in Fig. 5.
6.1 Experimental procedure and materials
The fluidization was carried out in a cast acrylic column, 13.8 cm diameter and 150 cm high.
The column was transparent, thus allowing for direct visual observation. A PVC perforated
gas distributor with a total of 150 holes (~1.8% free area), was placed 24 cm above the
column base. The upstream piping was fitted with pressure regulator, moisture trap, valve
and three parallel rotamaters. A one-step valve was connected before the moisture trap and
was used as the upstream main flow controller. The particles used were ballotini (non-
porous glass beads) with a mean diameter of 125 μm and a density of 2500 kg/m
3
(Geldart
A/B mixture). The detailed physical properties of the particles are given in Table 1. Distilled
water at ambient condition was used to wet the particles. A variable speed granule shaker
was utilised to produce the final wetted mixture.
Mass Transfer in Multiphase Systems and its Applications
532
Fig. 5. Experimental set up (a) Schematic of the fluidized bed (b) A photograph of the
installation
The Electrical Capacitance Tomography imaging system used (ECT from Process
Tomography Limited, Manchester, UK), consisted of two adjacent sensor rings each
containing 8 electrode of 3.8 cm length. All electrodes were connected to the computer
through a data acquisition system. The PC was equipped with custom communication
hardware and software that allow for online and off-line dynamic image display. The
system is capable of taking cross-sectional images of the bed at two adjacent levels
simultaneously at 100 frames per second. Further details about the ECT system used in this
study and its application to fluidization analysis can be found in Makkawi et al. (2006) and
Makkawi and Ocone (2007).
Geldart Group
A/B
Particle size range (μm)
50 - 180
Mean particle diameter (μm)
125
Particle density (kg/m
3
)
2500
Sphericity
≥ 80%
Pores
< 0.02 nm
Material
Pure soda lime glass ballotini.
Chemical composition SiO
2
=72%, Na
2
O=13%, CaO=9%, MgO=4%, Al
2
O
3
=1%, K
2
O
& Fe
2
O
3
=1%
Commercial name
Glass beads – type S, Art. 4500
Electric permittivity
~3.1
Table 1. Physical and chemical properties of the dry particles
Mass Transfer in Fluidized Bed Drying of Moist Particulate
533
The exit air quality was measured using a temperature and humidity probe (Type: Vaisala
HMI 31, Vantaa, Finland, measuring range: 0-100% RH, -40-115 C°). The probe was hung by
a connecting wire inside the fluidized bed freeboard approximately 10 cm above the
maximum expanded bed height.
The experimental procedure employed was completely non-intrusive. The experiment
commenced by weighting a total of 4.5 kg of a dry ballotini mixture and placing it in a
granule shaker after being wetted by distilled water. The shaker was firmly clamped and
operated continuously for at least 25 minutes to ensure an even distribution of water
content. Distilled water was used to eliminate any possible interference with the ECT signal
(ECT works for non-conducting materials only). The wetted particles were then loaded into
the fluidization column. Prior to commencement of drying, the ECT sensor was calibrated
for two extreme cases. This was carried out by sliding the ECT sensor up to the freeboard to
calibrate for the empty bed case, and down to the static bed area to calibrate for the packed
bed case. It should be mentioned that, because the water content was limited to a maximum
of 45 ml (1% moisture on dry solid weight basis), the possible changes in the particle/air
permittivity during the drying process would be negligible. Further details on the sensitivity
of the ECT system to moisture content can be found in Chaplin and Pugsley (2005) and
Chaplin et al., (2006). The wet bed material was fluidized at the required air flow rate. This
was carefully adjusted to ensure the bed operation at the single bubble regime. The
temperature and relative humidity were recorded at 2 minutes intervals. Simultaneously,
and at the 5 minutes intervals, a segment of 60 seconds ECT data were recorded. At the
same time, the expanded bed height during fluidization was obtained from visual
observations. Finally, the drying rate was obtained from the measured air flow rate and
temperature/humidity data at inlet and outlet using psychometric charts and mass balance
calculations. The recorded ECT data were further processed off-line and loaded into in-
house developed MATLAB algorithm to estimate the bubble characteristics.
The above described procedure was repeated for the three different operating conditions
summarized in Table 2. To ensure data reproducibility, each operating condition was
repeated three times, making a total of nine experiment tests.
Experimental unit Operating conditions
Fluidization column Diameter = 13.8 cm, height = 150 cm, material: cast acrylic,
equipped with a
Perforated PVC plate of 150 holes, each of 2 mm dia.
Dry particles
p
d = 125 μm,
p
ρ
= 2500 kg/m
3
, Material: glass
Fluidization fluid Air at ambient condition (~20° C)
Static bed height 20 cm
Exp. 1 Exp. 2 Exp. 3
Fluidization velocity (m/s) 0.35 0.47 0.47
Initial water content (wt%) 1.0 1.0 0.5
Table 2. Summary of experimental operating conditions