Self Organizing Maps Applications and Novel Algorithm Design Part 1 pptx
Bạn đang xem bản rút gọn của tài liệu. Xem và tải ngay bản đầy đủ của tài liệu tại đây (2.07 MB, 40 trang )
SELF ORGANIZING MAPS ͳ
APPLICATIONS AND NOVEL
ALGORITHM DESIGN
Edited by Josphat Igadwa Mwasiagi
Self Organizing Maps - Applications and Novel Algorithm Design
Edited by Josphat Igadwa Mwasiagi
Published by InTech
Janeza Trdine 9, 51000 Rijeka, Croatia
Copyright © 2011 InTech
All chapters are Open Access articles distributed under the Creative Commons
Non Commercial Share Alike Attribution 3.0 license, which permits to copy,
distribute, transmit, and adapt the work in any medium, so long as the original
work is properly cited. After this work has been published by InTech, authors
have the right to republish it, in whole or part, in any publication of which they
are the author, and to make other personal use of the work. Any republication,
referencing or personal use of the work must explicitly identify the original source.
Statements and opinions expressed in the chapters are these of the individual contributors
and not necessarily those of the editors or publisher. No responsibility is accepted
for the accuracy of information contained in the published articles. The publisher
assumes no responsibility for any damage or injury to persons or property arising out
of the use of any materials, instructions, methods or ideas contained in the book.
Publishing Process Manager Jelena Marusic
Technical Editor Teodora Smiljanic
Cover Designer Martina Sirotic
Image Copyright riri, 2010. Used under license from Shutterstock.com
First published January, 2011
Printed in India
A free online edition of this book is available at www.intechopen.com
Additional hard copies can be obtained from
Self Organizing Maps - Applications and Novel Algorithm Design,
Edited by Josphat Igadwa Mwasiagi
p. cm.
ISBN 978-953-307-546-4
free online editions of InTech
Books and Journals can be found at
www.intechopen.com
Chapter 1
Chapter 2
Chapter 3
Part 2
Chapter 4
Chapter 5
Part 3
Chapter 6
Preface XI
Data Interpretation and Management 1
Information-Theoretic Approach to Interpret
Internal Representations of Self-Organizing Maps 3
Ryotaro Kamimura
Privacy-Preserving Clustering on Distributed Databases:
A Review and Some Contributions 33
Flavius L. Gorgônio and José Alfredo F. Costa
A Method for Project Member Role Assignment
in Open Source Software Development
using Self-Organizing Maps 55
Shingo Kawamura, Minoru Uehara, and Hideki Mori
Data Envelopment Analysis 69
Modelling with Self-Organising Maps
and Data Envelopment Analysis:
A Case Study in Educational Evaluation 71
Lidia Angulo Meza, Luiz Biondi Neto, Luana Carneiro Brandão,
Fernando do Valle Silva Andrade, João Carlos Correia Baptista
Soares de Mello and Pedro Henrique Gouvêa Coelho
Self-Organizing Maps Infusion
with Data Envelopment Analysis 89
Mithun J. Sharma and Yu Song Jin
The Study of Multi-media and Web-based Contents 95
A Speech Recognition System for Embedded
Applications Using the SOM and TS-SOM Networks 97
Amauri H. Souza Júnior, Guilherme A. Barreto
and Antonio T. Varela
Contents
Contents
VI
Combining SOMs and Ontologies
for Effective Web Site Mining 109
Dimitris Petrilis and Constantin Halatsis
A Study on Facial Expression Recognition Model
using an Adaptive Learning Capability 125
Masaki Ishii
Self-Organization and Aggregation of Knowledge 143
Koichiro Ishikawa, Yoshihisa Shinozawa and Akito Sakurai
Image Search in a Visual Concept Feature Space with
SOM-Based Clustering and Modified Inverted Indexing 173
Mahmudur Rahman
Mel-Frequency Cepstrum Coefficients
as Higher Order Statistics Representation to Characterize
Speech Signal for Speaker Identification System
in Noisy Environment using Hidden Markov Model 189
Agus Buono, Wisnu Jatmiko and Benyamin Kusumoputro
Improvements in the Transportation Industry 207
Ship’s Hydroacoustics Signatures
Classification Using Neural Networks 209
Andrzej Żak
Dynamic Vehicle Routing Problem
for Medical Emergency Management 233
Jean-Charles Créput, Amir Hajjam,
Abderrafiãa Koukam and Olivier Kuhn
The Study of Meteorological, Geomorphological
and Remotely Acquired Data 251
A Review of Self-Organizing Map Applications
in Meteorology and Oceanography 253
Yonggang Liu and Robert H. Weisberg
Using Self Organising Maps
in Applied Geomorphology 273
Ferentinou Maria, Karymbalis Efthimios,
Charou Eleni and Sakellariou Michael
Land-Cover Classification Using
Self-Organizing Maps Clustered
with Spectral and Spatial Information 299
M. L. Gonçalves, J. A. F. Costa and M. L. A. Netto
Chapter 7
Chapter 8
Chapter 9
Chapter 10
Chapter 11
Part 4
Chapter 12
Chapter 13
Part 5
Chapter 14
Chapter 15
Chapter 16
Contents
VII
Applications of Complex-Valued
Self-Organizing Maps to Ground
Penetrating Radar Imaging Systems 323
Akira Hirose and Yukimasa Nakano
Automated Mapping of Hydrographic Systems
from Satellite Imagery Using Self-Organizing
Maps and Principal Curves 339
Marek B. Zaremba
Application of SOM in Medical and Biological Sciences 355
Computational Approaches as a Tool
to Study Developmental Biology in New World Primates 357
Maria Bernardete Cordeiro de Sousa,
Allan Medeiros, Dijenaide Chaves de Castro,
Adriano de Castro Leão and Adrião Duarte Dória Neto
Clustering Genes, Tissues, Cells
and Bioactive Chemicals by Sphere SOM 371
Yuh Sugii, Takayuki Kudoh, Takayuki Otani,
Masashi Ikeda, Heizo Tokutaka and Masaharu Seno
Application of Self-Organizing Maps in Chemistry.
The Case of Phenyl Cations 387
Daniele Dondi, Armando Buttafava and Angelo Albini
Myoelectric Knee Angle Estimation Algorithms
for Control of Active Transfemoral Leg Prostheses 401
Alberto L. Delis, Joao L. A. Carvalho, Adson F. da Rocha,
Francisco A. O. Nascimento and Geovany A. Borges
A Self Organizing Map Based
Postural Transition Detection System 425
Wattanapong Kurdthongmee
Apparent Age Estimation System
Based on Age Perception 441
Hironobu Fukai, Hironori Takimoto,
Yasue Mitsukura, and Minoru Fukumi
Use of SOM in the Mechanical
and Manufacturing Engineering 453
Parametric and Robust Optimization Study
of a Vibration Absorber with a Generalized Cubic,
Quadratic and Non Integer Nonlinearities
of Damping and Stiffness 455
M.–Lamjed Bouazizi and S. Ghanmi and R. Nasri
Chapter 17
Chapter 18
Part 6
Chapter 19
Chapter 20
Chapter 21
Chapter 22
Chapter 23
Chapter 24
Part 7
Chapter 25
Contents
VIII
Harmonic Potential Fields: An Effective Tool
for Generating a Self-organizing Behavior 493
Ahmad A. Masoud
Kohonen Maps Combined to Fuzzy C-means,
a Two Level Clustering Approach.
Application to Electricity Load Data 541
Khadir M. Tarek and Benabbas Farouk
Fault Localization Upon Non-Supervised Neural Networks
and Unknown Input Observers for Bounded Faults 559
Benítez-Pérez H. and Ortega-Arjona J. L.
Use of SOM to Study Cotton Growing and Spinning 577
Josphat Igadwa Mwasiagi
Design and Application of Novel Variants of SOM 601
Associative Self-Organizing Map 603
Magnus Johnsson, Max Martinsson,
David Gil and Germund Hesslow
Growing Topology Learning Self-Organizing Map 627
Vilson L. Dalle Mole and Aluizio F. R. Araújo
Is it Visible?
Micro-artefacts’ Nonlinear Structure
and Natural Formation Processes 643
Dimitris Kontogiorgos and Alexandros Leontitsis
Self-Organization of Object Categories
in a Cortical Artificial Model 649
Alessio Plebe
Applying SOFM and Its FPGA Implementation
on Event Processing of PET Block Detector 677
Dongming Hu
Forced Accretion and Assimilation
Based on Self-Organizing Neural Network 683
Cheng-Yuan Liou and Wei-Chen Cheng
Chapter 26
Chapter 27
Chapter 28
Chapter 29
Part 8
Chapter 30
Chapter 31
Chapter 32
Chapter 33
Chapter 34
Chapter 35
Pref ac e
The advent of Self Organizing Maps (SOM) provided an opportunity for scientists to
experiment with its ability to solve hitherto complicated problems in all spheres of life.
SOM has found application in practically all fi elds, especially those which tend to han-
dle high dimensional data. SOM can be used for the clustering of genes, in the medical
fi eld, the study of multimedia and web-based content and in the transportation indus-
try, just to name a few. The complex data found in meteorological and remotely sensed
images commonly acquired using satellite sensing can also be analyzed using SOM.
The impact of SOM in the improvement of human life can not be overstated. The wide
application of SOM in many other areas which include data management, data envel-
opment analysis and manufacturing engineering has enabled a thorough study of its
strength and weakness. This has resulted in the design of novel variants of SOM algo-
rithms aimed at addressing some of the weaknesses of SOM.
This book seeks to highlight the application of SOM in varied types of industries. Nov-
el variants of the SOM algorithms will also be discussed.
Dr. Josphat Igadwa Mwasiagi
School of Engineering,
Moi University, Eldoret,
Kenya
Part 1
Data Interpretation and Management
0
Information-Theoretic Approach to Interpret
Internal Representations of Self-Organizing Maps
Ryotaro Kamimura
IT Education Center, 1117 Kitakaname Hiratsuka Kanagawa 259-1292
Japan
1. Introduction
In this chapter, we propose a new method to measure the importance of input variables and
to examine the effect of the input variables on other components. We applied the method
to competitive learning, in particular, self-organizing maps, to demonstrate the performance
of our method. Because our method is based upon our information-theoretic competitive
learning, it is easy to incorporate the idea of the importance of input variables into the
method. In addition, by using the SOM, we demonstrate visually how the importance of
input variables affects the outputs from the other components, such as competitive units.
In this section, we first state that our objective is to interpret the network configurations as
clearly as possible. Then, we show why the importance of input variables should be taken
into account. Finally, we will briefly survey our information-theoretic competitive learning
and its relation to the importance of input variables.
The objective of the new method is to interpret network configurations, focusing upon the
meaning of input variables in particular, because we think that one of the most important
tasks in neural learning is that of interpreting network configurations explicitly (Rumelhart
et al., 1986; Gorman & Sejnowski, 1988). In neural networks’ applications, we have had much
difficulty to explain how neural networks respond to input patterns and produce their outputs
due to the complexity and non-linear nature of data transformation (Mak & Munakata,
2002), namely, the low degree of human comprehensibility (Thrun, 1995; Kahramanli &
Allahverdi, 2009) in neural networks. One of the major approaches for interpretation is
rule extraction from trained neural networks by symbolic interpretations with three types of
methods, namely, decompositional, pedagogical and eclectic (Kahramanli & Allahverdi, 2009). In
the decompositional approach (Towell & Shavlik, 1993; Andrews et al., 1993; Tsukimoto, 2000;
Garcez et al., 2001), we analyze the hidden unit activations and connection weights for better
understanding of network configurations. On the other hand, in the pedagogical approach
(Andrews et al., 1993), the neural network is considered to be a black box, and we only focus
upon the imitation of input-output relations exhibited by the neural networks. Finally, in
the eclectic approach (Andrews et al., 1993; Barakat & Diederich, 2005), both pedagogical
and decompositional approaches are incorporated. In the popular decompositional approach,
much attention has been paid to hidden units as well as connection weights. The importance
of input variables has been implicitly taken into account. For example, Tsukimoto (Tsukimoto,
2000) used the absolute values of connection weights or the squared connection weights to
input variables (attributes) for measuring the importance of input variables. In addition,
1
2 Self Organising Maps, New Achievements
(Garcez et al., 2001) pointed out that the pruning of input vectors maintained the highest
possible precision.
On the other hand, in machine learning, variable selection or the interpretation of input
variables has received much attention. In data processing, the number of input variables
has become extremely large (Guyon & Elisseeff, 2003). Thus, it is important to estimate which
input variable should be taken into account in actual data processing. Variable selection aims
to improve the prediction performance, to reduce the cost in prediction and to understand
the main mechanism of data processing (Guyon & Elisseeff, 2003). The third aim is more
related to the present paper. To cope with this variable selection, many methods have been
developed (Steppe & K. W. Bauer, 1997; Belue & K. W. Bauer, 1995; Petersen et al., 1998) so
far. However, we have had few attempts made in the field of unsupervised learning, for
example, competitive learning and SOM, to take into account the effect of input variables.
The methods for input variables in neural networks are mainly related to supervised learning,
because of the easy implementation of the measures to represent the importance of input
variables (Guyon & Elisseeff, 2003). Few attempts have been made to apply variable selection
to unsupervised learning. Thus, it is necessary to examine the effect of input variables through
the visualization abilities of the SOM.
In unsupervised learning, explicit evaluation functions have not been established for variable
selection (Guyon & Elisseeff, 2003). We have introduced variable selection in unsupervised
competitive learning by introducing a method of information loss (Kamimura, 2007; 2008b;a)
or information enhancement (Kamimura, 2008c; 2009). In the information loss method, a
specific input unit or variable is temporarily deleted, and the change in mutual information
between competitive units and input patterns is measured. If the difference between mutual
information with and without the input unit is increased, the target input unit certainly plays
a very important role. On the other hand, in information enhancement, a specific input unit
is used to enhance competitive units or to increase the selectivity of competitive units. If the
selectivity measured by mutual information between competitive units and input patterns is
large, the target input unit is important to increase the selectivity.
One of the major difficulties with these information-theoretic methods is that it is extremely
difficult to determine how much information should be contained in explicit ways. In those
methods, there are some parameters to determine how much information should be acquired.
However, there are no ways to adjust the parameters and to determine the appropriate amount
of information to be acquired. We must adjust the parameters heuristically by examining final
results such as competitive unit output and connection weights. In this context, we propose a
new method to measure information content to be stored in input variables. The parameters
in the methods are changed to increase this information content as much as possible. The basic
principle to determine the parameters is how these parameters can maximize the information
of the input variables. Compared with the previous methods, the criterion to determine the
parameters is more explicit. With the ability to explicitly determine the information content,
we can interpret network configurations with more confidence, because our method presents
a network configuration with maximum possible information state.
Our method has been developed based on information-theoretic competitive learning. Thus,
our method is the most suited for competitive learning. However, we applied the method
to the self-organizing maps, for two reasons. First, the self-organizing map is a convenient
tool to visualize the good performance of our method, better than pure competitive learning
because the good performance can be intuitively understood by visualization techniques
related to the SOM. Second, we think that the self-organizing map is also an attempt to
4
Self Organizing Maps - Applications and Novel Algorithm Design
Information-Theoretic Approach to Interpret
Internal Representations of Self-Organizing Maps
3
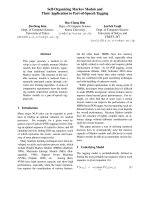
Fig. 1. A concept of the information-theoretic approach.
interpret network configurations not by symbolic but by visual representation. Though
the SOM has been developed for clustering and data mining of high-dimensional data
(Kohonen, 1988; 1995; Tasdemir & Merenyi, 2009), the SOM’s main contribution consists in
the visualization of high dimensional data in terms of the lower dimensions with various
visualization techniques. In the SOM, different final configurations are made explicit by
using various visualization techniques, taking into account codebooks and data distribution
(Polzlbauer et al., 2006; Vesanto, 1999; Kaski et al., 1998; Mao & Jain, 1995; Ultsch & Siemon,
1990; Ultsch, 2003). From our point of view, the approach of visual representations to interpret
network configurations corresponds conceptually to the decompositional approach in rule
extraction, though symbolic representations are not extracted. We think that visualization
is an effective tool for interpreting final configurations, corresponding to the extraction of
symbolic rules in rule extraction.
2. Theory and computational methods
2.1 Information-theoretic approach
We aim to apply our information-theoretic principle to the detection of the importance of input
variables. Principally, our objective is to maximize any information contained in components
in a network, hoping that condensed information contained in the components is simpler
and more interpretable than that before information maximization. In our sense, information
maximization means strictly that information on input patterns is represented in a small
number of components, such as competitive units and input units. Figure 1 shows a schematic
diagram of our objective. In the figure, from the initial to the final state, the number of
important units represented in black is smaller. First, information contained in competitive
units must be as large as possible, as shown in Figure 1(b1). We have already shown that
this information on competitive units, more exactly, mutual information between competitive
units and input patterns, represents competitive processes (Kamimura & Kamimura, 2000;
Kamimura et al., 2001; Kamimura, 2003a;b;c;d). Thus, this information, or more exactly,
mutual information, should be as large as possible. On the other hand, we can consider
5
Information-Theoretic Approach to Interpret Internal Representations of Self-Organizing Maps
4 Self Organising Maps, New Achievements
Fig. 2. Competitive unit outputs for an initial state (a), an intermediate state (b) and a state
with maximum mutual information (c). The black and white competitive units represent the
strong and weak firing rates, respectively.
information content in input units. As shown in Figure 1(b2), this information should be
increased as much as possible. When this information is increased, the number of important
input variables is decreased. We focus here on input units, or variables, and then information
maximization should be biased toward information contained in input units. Thus, mutual
information in competitive units should be increased under the condition that the increase in
the mutual information prevents a network from increasing information in input units. In the
following section, we first explain mutual information between competitive units and input
patterns. Then, using the mutual information, we define the importance of input units, by
which the information of input variables is defined. Finally, we explain how to compromise
these two types of information.
Fig. 3. Competitive unit outputs for conditional entropy minimization (a) and mutual
information maximization (b). The black and white competitive units represent the strong
and weak firing rates, respectively.
6
Self Organizing Maps - Applications and Novel Algorithm Design
Information-Theoretic Approach to Interpret
Internal Representations of Self-Organizing Maps
5
2.2 Information-theoretic competitive learning
We begin with information for competitive units, because information of input units is
defined based upon the information for competitive units. We have so far demonstrated
that competitive processes in competitive learning can be described by using the mutual
information between competitive units and input patterns(Kamimura & Kamimura, 2000;
Kamimura et al., 2001; Kamimura, 2003a;b;c;d). In other words, the degree of organization
of competitive units can be described by using mutual information between competitive units
and input patterns. Figures 2 (a), (b) and (c) show three states that depend on the amount of
information stored in competitive unit outputs. Figure 2(a) shows an initial state without any
information on input patterns, where competitive unit outputs respond equally to all input
patterns. When some quantity of information is stored in competitive unit outputs, several
neurons tend to fire at the corners, shown in Figure 2(b). When mutual information between
input patterns and competitive units is maximized, shown in Figure 2(c), only one competitive
unit is turned on for specific input patterns.
We explain this mutual information more exactly by using the network architecture shown
in Figure 1. In the network, x
s
k
, w
jk
and v
s
j
represent the kth element of the sth input pattern,
connection weights from the kth input to the jth competitive unit and the jth competitive unit
output for the sth input pattern. The competitive unit outputs can be normalized as p
(j | s) to
represent the firing probability of the jth competitive unit. In the network, we have L input
units, M competitive units and S input patterns.
First, the jth competitive unit outputs v
s
j
for the sth input pattern can be computed by
v
s
j
= exp
−
∑
L
k
=1
p(k)(x
s
k
− w
jk
)
2
2σ
2
. (1)
The firing probability of the jth competitive unit for the sth input pattern can be obtained by
normalizing these competitive unit outputs
p
(j | s)=
v
s
j
∑
M
m
=1
v
s
m
. (2)
Then, mutual information between competitive units and input patterns can be defined by
MI
=
S
∑
s=1
M
∑
j=1
p(s)p(j | s) log
p
(j | s)
p(j)
= −
M
∑
j=1
p(j)log p(j)+
S
∑
s=1
M
∑
j=1
p(s)p(j | s) log p(j | s). (3)
Mutual information is decomposed into the first term of entropy and the second term of
conditional entropy. As shown in Figure 3(a), when only conditional entropy is minimized,
we have the high possibility that only one competitive unit at the corner in the figure is always
turned on. On the other hand, when mutual information is maximized, different competitive
units respond to different input patterns, as shown in Figure 2(b). Thus, mutual information
maximization can realize a process of competition in competitive learning.
7
Information-Theoretic Approach to Interpret Internal Representations of Self-Organizing Maps
6 Self Organising Maps, New Achievements
ε
ε
ε
Fig. 4. Importance p(k) with large (a), small and estimated importance (c).
Fig. 5. Importance p(k) with large (a), small and estimated importance (c).
8
Self Organizing Maps - Applications and Novel Algorithm Design
Information-Theoretic Approach to Interpret
Internal Representations of Self-Organizing Maps
7
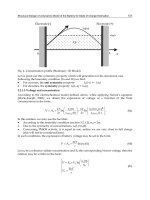
Fig. 6. Mutual information as a function of the parameter σ.
2.3 Estimated information for input variables
Using the mutual information described in the previous section, we try to estimate the
importance of input variables. For this purpose, we initially suppose the importance of input
units by using the parameter
p
(k;t,)=
,ifk
= t;
(1 − )/(L − 1), otherwise,
where is a parameter to determine the degree of attention paid to the kth input unit. As the
parameter is increased, more attention is paid to the kth target input unit or variable. Figure
4(a) shows a case where the parameter is the largest value, one, for the second input unit, and
the importance of the second input unit is the largest. However, no explicit patterns in terms
of competitive unit outputs can be seen. On the other hand, in Figure 4(b), the parameter
is small, the intensity of the second competitive unit is weakened and the other competitive
units fires slightly. However, competitive unit outputs are slightly organized. Thus, in this
case, the small parameter value of is better to organize competitive units. Then, the actual
importance shown in Figure 4(c) can be modeled by using this small parameter value. Figure 5
shows a case where the first input unit produces no effect on competitive unit output patterns
(a), while the second unit produces an organized competitive unit output pattern (b). Thus,
the second input unit of the estimated ones is large (c).
To estimate the information, we must introduce the mutual information between competitive
units and input patterns. Now, the distance between input patterns and connection weights,
when focusing upon the tth input unit, is computed by
d
s
j
(t,)=
L
∑
k=1
p(k; t, )( x
s
k
− w
jk
)
2
. (4)
By using this equation, we have competitive unit outputs for the tth input unit
v
s
j
(t;σ,)=exp
−
∑
L
k
=1
p(k; t, )( x
s
k
− w
jk
)
2
2σ
2
. (5)
9
Information-Theoretic Approach to Interpret Internal Representations of Self-Organizing Maps
8 Self Organising Maps, New Achievements
Normalizing these outputs, we have
p
(j | s;t,σ,)=
v
s
j
(t;σ,)
∑
M
m
=1
v
s
m
(t;σ,)
. (6)
The firing probability of the jth competitive unit is defined by
p
(j;t,σ,)=
S
∑
s=1
p(s)p(j | s;t,σ,). (7)
By using these probabilities, we have mutual information MI when the tth input unit is
focused on:
MI
(t;σ,)=
S
∑
s=1
M
∑
j=1
p(s)p(j | s;t,σ,)log
p
(j | s;t,σ,)
p(j;t,σ,)
. (8)
This mutual information shows how well the tth input unit contributes to a process of
competition among competitive units (Kamimura, 2003b).
2.4 Importance of input variables
Mutual information MI(t; σ, ) represents how well the tth input variable contributes to the
process of competition. As this mutual information gets larger, the tth input variable plays a
more essential role in realizing competitive processes, and the variable should be considered
to be important in competition. We approximate the importance of input units with this
mutual information, and we have
q
(t;σ,) ≈
MI(t; σ, )
∑
L
l
=1
MI(l; σ, )
. (9)
Then, using the importance, q
(t;σ,), the estimated information can be defined by
EI
(σ,)=
L
∑
k=1
q(k; σ, ) log
q
(k;σ,)
q
0
(k;σ,)
. (10)
In this equation, q
0
is supposed to be equi-probable, namely, 1/L. As this estimated
information gets larger, the number of important input variables gets smaller. Thus, we must
increase this estimated information as much as possible, because we are trying to find a small
number of important input variables.
2.5 Ratio to determine the parameters
This estimated information EI is based upon mutual information between competitive units
and input patterns. Then, mutual information is dependent on the spread parameter σ and ,
and in particular, the mutual information is changed by the spread parameter σ. Generally,
mutual information can be increased by decreasing the spread parameter σ. Thus, for the
parameter σ, the parameter should be as small as possible, meaning that mutual information
is as large as possible. Mutual information between competitive units and input patterns
represents the degree of organization of a network; as the parameter σ gets smaller, the
corresponding mutual information gets larger. This means that, when the parameter σ is
small, the organization of a network is large. In addition, the importance of input variables
10
Self Organizing Maps - Applications and Novel Algorithm Design
Information-Theoretic Approach to Interpret
Internal Representations of Self-Organizing Maps
9
must be increased as much as possible. Thus, we introduce the ratio RE of the estimated
information to the parameter σ
RE
(σ,)=
EI(σ,)
σ
. (11)
We try to increase this ratio as much as possible by changing the parameter σ and . This
ratio means that we must increase the estimated information as much as possible. In addition,
the mutual information between competitive units and input patterns must be as large as
possible, which is realized by the property that, when the parameter σ is smaller, the mutual
information is larger.
2.6 Self-organizing maps
Finally, we should note the conventional self-organizing maps (SOM) used in this chapter.
Principally, the SOM is a method to increase mutual information that takes into account
interaction among competitive units. The reason why we use the SOM as a basic learning
method is that we have some difficulty in implementing lateral interactions in competitive
output units from information-theoretic points of view
1
. In the SOM, at each training step,
the data set is partitioned according to the Voronoi regions of map vectors. First, we must
select the best matching unit (BMU), denoted by c:
c
= argmin
j
L
∑
k=1
(x
s
k
− w
jk
)
2
. (12)
This selection of the BMU corresponds to a case where mutual information between
competitive units and input patterns is maximized. Then, we must compute a neighborhood
kernel, h, around the winning unit c.
h
jc
= exp
−
r
c
− r
j
2
2σ
2
, (13)
where r
c
and r
j
denote vectors representing the position of the winner and jth competitive
unit, respectively, and σ is a neighborhood radius. Connection weights w
jk
are computed by
w
jk
=
∑
S
s
=1
h
jc
x
s
k
∑
S
s
=1
h
jc
. (14)
We can say that the SOM is also one of the methods that increases mutual information between
competitive units and input patterns.
3. Results and discussion
3.1 Experimental results
3.1.1 Symmetry data
We first applied the method to symmetric data in which input patterns are symmetric, as
shown in Figure 7(a). Therefore, the method must detect this symmetric property at least.
Figure 7(b) and (c) show a U-matrix and labels obtained by the conventional SOM. As can be
seen in the figure, in the middle of the U-matrix, clear boundaries in warmer colors can be
1
We will discuss this problem in the discussion section.
11
Information-Theoretic Approach to Interpret Internal Representations of Self-Organizing Maps
10 Self Organising Maps, New Achievements
Fig. 7. Original data x
s
k
(a), U-matrix (b) and labels (c) for the symmetric data obtained by the
SOM.
(1)
(2)
(3)
(4)
(5)
(6)
(7) (8)
Fig. 8. Component planes along eight input variables obtained by the SOM for the symmetric
data.
detected. We can see from the labels in Figure 7(c) that input patterns are naturally classified
into two classes. Figure 8 shows component planes along six input units. As component
planes move from the first input unit to fourth input unit, they show a gradual increase in the
number of strong connection weights (in warmer colors) on the upper part of the map. On
the other hand, component planes move from the fifth input unit to the eighth input unit, and
then they show a gradual increase in the number of strong connection weights on the lower
part of the map. This means that the importance of component planes becomes larger as the
component planes move to the center. This property of component planes explains well the
symmetric property of the original data.
Figure 9(a) shows estimated information EI
(σ,) as a function of the spread parameter σ for
six different values of the parameter . The computational procedure is as follows. First,
the parameter is chosen; for example, is 0.2. Then, we try to increase the estimated
information EI as much as possible. As shown in Figure 9(a), when the parameter is set
to 0.2, then the other parameter σ is increased up to 1.1, where the estimated information
reaches its steady state. Beyond this point, the estimated information cannot be increased.
Learning is considered to be finished when the difference in estimated information between
the present and the previous state is less than 0.001. We can see that, when the parameter
is larger, the estimated information is larger. In other words, when we focus upon a specific
input variable more intensely, the estimated information becomes larger. In addition, we can
see that, when the estimated information is larger, the other parameter σ is also increased.
To see the situation more exactly, we plot the relations between the two parameters, σ and .
Figure 9(b) shows the final estimated information, with the final value of the parameter σ as
a function of the parameter . The estimated information is increased and reaches its steady
state as the parameter is increased. Figure 9(c) shows the values of the parameter σ as a
12
Self Organizing Maps - Applications and Novel Algorithm Design
Information-Theoretic Approach to Interpret
Internal Representations of Self-Organizing Maps
11
Fig. 9. Information as a function of the parameter σ (a) and the parameter (b). Optimal
values of the parameter σ as a function of the parameter (c). The ratio RE as a function of
the parameter .
function of the other parameter . The parameter σ is increased constantly as the parameter
is increased. As mentioned above, for the mutual information between competitive units
and input patterns to be increased, the parameter σ should be as small as possible. Therefore,
we have introduced the ratio RE. This ratio is gradually increased, and it reaches its peak
when the parameter is 0.5. Thus, this value of 0.5 produced the optimal information, where
the estimated information is sufficiently high, and in addition, mutual information between
competitive units and input patterns is not so small, because the parameter σ is relative small.
Figure 10 shows the estimated importance q
(k) for four different values of the parameter .
Figure 10(a) shows the importance when the parameter is 0.1. The estimated importance
is flat, and little difference can be seen. As the parameter is increased from 0.2 (b) to 0.3 (c),
gradually, the importance of different input units is made clearer. Finally, when the parameter
is 0.5 (d, optimal), the range of the importance is the largest, and we can easily see the
symmetric property of the data. As the input variable moves to the center, the importance of
input variable naturally increases. These results demonstrate that the ratio of the estimated
information to the parameter σ shows the most interpretable importance of input variables.
In addition, we plot the estimated firing probability p
(j) with the optimal values of the
parameters in Figure 10(e) and (f). As the probability p
(j) increases, the corresponding
13
Information-Theoretic Approach to Interpret Internal Representations of Self-Organizing Maps