From Turbine to Wind Farms Technical Requirements and Spin-Off Products Part 3 doc
Bạn đang xem bản rút gọn của tài liệu. Xem và tải ngay bản đầy đủ của tài liệu tại đây (740.67 KB, 20 trang )
Wind Farms and Grid Codes
29
Category Operating point Dip type
1 Partial load Three phase
2 Full load Three phase
3 Partial load Isolated two phase
4 Full load Isolated two phase
Table 3. Test categories.
Fig. 15 and Fig. 16 show the measured voltages during a three-phase and a two-phase
voltage dip respectively.
Fig. 15. Three-phase voltage dip: Depth 100%; Duration 510 ms.
Fig. 16. Two-phase voltage dip: Depth 50%; Duration 150 ms.
To guarantee the continuity of supply, the wind turbine will be undergone to three
consecutive tests. If the wind turbine disconnects during this test sequence, four consecutive
tests will be performed. If in this new sequence, the wind turbine disconnects, the test will
be considered invalid.
To verify wind systems by applying the Particular Verification Process, the power and
energy registered must fulfill the requirements shown in Table 4 and Table 5.
Three phase faults OP 12.3 requirements
ZONE A
Net consumption Q < 15% Pn (20 ms) -0.15 p.u.
ZONE B
Net consumption P < 10% Pn (20 ms) -0.1 p.u.
Net consumption Q < 5% Pn (20 ms) -0.05 p.u.
Average I
r
/I
tot
0.9 p.u.
Extended ZONE C
Net consumption I
r
< 1.5 I
n
(20 ms) -1.5 p.u.
Table 4. Power and energy requirements for three phase voltage dips in the Particular
Verification Process.
From Turbine to Wind Farms - Technical Requirements and Spin-Off Products
30
Two phase faults OP 12.3 requirements
ZONE B
Net consumption E
r
< 40% Pn * 100 ms
-40 ms
.
p.u.
Net consumption Q < 40% Pn (20 ms) -0.4 p.u.
Net consumption E
a
< 45% Pn * 100 ms
-45
.
ms p.u.
Net consumption P < 30% Pn (20 ms) -0.3 p.u.
Table 5. Power and energy requirements for isolated two phase voltage dips in the
Particular Verification Process.
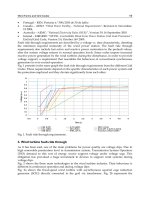
Where the zones A, B and C are defined in Fig. 17.
Fig. 17. Classification of the voltage dip in the field test.
5.2.2 Wind turbine test according to the German FGW-TG3
The on-site test should serve the following objectives:
• Validation of the system
• Test the control system and the auxiliary units
For both cases, the wind turbine should be tested for the following operation points:
Registered Active Power
Partial load 10% - 30% Prated
Full load > 90% Prated
Table 6. Operation points prior to test.
In this case, the voltage dip generator must have an X/R ratio of at least 3, and the
symmetrical fault level on the transformer’s high voltage side must be at least 3·Prated.
Dip treshold
Wind Farms and Grid Codes
31
The voltage dip generator must be configured in no-load test to obtain the three phase and
two phase voltage dips with the different depths shown in Table 7 for directly synchronous
generators and Table 8 for the other types, as in the procedure for test according to the
Spanish PVVC. Therefore, in the system shown in the Fig. 14, the series inductances (4), the
transformer taps (7) and the impedances (11) adjusted with the switch (2) open.
Test
number
Ratio of fault voltage
to initial voltage (U/U0)
Fault duration
(ms)
1 0.05 150
2 0.20-0.25 150
3 0.45-0.55 150
4 0.70-0.80 700
Table 7. Voltage drop test for directly coupled synchronous generators.
Test
number
Ratio of fault voltage
to initial voltage (U/U0)
Fault duration
(ms)
1 0.05 150
2 0.20-0.25 550
3 0.45-0.55 950
4 0.70-0.80 1400
Table 8. Voltage drop test for all the other types of generators.
For three phase voltage dips in accordance with test 3 and 4, minimum proportionality
constant (K-factor) is two. This factor is defined in (SDLWindV, 2009) by:
ΔΔ
=⋅
Br
NN
IU
K
IU
(1)
Where
I
B
is the reactive current,
Δ
B
I is the reactive current deviation and
Δ
r
U is the relevant
voltage deviation and is calculated as:
Δ
=Δ +
rt
UUU (2)
Where ΔU is the voltage deviation and
t
U
the dead band, that must be kept at a constant
maximum of 10%
U
N
during each test.
6. Model validation
The Spanish PVVC and the German FGW-TG4 (FGW, 2009) give the procedures to validate
wind turbine systems by comparing the results obtained by simulation and that obtained
from on-site test. PVVC and FGW-TG4 gives the maximum deviation and the specific time
intervals for the comparison of the results. The Spanish PVVC establishes a time window of
1 s with 100 ms before the voltage dip, and the German FGW-TG4, 500 ms before the voltage
dip and 2 s after the voltage recovery. Fig. 18 shows the different time windows established
in each document. It is important to point out that the time window from the PVVC is fixed
and does not depend on the voltage dip duration whereas the FGW-TG4 depends on it.
From Turbine to Wind Farms - Technical Requirements and Spin-Off Products
32
0.0
0.2
0.4
0.6
0.8
1.0
1.2
0.0 0.5 1.0 1.5 2.0 2.5 3.0 3.5 4.0 4.5
Time (s)
u (p.u.)
Fig. 18. Time window established in the German FGW-TG4 and the Spanish PVVC.
Respect the maximum deviation, in the Spanish PVVC it is constant and equal to 10% in the
time frame, and the German FGW-TG4 establishes these values:
Deviation
F1
Deviation F2
Deviation
F3
Total Deviation
FG
Active Power ΔP/Pn,
Reactive Power ΔQ/Pn
0.07 0.20 0.10 0.15
Reactive current ΔIb/Ir 0.10 0.20 0.15 0.15
Table 9. Maximum deviation in different stages of voltage dip.
Where F1 is the deviation of the mean of steady state areas, F2 the deviation of the mean of
transient areas, F3 the highest deviation in steady state areas and FG the mean of weighted
deviations for P, Q and Ib.
Next the validation process followed for a wind turbine generator from in-field testing
results according to the Spanish PVVC.
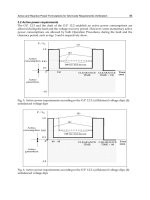
6.1 Voltage dip generator model
In PVVC the system shown in Fig. 19 is proposed. In this system, the voltage measured in
the field test is introduced in the simulation and reproduced by a voltage source. Thus, the
wind turbine model is subjected to the same voltage than the wind turbine during the field
test and only the active and reactive power must be compared to validate the model.
Fig. 19. Voltage dip generator representation in validation simulation.
U
dip
I
WTG
G
FGW TG4
time window
PVVC time
window
Wind Farms and Grid Codes
33
6.2 Methodology for calculating power
The PVVC explains the following method to calculating power from the test and simulation
results.
Using the N samples of the instantaneous values of phase voltage (u(n)) and the phase
current (i(n)) the fundamental harmonic can be obtained using the following expressions:
()
1
2
1
0
2
N
n
j
N
n
Uune
N
π
−
⎛⎞
−
⎜⎟
⎝⎠
=
=⋅ ⋅
∑
(5)
()
1
2
1
0
2
N
n
j
N
n
Iine
N
π
−
⎛⎞
−
⎜⎟
⎝⎠
=
=⋅ ⋅
∑
(6)
To calculate the active and reactive power, only the positive sequence component of the
voltage and current are used:
22
33
11 1
1
3
jj
AB C
UUUeUe
ππ
+−
+
⎛⎞
=+⋅+⋅
⎜⎟
⎝⎠
(7)
22
33
11 1
1
3
jj
AB C
IIIeIe
ππ
+−
+
⎛⎞
=+⋅+⋅
⎜⎟
⎝⎠
(8)
The three-phase active and reactive power expressions are obtained from the positive
sequence component of the voltage and current as:
(
)
3cosPUI
ϕ
++
=⋅ ⋅ ⋅
(9)
(
)
3Q U I sen
ϕ
++
=⋅ ⋅ ⋅
(10)
6.3 Model validation
This section describes the model validation process followed for the developed model. Only
the three-phase voltage dip for the full load category is shown, the process for the rest of the
categories would be the same.
The next figure shows the voltage evolution during the field test and the simulation in phase
A. In the simulation, the voltage is introduced by means of a voltage source that reproduces
the voltage during the field test. Therefore, there are no significant differences between test
and simulation. Voltage in phase B and C are similar to voltage in phase A. In the figure, the
blue line represents the voltage obtained during the field test; the red line has been obtained
by simulation and the green line the maximum deviation considered in the Spanish PVVC
(10%).
Table 10 shows that the model is validated in this category (full load, three phase voltage
dip) because the number of the samples with error less than the maximum allowable error
for the active and the reactive power are greater than 85%. Fig. 21 shows the comparison of
the active power results and Fig. 22 the comparison of the reactive power results. In both
figures, the blue line represents the results obtained during the field test; the red line has
been obtained by simulation and the green line the maximum deviation considered (10%).
From Turbine to Wind Farms - Technical Requirements and Spin-Off Products
34
Fig. 20. Voltage evolution during the field test and the simulation in phase A.
Fig. 21. Comparison of the active power during field test and simulation.
Fig. 22. Comparison of the reactive power during field test and simulation.
Wind Farms and Grid Codes
35
¿Is the model validated? Yes
P samples with error < 0.1 p.u. 97.50
Q samples with error < 0.1 p.u. 100.00
Table 10. Validation results for the example.
7. Wind farm verification
As it has been shown in section 4.1, if the General Verification Process of the PVVC is
followed, a simulation study must be performed. The simulation tool used to verify wind
installation according to PVVC must permit to model the electrical system components per
phase, because balanced and unbalanced perturbances must be analyzed.
The simulated model to verify the installation must take into account the different
components of the real system, that is: the wind farm, FACTS and reactive compensating
systems, the step-up transformer, the connection line and a equivalent network defined in
PVVC. Fig. 23 shows the one line diagram of the network to be simulated.
Fig. 23. One line diagram of the wind installation network.
The PVVC establishes the external network model equivalent. This equivalent network
reproduces the typical voltage dip profile in the Spanish electrical system, that is a sudden
increase in the moment of the clearance and a slower recovery afterwards. The profile for
three phase voltage dips is shown in Fig. 24.
Fig. 24. Voltage profile in the point of connection during the fault and the recovery.
PCCHV
MV
LV
G
FAULT
EQUIVALENT
NETWORK
WIND FARM
FACTS
From Turbine to Wind Farms - Technical Requirements and Spin-Off Products
36
7.1 Wind farm modeling
Wind farm models may be built with different detail levels ranging from one-to-one
modeling or by an aggregated model that consists of one or few equivalent wind turbines
and an equivalent of the internal network. The aggregated model includes: wind turbine
units, compensating capacitors, step-up transformers, etc. Fig. 25 compares the detailed and
the aggregated models.
The aggregated model can be used to verify a wind installation according to PVVC when all
the wind turbines that form the wind installation are of the same type. If a wind installation
is formed by different wind turbines, aggregated model can be done grouping the wind
turbines of the same type.
Fig. 25. Wind farm modeling.
Considering identical machines the equivalent generator rating is obtained adding all the
machine ratings (García-Gracia et al, 2008):
1
n
e
q
i
i
SS
=
=
∑
1
n
e
q
i
i
PP
=
=
∑
(11)
where S
i
is the i-th generator apparent power and P
i
is the i-th real power.
The inertia H
eq
and the stiffness coefficient K
eq
of the equivalent generator are calculated as
follows:
1
n
e
q
i
i
HH
=
=
∑
1
n
e
q
i
i
KK
=
=
∑
(12)
and the size of the equivalent compensating capacitors is given by:
1
n
e
q
i
i
CC
=
=
∑
(13)
When the aggregated model is used, the difference between the results obtained by the two
models must be negligible. Fig. 26 and Fig. 27 show the results obtained in a example wind
farm. Fig. 26 shows a comparison between the real power obtained by the simulation of a
Circuit n
a) Detailed model
PCC
Transformer
HV/MV
Equivalent
MV/LV
transformer
Equivalent
generator
Equivalent
circuit
b) Aggregated model
PCC
Transformer
HV/MV
Circuit 1
Wind Farms and Grid Codes
37
detalied and aggregated model. The blue line represents the results of the detailed model,
the red line the results of the aggregated model and the green line shows the tolerance
(10%). Fig. 27 shows the same comparison for the reactive power. In this case the aggregated
model can be used because the differences are negligible during the simulation.
Fig. 26. Real power in the detailed (blue) and the aggregated (red) model.
Fig. 27. Reactive power in the detailed (blue) and the aggregated (red) model.
7.2 Modeling wind turbine when there is no available data
Usually, when old installations are going to be verified according to PVVC, there are no
available data to model the installation. In these cases, if the rms voltage during the
simulation remains above 0.85 p.u., the wind turbines can be represented by a library model
that takes into account the generator protections that would disconnect the installation.
If the requirements to use library models are not fulfilled, that is, the voltage falls bellow
0.85 p.u. during the simulation, validated models of the dynamic parts of the wind
installation (wind turbines and FACTS) must be provided by the manufacturers. The model
validation must be done according PVVC (see section 6).
7.2.1 Characteristics of the wind turbine library
Depending on the wind turbine technology, different models must be used.
For squirrel cage induction generator, a fifth order model must be used. If there are
manufacturer data available, the behaviour in rated conditions must be checked with a
tolerance of 10% for real and reactive power.
From Turbine to Wind Farms - Technical Requirements and Spin-Off Products
38
If there are not available data, PVVC establishes the data from Table 11, and the rest of
the parameters must be calculated to obtain the rated characteristics of the modelled
machine.
Stator resistance (p.u.) 0.005 – 0.007
Rotor resistance (p.u.) 0.005 – 0.007
Stator leakage reactance (p.u.) 0.1 – 0.15
Rotor leakage reactance (p.u.) 0.04 – 0.06
Magnetizing reactance (p.u.) 4 – 5
Table 11. Squirrel cage induction generator characteristic parameters.
If there are no manufacturer data for the wind turbine inertia, the value to model the wind
turbine is H = 4 s.
For the doubly fed induction generator, the simplyfied model must take into account the
rotor dynamics, to determine the overcurrent tripping of the wind turbine during voltage
dips.
Finally, the simplified model of the full converter generator consists of a constant current
source.
7.3 Evaluation of the wind installation response
Once the system has been modelled, the evaluation simulations must be performed. The test
categories and the operation point prior the voltage dip in the verification process are the
same of the in-field test, shown in Table 3 and Table 6 (section 5.2), but, in the simulation,
the reactive power before the voltage dip must be zero.
In the simulation results, the next requirements must be checked:
1.
Continuity of supply. The wind farm must withstand the dips without disconnection.
The simulation model must include the protections that determine the disconnection of
the wind turbines. As has been shown in section 7.1, there are two possibilities for the
wind farm modeling:
•
Detailed model (without aggregation). In this case, the continuity of supply is
guaranteed if the real power of the disconnected wind turbines during the
simulation does not exceed the 5% of the real power before the dip.
•
Aggregated model. In this case, the continuity of supply is guaranteed if the
equivalent generator remains connected during the simulation of the dips.
2.
Voltage and current levels at the WTG terminals. Before verification simulations, a no
load simulation must be done, in order to check that the depth and the duration of the
simulation of the voltage dips fulfil the PVVC requirements (see section 5.2).
During the simulation of the four categories shown in Table 3, voltage and current
values in each phase must be measured and recorded with a sampling frequency at
least of 5 kHz.
If a library model is used the voltage must remain above 0.85 p.u. during the simulation
3.
Real and reactive power exchanges as described in OP 12.3. The power exchanges must
fulfil the requirements shown in Table 12 and Table 13.
The definition of the different zones is shown in Fig. 17.
Wind Farms and Grid Codes
39
Three phase faults OP 12.3 requirements
ZONE A
Net consumption Q < 60% Pn (20 ms) -0.6 p.u.
ZONE B
Net consumption P < 10% Pn (20 ms) -0.1 p.u.
Average I
r
/I
tot
0.9 p.u.
ZONE C
Net consumption E
r
< 60% Pn * 150 ms -90 ms*p.u.
Net consumption I
r
< 1.5 I
n
(20 ms) -1.5 p.u.
Table 12. Power and energy requirements for three phase voltage dips in the General
Verification Process.
Two phase faults OP 12.3 requirements
ZONE B
Net consumption E
r
< 40% Pn * 100 ms -40 ms*p.u.
Net consumption Q < 40% Pn (20 ms) -0.4 p.u.
Net consumption E
a
< 45% Pn * 100 ms -45 ms*p.u.
Net consumption P < 30% Pn (20 ms) -0.3 p.u.
Table 13. Power and energy requirements for isolated two phase voltage dips in the General
Verification Process.
8. References
Amarís, H. (2007). Power Quality Solutions for Voltage dip compensation at Wind Farms,
Power Engineering Society General Meeting, 2007. IEEE , Issue Date: 24-28 June 2007
Asociación Empresarial Eólica (AEE). Procedure for verification validation and certification
of the requirements of the PO 12.3 on the response of wind farms in the event of
voltage dips. November 2007.
Bundesministerium der Ordinance on system services by wind energy plants (system
services ordinance – SDLWindV), 03 July 2009, published in the Federal Law
Gazette 2009, Part I, No. 39
REE. (2006). Requisitos de respuesta frente a huecos de tensión de las instalaciones de
producción de Régimen Especial. Procedimiento de Operación 12.3. Red Eléctrica
de España. October 2006.
Fördergesellschaft Windenergie und andere Erneuerbare Energien (FGW), Technical
Guidelines for Power Generating Units. Part 3. Determination of electrical
characteristics of power generating units to MV, HV and EHV grids, Revision 20,
01.10.2009
Fördergesellschaft Windenergie und andere Erneuerbare Energien (FGW), Technical
Guidelines for Power Generating Units. Part 4. Requirements for modelling and
validation of simulation models of the electrical characteristics of power generating
units and systems, Revision 4, 01.10.2009
Fördergesellschaft Windenergie und andere Erneuerbare Energien (FGW), Technical
Guidelines for Power Generating Units. Part 8. Certification of the electrical
From Turbine to Wind Farms - Technical Requirements and Spin-Off Products
40
characteristics of power generating units and systems in the medium., high- and
highest-voltage grids, Revision 1, 01.10.2009
Hingorani, N. G. & Gyugyi, L. (1999). Understanding FACTS: concepts and technology of flexible
AC transmission system. Wiley-IEEE Press, 1999
Gamesa Eólica, S.A. Patent WO/2006/108890. Voltage sag generator device. Sag-swell and
outage generator for performance test of custom power devices
Gamesa Innovation and Technology, S.L. Patent WO/2006/106163. Low-Voltage dip
generator device.
García-Gracia, M.; Comech, M.P.; Sallán, J. & Llombart, A. (2008) Modelling wind farms for
grid disturbance studies. Renew Energy (2008), doi:10.1016/j.renene.2007.12.007.
García-Gracia. M.; Comech, M.P.; Sallán. J.; Lopez-Andía, D. & Alonso, O. (2009). Voltage
dip generator for wind energy systems up to 5 MW, Applied Energy, 86 (2009) 565–
574, doi:10.1016/j.apenergy.2008.07.006
Jauch, C.; Sørensen, P.; Norhem, I. & Rasmussen, C. (2007). Simulation of the impact of wind
power on the transient fault behaviour of the Nordic power system. Electric Power
Syst Res 2007;77:135-44.
Khadkikar, V. ; Aganval, P.; Chandra, A.; Bany A.O. & Nguyen T.D. (2004). A Simple New
Control Technique For Unified Power Quality Conditioner (UPQC), 11th
International Conference on Harmonics and Quality of Power
López, J.; Gubía, E.; Olea, E.; Ruiz, J. & Luis Marroyo, L. (2009). Ride Through of Wind
Turbines With Doubly Fed Induction Generator Under Symmetrical Voltage Dips.
IEEE Transactions On Industrial Electronics, Vol. 56, No. 10, Oct 2009
Molinas, M.; Suul, J.A. & Undeland, T. (2008). Low Voltage Ride Through of Wind Farms
With Cage Generators: STATCOM Versus SVC. IEEE Transactions On Power
Electronics, Vol. 23, No. 3, May 2008
Morren, J. & de Haan, S.W.H (2005) .Ridethrough of wind turbines with doubly fed
induction generators during a voltage dip. IEEE Trans. Energy Convers. vol. 20, no.
2, pp. 435-441, Jun. 2005
Morren, J. & de Haan, S.W.H. (2007) Short-Circuit current of wind turbines with doubly fed
induction generator. IEEE Trans. On Energy convers, vol. 22, no. 1, march 2007
Muyeen, S.M.; Takahashi, R.; Murata, T.; Tamura, J.; Ali, M.H.; Matsumura, Y.; Kuwayama,
A. & Matsumoto, T. (2009). Low voltage ride through capability enhancement of
wind turbine generator system during network disturbance. IET Renew. Power
Gener., 2009, Vol. 3, No. 1, pp. 65–74, ISSN 1752-1416
Muyeen, S.M. & Rion Takahashi, R. (2010). A Variable Speed Wind Turbine Control Strategy
to Meet Wind Farm Grid Code Requirements. IEEE Transactions On Power Systems,
Vol. 25, No. 1, Feb 2010 331-340
Niiranen J. Experiences on voltage dip ride through factory testing of synchronous and
doubly fed generator drives. 11th European Conference on Power Electronics and
Applications. Dresden 2005
Rodríguez, J.M.; Fernández, J.L.; Beato, D.; Iturbe, R.; Usaola, J.; Ledesma, P. (2002).
Incidence on power system dynamics of high penetration of fixed speed and
doubly fed wind energy systems: study of the Spanish case. IEEE Trans Power Syst
2002;17(4):1089-95
Wizmar Wahab, S.; and Mohd Yusof. A. (Elektrika Voltage Sag and Mitigation Using
Dynamic Voltage Restorer (DVR) System. VOL. 8, NO. 2, 2006, 32-37
3
Active and Reactive Power Formulations for
Grid Code Requirements Verification
Vicente León-Martínez and Joaquín Montañana-Romeu
Universidad Politécnica de Valencia
Spain
1. Introduction
Wind power penetration has reached important levels in several European, American and
other world countries. Wind electric energy production in some countries is comparable
with that obtained through the nuclear and other conventional energies, thus System
Operators in many nations have established wind farms grid codes in order to remain grid
stability. Grid code requirements have been developed in response to the technical and
regulatory necessities in each country; so there are a great variety of wind farms connection
requirements. However, all grid codes have in common some quantities such as voltage,
frequency and active and reactive powers and currents must be verified.
In other hand, grid code requirements do not specify which active and reactive power and
current formulations must be used. A lot of power approaches can be used. Several recently
established approaches consider active and reactive phenomena must be analyzed by the
fundamental-frequency, positive-sequence voltages and currents; this is because these last
quantities determinate generators working and electromechanical stability. The IEEE
Standard 1459-2010 explicitly holds one of these theories, due to A.E. Emanuel. The p-q-r
theory, developed by Akagi and others, also establishes fundamental-frequency, positive-
sequence active and reactive powers. The Unified Theory described in this Chapter gives
one more step in front of the two above mentioned theories and decomposes fundamental-
frequency, positive-sequence active and reactive powers and currents into two quantities: a)
due to the active and reactive loads and b) caused by the unbalances. According to the
Unified Theory unbalances can originate additional active and reactive powers and currents
which can have the same or different sign of those due to active and reactive loads and,
therefore, total active and reactive powers and currents can be increased or decreased. This
active and reactive powers and currents decomposition can deliver important
complementary information for verifying accomplishment of the grid code requirements
and to regulate wind generators in order to win without disconnection transitory
perturbations, such as voltage dips.
In this Chapter, the two above indicated fundamental-frequency, positive-sequence active
and reactive components of powers and currents are expressed and their properties are
established. Formulations of these quantities are applied on actual wind farms to verify
some European Grid Code requirements, focusing on the Spanish grid code, and their
results are compared with those obtained from other power approaches.
From Turbine to Wind Farms - Technical Requirements and Spin-Off Products
42
Conclusions show that power and current formulations established in this Chapter are
important tools to analyze wind farms working in normal operation and in presence of
transitory disturbances, and these formulations can be proposed for a future grid code
harmonisation.
2. Active and reactive powers and currents formulations applied to wind
farms
Figure 1 schematically shows the equivalent circuit of a wind generator connected to the
grid (represented by a delta-connected load). Phases of the wind generator are star-
connected and there is no neutral wire. Active and reactive phenomena in these power
systems do not depend on the zero-sequence voltages and, thus, any artificial ground can be
chosen to measure phase voltages at the point of common coupling (PCC).
Fig. 1. Equivalent circuit of a wind generator connected to the grid
Active and reactive phenomena in that power system are analyzed and their characteristic
quantities are formulated in this section using the Unified Theory (León et al., 2001).
Traditional active and reactive powers included in the IEEE Standard 1459-2010 will be
expressed at last of this section in order to compare the results obtained with these
mentioned approaches applied on data registered in actual wind farms, in other sections.
2.1 Active and reactive phenomena according to the unified theory
Unified Theory (León et al., 2001) establishes the active and the reactive phenomena occur
because the fundamental positive-sequence voltages and currents. This consideration also is
implicitly established by the p-q-r theory (Kim et al., 2002) and Emanuel’s theory, included
in the IEEE Standard 1459-2010. Importance of the fundamental-frequency positive-
sequence quantities is they determinate the main magnetic field and the useful torque of the
wind generators and, consequently, the adequate working and stability of those machines.
Contribution of the Unified Theory with respect to the two above mentioned approaches is
active and reactive currents and powers have been decomposed into two components: (a)
due to the loads and (b) caused by the unbalances (León et al., 2007; 2009). These new
quantities established by the Unified Theory give better and greater information about the
manifesting phenomena, which can be applied to analyze wind generators working.
2.1.1 Unified theory’s active and reactive currents
Let’s consider the equivalent circuit of a wind-generator connected to the grid, represented
in fig.1. Fundamental-frequency voltages obtained at the point of common coupling (PCC)
Active and Reactive Power Formulations for Grid Code Requirements Verification
43
by Fourier’s analysis are unbalanced, in general, and their CRMS line to line values
(
,,
A
BBCCA
VVV) can be decomposed into the positive-sequence (
A
B
V
+
) and the negative-
sequence (
A
B
V
−
) components, by Stokvis-Fortescue:
2
2
AB AB AB
BC BC BC AB AB
CA CA CA AB AB
VV V
VV V aV aV
VV V aV aV
+−
+
−+−
+
−+ −
=+
=+= +
=+= +
(1)
expressions where
a = 1/120º and the voltage symmetrical components are obtained as:
2
1
3
2
1
3
()
()
AB AB BC CA AB
AB AB BC CA AB
VVaVaVV
VVaVaVV
α
α
+
++
−−
−
=++ =
=++=
(2)
Load phase currents be expressed in function of those voltage symmetrical components and
the load admittances (
,,
A
BBCCA
YYY):
2
2
()
()
()
AB AB AB AB AB AB
BC BC BC BC AB AB
CA CA CA CA AB AB
IYVYV V
IYVYaV aV
IYVYaV aV
+−
+
−
+
−
=⋅=⋅ +
=⋅=⋅ +
=⋅=⋅ +
(3)
These currents are unbalanced, in general, and thus their symmetrical components are, by
Stokvis-Fortescue:
A
BABiAB
A
B h AB AB
A
Bo i AB h AB
IYVYV
IYVYV
IYVYV
+
++ −
−
++ −
+
−
=⋅ +⋅
=⋅ +⋅
=⋅ +⋅
(4)
where subscripts (+), (-) and (o), respectively denote positive-, negative- and zero-sequence
components, and the admittances are:
-
Positive admittance,
1
3
()
e
eABBCCAe
YYYYY
α
−
=++= (5)
-
Basic unbalance admittance for the negative-sequence,
2
1
3
()
i
iABBCCAi
YYaYaYY
α
−
=++= (6)
-
Basic unbalance admittance for the positive-sequence,
2
1
3
()
h
hABBCCAh
YYaYaYY
α
−
=++ = (7)
Positive admittance (
e
Y
) is the admittance of the equivalent balanced load which absorbs
the same active and reactive powers that the real unbalanced load when are supplied with
the fundamental-frequency positive-sequence voltages. Basic unbalance admittance for the
From Turbine to Wind Farms - Technical Requirements and Spin-Off Products
44
negative-sequence (
i
Y ) denotes the increasing of the fundamental positive-sequence
currents due to the negative-sequence voltage effects. Basic unbalance admittance for the
positive-sequence (
h
Y ) defines the increasing of the fundamental negative-sequence
currents due to the positive-sequence voltage effects.
Line to artificial-ground voltages (
,,
A
BC
VVV
) at the PCC of the circuit showed in fig. 1 have
the following fundamental positive- and negative-sequence components, by Stokvis-
Fortescue:
30º 30º
33
AB AB
AA
VV
VV
+−
+−
−
== (8)
Fundamental positive-sequence line currents (
,,
A
BC
III) supplied by the wind-generator
showed in fig. 1 are unbalanced have the following general expression, from (4) and (8):
30º
33()
A
AB A e u i
II VYY
δ
++ +
−
=
=⋅+⋅ (9)
where
AB
uu
AB
V
V
α
α
δδ
−
+
−
−
+
== (10)
is the unbalance degree of the phase to phase voltages at the PCC.
From (9), two components of the fundamental positive-sequence line currents may be
established: active and reactive. Active fundamental positive-sequence line current (
A
a
I
+
)
has the following general expression:
3(cos cos( ))
3( cos( ))
Aa A e e u i i
Aeui i
IVY Y
VG Y
αδ ααα
δααα
++ −+
+−+
=
⋅⋅ +⋅⋅ −− =
=⋅+⋅⋅ −−
(11)
being
cos
ee e
GY
α
=⋅ the load positive conductance, the real part of the positive admittance
(
e
Y ). The above current is 0º dephased with the fundamental positive-sequence phase to
ground voltage (
A
V
+
) and it transfers the useful power (positive-sequence active power, P
+
)
produced by the wind-generator. Active fundamental positive-sequence line current may be
decomposed into two components too, as it is appreciated from (11):
3cos 3
3cos( )
Aaa e e A e A
A
au u i i A
IY VGV
IY V
α
δααα
++
+
−+ +
=⋅ ⋅=
=⋅⋅ −−⋅
(12)
First component of the active fundamental positive-sequence line currents,
A
aa
I
+
, transfers
the active power in the best efficiency and power quality conditions (
a
P
+
), i.e., when
voltages are sinusoidal and balanced, with positive-sequence. Second component,
A
au
I
+
,
characterizes the increasing (positive or negative) of positive-sequence active power caused
by the voltage and load (grid) unbalances (
u
P
+
).
Reactive fundamental positive-sequence line current (
A
r
I
+
) is the component of
A
I
+
90º
dephased with respect to
A
V
+
, which transfers the positive-sequence reactive power (Q
+
).
General expression of this current is, from (9):
Active and Reactive Power Formulations for Grid Code Requirements Verification
45
3(sin sin( ))
3( sin( ))
Ar A e e u i i
Aeui i
IjVY Y
jV B Y
αδ ααα
δααα
++ −+
+−+
=
⋅− ⋅ + ⋅ ⋅ − − =
=⋅+⋅⋅−−∓
(13)
where
sin
ee e
BY
α
=⋅ is the load positive susceptance, the imaginary part of the positive
admittance (
e
Y ) Reactive fundamental positive-sequence line current also holds two
components:
3sin 3
3sin( )
A
rr e e A e A
Ar u u i i A
I
j
YV
j
BV
IjY V
α
δ ααα
+
++
+
−+ +
=− ⋅ ⋅ =
=⋅⋅ −−⋅
∓
(14)
First component,
A
rr
I
+
, transfers the positive-sequence reactive power with balanced
voltages (
r
Q
+
); thus, this current delivers the load reactive power (negative sign of this
quantity in (14) corresponds with inductive loads and positive sign is for capacitive loads).
Second component,
A
ru
I
+
, represents the increasing (positive or negative) of the reactive
power caused by the voltage and load (grid) unbalances (
u
Q
+
).
2.1.2 Unified theory’s active and reactive powers
Fundamental positive-sequence complex power supplied by the wind generator showed in
fig. 1 is expressed as:
*2***
39()
AA A e ui
SVI VY YPQ
δ
+
++ + + +
=⋅=⋅+⋅=+ (15)
Positive-sequence active power (
P
+
) is the real part of the above quantity and it
characterizes the direct torque applied to the axis of the wind-generator. This quantity has
two components, due to the active loads (
a
P
+
) and caused by the unbalances (
u
P
+
):
*2
*2
*2
39(cos()
39
39cos()
A
Aa A e u i i a u
aAAaaeA
uAAauui iA
PVI VG Y PP
PVI GV
PVI Y V
δααα
δααα
++++ +− ++
+++ +
+++ +− +
=⋅=⋅+⋅⋅ −+=+
=⋅=
=⋅=⋅⋅ −+⋅
(16)
a
P
+
is the positive-sequence active power supplied by the wind-generator under positive-
sequence balanced voltages; thus, it may be defined as the positive-sequence active power
due to the load consumptions. This quantity measures the active power which is
transformed under the best efficiency and power quality conditions.
u
P
+
represents the
increasing of the positive-sequence active power produced by the voltage and load
unbalances. Last quantity identifies the poor power quality in the power system, since it
occurs when there are voltage unbalances, and it may have the same or different sign
that
a
P
+
, so it increases or decreases the total positive-sequence active power (
P
+
).
Positive-sequence reactive power (
Q
+
) is the module of the imaginary part of the positive-
sequence complex power. Expressed in complex notation, this quantity has the following
formulation:
*2
2
39(sinsin())
9( sin( ))
AAr A e eui i
Aeui iru
QVI jVY Y
jV B Y Q Q
αδ ααα
δ ααα
+++ + +−
++−++
=
⋅= ⋅⋅ +⋅⋅ −+=
=⋅±+⋅⋅−+=+
(17)
From Turbine to Wind Farms - Technical Requirements and Spin-Off Products
46
Positive-sequence reactive power characterizes the main magnetic field of the wind-
generator and it holds two components, due to the reactive loads (
r
Q
+
) and caused by the
unbalances (
u
Q
+
):
*22
*2
39sin9
39sin()
rAArr eeA eA
uAAru ui iA
QVI jY V jBV
QVI jY V
α
δ ααα
+
++ + +
+
++ +− +
=⋅=⋅⋅=±
=⋅=⋅⋅ −+⋅
(18)
r
Q
+
is the positive-sequence reactive power supplied by the wind-generator under
positive-sequence balanced voltages. This quantity determinates the reactive power
established under the best efficiency and power quality conditions.
u
Q
+
defines the
increasing of the positive-sequence active power produced by the voltage and load
unbalances. This quantity identifies the poor power quality in the power system, since it
occurs when there are voltage unbalances, and it may have the same or different character
(inductive or capacitive) that
r
Q
+
, and thus it can increase or decrease the positive-
sequence reactive power , Q
+
.
2.2 Active and reactive phenomena according to the Spanish Grid Code
Active and reactive currents and powers are not explicitly formulated in the Spanish Grid
Code (O.P. 12.3); however, traditional formulations of these quantities can be implicitly
appreciated in the grid code text, such as will be seen in the next section. Those active and
reactive formulations are obtained from Budeanu´s approach, applied to sinusoidal circuits,
and they are included into the IEEE Standard 1459-2010.
Active and reactive currents supplied by the wind-generator (
az
I
,
rz
I
, z=A,B,C) are the
traditionally known fundamental-frequency line current 0º and ± 90º respectively dephased
with respect to its fundamental phase voltage (
z
V
),
22
zz
az z z z rz z z z
zz
PQ
IGV V IBV
j
V
VV
=⋅= =⋅=∓
(19)
Active current transfers the active power of each phase (
z
P ) and reactive current delivers
the reactive power of the correspondent phase (
z
Q ).
Active and reactive powers supplied by the wind-generator, according to the Spanish Grid
Code implicitly proposes, are the well-known active and reactive powers for sinusoidal
three-phase circuits:
***
,,
***
,,
z A aA B aB C aC
zABC
z A rA B rB C rC
zABC
PPVIVIVI
QQVIVIVI
=
=
==⋅+⋅+⋅
∑
=
=⋅+⋅+⋅
∑
(20)
Positive-sequence active and reactive powers (P
+
, Q
+
) described in the before section are
respectively included in the above quantities, but also active and reactive powers expressed
by (20) contain quantities due to the fundamental-frequency negative-sequence voltages and
currents (
P
-
, Q
-
).
Active and Reactive Power Formulations for Grid Code Requirements Verification
47
3. Grid code requirements
Grid codes established by the different countries provides the minimum operation and
security requirements of the wind farms installations connected to the Electric Network in
order to guarantee the supply continuity in presence of voltage dips. The Spanish Operation
Procedure O.P. 12.3, which constitutes the present Spanish Grid Code, establishes wind
farms and all their components must be able to withstand, without disconnection, transient
voltage dips at the grid point of common coupling caused by three-phase, two-phase and
single-phase faults within the area described by the voltage-time characteristic showed in
fig.2a. That characteristic or LVRT (Low Voltage Ride Through) requirements has been
recently modified by the draft of the Spanish Operation Procedure O.P. 12.2 by increasing
the allowed depth of the voltage drop up to zero during the first 150 ms after the beginning
of the disturbance (fig.2b), similar to the LVRT requirements of the German Grid Code from
E.ON Netz, represented in fig.2c.
Fig. 2. Low Voltage Ride Through requirements: (a) Spanish O.P. 12.3, (b) Spanish O.P. 12.2
(draft), (c) E.ON Netz
3.1 Reactive power requirements
The present Spanish Grid Code (O.P. 12.3) prescribes that reactive power consumptions are
not allowed in the wind farm installations at the point of common coupling with the grid
during the voltage dip and the following clearance fault and voltage recovery. However,
some reactive power consumptions lower than 60% of the registered rated power in each
cycle (20 ms) may be allowed during just the 150 ms after the beginning of three-phase
balanced voltage dips and the 150 ms after its clearance (fig.3a). These admitted periods of
reactive power consumptions will be reduced in the future Spanish Grid Code (O.P. 12.2) to
40 ms after the beginning of the fault and 80 ms after the voltage recovery and clearance
fault (fig.4a).
From Turbine to Wind Farms - Technical Requirements and Spin-Off Products
48
For unbalanced single-phase and two-phase voltage dips (fig.3b), some unspecified reactive
power consumptions are allowed during the 150 ms after the beginning of the fault (80 ms
according to the O.P. 12.2, fig.4b) and the 150 ms after the voltage recovery (80 ms according to
the O.P. 12.2, fig.4b). But, some reactive power consumptions lower than 40% of the registered
rated powers are admitted during all disturbance duration for periods lower than 100 ms.
Reactive power for unbalanced faults is defined by the present Spanish Grid Code like the
sum of the reactive powers supplied to each grid phases, i.e., such as it is expressed by (20).
E.ON German Grid Code establishes grid voltages must be supported during the transient
voltage dips by supplying the necessary reactive power, with a limit of the wind farm
registered rated power.
Fig. 3. Reactive power requirements according to the O.P. 12.3: (a) Balanced voltage dips; (b)
unbalanced voltage dips
Fig. 4. Reactive power requirements according to the O.P. 12.2: (a) Balanced voltage dips; (b)
unbalanced voltage dips