Advances in Gas Turbine Technology Part 10 pptx
Bạn đang xem bản rút gọn của tài liệu. Xem và tải ngay bản đầy đủ của tài liệu tại đây (988.57 KB, 30 trang )
Developments of Gas Turbine Combustors for Air-Blown and Oxygen-Blown IGCC
259
The nitrogen of NH
3
in the fuel has weaker bonding power than N
2
. In the combustion
process, NH
3
reacted with the OH, O, and H radicals and then easily decomposed into the
intermediate NHi by the following reactions (Miller et al., 1983).
NH
3
+ OH (O, H) ⇔ NH
2
+ H
2
O (OH, H
2
) (3)
NHi (i=
1, 2) + OH (H) ⇔ NHi-1 + H
2
O (H
2
)
(4)
When hydrocarbon is not contained in the fuel, NHi is converted into N
2
by reacting with
NO in the fuel-rich region. If fuel contains CH
4
, HCN is produced by reactions 5 and 6 in the
fuel-rich region and the HCN is oxidized to NO in the fuel-lean zone (Heap et al, 1976) and
(Takagi et al, 1979).
CHi (i=
1,2) + N
2
⇔ HCN + NHi-1 (5)
R-CH + NHi
⇔ HCN + R-Hi, (R- : Alkyl group) (6)
Some HCN is oxidized into NO by reactions 7 and 8, and the rest is decomposed into N
radical by the reaction 9. NH radical is decomposed into the NO by reactions 10, 11, and 12.
With the rise in CH
4
concentration in gasified fuel, the HCN increases, and NOx emissions
originated from HCN in the fuel-lean secondary combustion zone increase.
HCN + OH
⇔ CN + H
2
O (7)
CN + O
2
⇔ CO + NO (8)
CN + O
⇔ CO + N (9)
NH + OH
⇔ N + H
2
O (10)
N + O
2
⇔ NO + O (11)
N + OH
⇔ NO + H (12)
On the other hand, some NH radical produced by the reactions 3, 4 and 5 are reacted with
Zel’dovich NO, Prompt NO and fuel-N oxidized NO, which produced by above reactions,
and decomposed into N
2
by the reaction 13.
NO + NH
⇔ N
2
+ OH
(13)
That is, it is surmised that each of increase in thermal-NOx concentration and fuel-NOx
affected the alternative decomposition reaction of intermediate NH radical with NO, so the
each of NOx emissions originated from the nitrogen in the air or fuel-N decreased.
These new techniques those adopted the nitrogen direct injection and the two-stage
combustion, caused a decrease in flame temperature in the primary combustion zone and
the thermal-NOx production near the burner was expected to be controlled. On the
contrary, we were afraid that the flame temperature near the burner was declined too low at
lower load conditions and so a stable combustion cannot be maintained. The designed
combustor was given another nitrogen injection function, in which nitrogen was bypassed
to premix with the air derived from the compressor at lower load conditions, and a stable
flame can be maintained in a wide range of turn-down operations. Also, because the
Advances in Gas Turbine Technology
260
nitrogen dilution in the fuel-rich region affected the reduction characteristics of NH
3
, the
increase in nitrogen dilution raised the conversion rates of NH
3
to NOx. This tendency
showed the same as that of the case where nitrogenous compounds in fuel increased,
indicated by Sarofim et al.(1975), Kato et al.(1976) and Takagi et al.(1977). That is, it is
necessary that the nitrogen bypassing technique is expected to improve fuel-NOx reduction
in the cases of higher concentration of NH
3
.
3.3.3 Test results
Supplied fuels into the combustor were adjusted as same propertied as that of the slurry-
feed coal gasified fuel. In tests, the effects of the CH
4
concentrations, etc. in the supplied
fuels on the combustion characteristics were investigated and the combustor’s performances
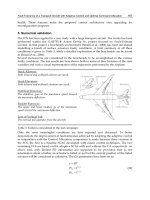
were predicted in the typical commercial operations. Figure 20 estimates the combustion
emission characteristics under the simulated operational conditions of 1773K-class gas
turbine for IGCC in the case where gasified fuel contains 0.1 percent CH
4
and 500ppm NH
3
.
Total NOx emissions were surmised as low as 34ppm (corrected at 16 percent O
2
) in the
range where the gas turbine load was 25 percent or higher, which is the single fuel firing of
gasified fuel, while the NOx emissions tend to increase slightly with the rise in the gas
turbine load. In the tests of the simulated fuel that contained no NH
3
, thermal-NOx
emissions were as low as 8ppm (corrected at 16 percent O
2
). On the other hand, we can
expect that combustion efficiency is around 100 percent under operational conditions of the
medium-Btu fueled gas turbine.
0 20 40 60 80 100
Gas Turbine Lord %
0
20
40
60
80
100
NOx(16%O2) ppm
99.5
99.6
99.7
99.8
99.9
100
η %
HHV=8.8MJ/m
NH
3
=500ppm
CH
4
=0.1%
3
Fig. 20. Combustion emission characteristics
4. Conclusion
Based on basic combustion test results using small burners and model combustors, Japanese
electric industries proposed the correspond combustion technologies for each gasified fuels,
designed combustors fitted with a suitable nitrogen injection nozzle, two-stage combustion,
or lean combustion for each gasified fuel, and demonstrated those combustors‘
performances under gas turbine operational conditions. As summarized in Table 6, the
developed combustors showed to be completely-satisfied with the performances of 1773K-
class gas turbine combustor in the actual operations. That is, these combustion technologies
reduced each type of NOx emissions for each gasified fuel, while maintaining the other
Combustion efficiency %
Developments of Gas Turbine Combustors for Air-Blown and Oxygen-Blown IGCC
261
combustor’s characteristics enough. Furthermore, developed technologies represent a
possible step towards the 1873K-class gas turbine combustor.
To keep stable supplies of energy and protect the global environment, it will be important
that human beings not only use finite fossil fuel, such as oil and coal, but also reexamine
unused resources and reclaim waste, and develop highly effective usage of such resources.
The IGCC technologies could have the potential to use highly efficient resources not widely
in use today for power generation.
Synthetic gas cleanup
Wet type Hot/Dry type
Gasification
agent
Air
・1573K-class gas turbine
combustor for BFG
・thermal-NOx ≦20ppm*
・1773K-class combustor
・NOx emissions ≦60ppm*
・thermal-NOx ≦ 8ppm*
・P.F.(rated) ≦ 8%
O
2
・1573K-class combustor
・thermal-NOx ≦11ppm*
・P.F.(rated) =10~13%
・1773K-class combustor
・NOx emissions ≦34ppm*
・thermal-NOx ≦8ppm*
・P.F.(rated) ≦ 7%
* : Concentration corrected at 16% oxygen in exhaust
Table 6. Performances of gasified fueled combustors
5. Acknowledgment
The author wishes to express their appreciation to the many people who have contributed to
this investigation.
6. Nomenclature
CO/H
2
Molar ratio of carbon monoxide to hydrogen in fuel [mol/mol]
C.R. Conversion rate from ammonia in fuel to NOx [%]
HHV Higher heating value of fuel at 273 K, 0.1 MPa basis [MJ/m
3
]
N
2
/Fuel Nitrogen over fuel supply ratio [kg/kg]
NOx(16%O
2
) NOx emissions corrected at 16% oxygen in exhaust [ppm]
P
Pressure inside the combustor [MPa]
T
air
Temperature of supplied air [K]
T
ex
Average temperature of combustor exhaust gas [K]
T
fuel
Temperature of supplied fuel [K]
T
N
2
Temperature of supplied nitrogen [K]
ex
Average equivalence ratio at combustor exhaust
p
Average equivalence ratio in primary combustion zone
7. References
Battista, R.A. & Farrell, R.A. (1979). Development of an Industrial Gas Turbine Combustor
Burning a Variety of Coal-Derived Low Btu Fuels and Distillate, ASME paper,
No.79-GT-172, San Diego, California, USA, March 11-15, 1979.
Advances in Gas Turbine Technology
262
Becker, B. & Schetter, B. (1992). Gas Turbines Above 150 MW for Integrated Coal
Gasification Combined Cycles (IGCC), Trans. ASME: J Eng. Gas Turbines Power,
Vol.114, pp.660-664, ISSN 0742-4795.
Beebe, K.W.; Symonds, R.A. & Notardonato, J. (1982). Evaluation of Advanced Combustion
Concepts for Dry NOx Suppression with Coal-Derived, Gaseous Fuels, DOE/
NASA/ 13111-11, NASA TM, 82985.
Beer, J.M. (2007). High Efficiency Electric Power Generation: The Environmental Role. Prog.
Energy Combust. Sci. , Vol.33, pp.107–134, 2007, ISSN 0360-1285.
Brown, T.D. (1982). Coal Gasification: Combined Cycles for Electricity Production. Prog.
Energy Combust. Sci., Vol.8, pp.277–301, ISSN 0360-1285.
Bush, W.V.; Baker, D.C. & Tijm, P.J.A. (1991). Shell Coal Gasification Plant(SCGP-1)
Environmental Performance Results, EPRI Interim Report No. GS-7397, Project
2695-1.
Chase, Jr.M.W.; Davies, C.A.; Downey, Jr.J.R.; Frurip, D.J.; McDonald, R.A. & Syverud, A.N.
(1985). JANAF Thermodynamical tables 3rd Edition., J. Phys. Chem. Reference Data,
Vol.14, ISSN 0047-2689.
Clark, W.D.; Folsom, B.A.; Seeker, W.R. & Courtney, C.W. (1982). Bench scale testing of
low-NOx LBG combustors, Trans. ASME: J Eng. Power, Vol.104, pp.120-128, ISSN
0742-4795.
Cohen, N. (1992). Flammability and Explosion Limits of H
2
and H
2
/CO: A Literature
Review; Aerospace Report No.TR-92(2534)-1; the Aerospace Corporation: El
Segundo, CA, USA, September 10, 1992.
Consonni, S.; Larson, E.D. & Berglin, N. (1997). Black Liquor-Gasifier/Gas Turbine
Cogeneration, ASME paper, No.97-GT-273, Orlando, Florida, USA, June 2-5,
1997.
Cook, C.S.; Corman, J.C. & Todd, D.M. (1994). System evaluation and LBtu fuel combustion
studies for IGCC power generation, ASME paper, No.94-GT-366, The Hague, The
Netherlands, June13-16, 1994.
Coward, H.F. & Jones, G.W. (1952). Limits of Flammability of Gases and Vapors,
Bulletin 503 Bureau of Mines, United States Government printing office,
Washington.
Dixon-Lewis, G. & Willians, D.J. (1969).The Oxidation of Hydrogen and Carbon
Monoxide, chapter 1. In: Comprehensive Chemical Kinetics, Bamford, C.H.,
Tipper, C.F.H., Eds., pp.1-248, Elsevier Pub. Co.: Amsterdam, The Netherlands,
ISBN 0444416315.
Döbbeling, K.; Knöpfel, H.P.; Polifke, W.; Winkler, D.; Steinbach, C. & Sattelmayer, T. (1994).
Low NOx premixed combustion of MBtu fuels using the ABB double cone burner
(EV burner), ASME paper, No.94-GT-394, The Hague, The Netherlands, June13-16,
1994.
Drake, M.C.; Pitz, R.W.; Correa, S.M., & Lapp, M. (1984). Nitric Oxide Formation from
Thermal and Fuel-bound Nitrogen Sources in a Turbulent Nonpremixed Syngas
Flame, Proc. 20th Symp.(Int.) Combust., The Combust. Inst., pp.1983-1990, ISSN 0082-
0784, Ann Arbor, MI, USA, August 1984.
Developments of Gas Turbine Combustors for Air-Blown and Oxygen-Blown IGCC
263
Folsom, B.A.; Courtney, C.W. & Heap, M.P. (1980). The Effects of LBG Composition and
Combustor Characteristics on Fuel NOx Formation, Trans. ASME: J. Eng. Power,
Vol.102, pp.459-467, ISSN 0742-4795.
Haavisto, I. (1996). Fixed Bed Gasification of Solid Biomass Fuel, In: Power Production from
Biomass
Ⅱ
with Special Emphasis on Gasification and Pyrolysis R&DD, Sipila, K.,
Korhonen, M., Eds.; Technical Research Centre of Finland: Espoo, Finland, Vol.164,
pp. 127–132, ISBN 9513845559.
Hasegawa, T. & Sato, M. (1997). Study on NOx Formation Characteristics of Medium-Btu
Coal Gasified Fuel, Trans. Japan. Soc. Mech. Eng., B, Vol.63, pp.3123–3130, ISSN
0387-5016. (in Japanese).
Hasegawa, T.; Sato, M. & Ninomiya, T. (1998a). Effect of Pressure on Emission
Characteristics in LBG-Fueled 1500
℃-Class Gas Turbine, Trans. ASME: J. Eng. Gas
Turbines Power, Vol.120, pp.481-487, ISSN 0742-4795.
Hasegawa, T.; Hisamatsu, T.; Katsuki, Y.; Sato, M.; Yamada, M.; Onoda, A. & Utsunomiya,
M. (1998b). A Study of Low NOx Combustion on Medium-Btu Fueled 1300 °C-
Class Gas Turbine Combustor in IGCC, ASME Paper, No.98-GT-331, Stockholm,
Sweden, June 1998.
Hasegawa, T. & Sato, M., (1998c). Study of Ammonia Removal from Coal-Gasified Fuel,
Combust. Flame, Vol.114, pp.246-258, ISSN 0010-2180.
Hasegawa, T.; Sato, M. & Nakata, T. (2001). A Study of Combustion Characteristics of
Gasified Coal Fuel, Trans. ASME: J. Eng. Gas Turbines Power, Vol.123, pp.22-32, ISSN
0742-4795.
Hasegawa, T.; Hisamatsu, T.; Katsuki, Y.; Sato, M.; Koizumi, H.; Hayashi, A. & Kobayashi,
N., (2003). Development of Low NOx Combustion Technology in Medium-Btu
Fueled 1300
℃-Class Gas Turbine Combustor in IGCC, Trans. ASME: J. Eng. Gas
Turbines Power, Vol.125, pp.1-10, ISSN 0742-4795.
Hasegawa, T. & Tamaru, T. (2007). Gas Turbine Combustion Technology Reducing both
Fuel-NOx and Thermal-NOx Emissions in Oxygen-Blown IGCC with Hot/Dry
Synthetic Gas Cleanup. Trans. ASME: J. Eng. Gas Turbines Power, Vol.129, pp.358–
369, ISSN 0742-4795.
Heap, M.P.; Tyson, T.J; Cichanowicz, J.E.; Gershman, R.; Kau, C.J.; Martin, G.B. & Lanier,
W.S. (1976). Environmental Aspects of low BTU gas combustion, Proc. 16th Symp.
(Int.) on Combust., The Combust. Inst., pp.535-545, ISSN 0082-0784, Cambridge,
Massachusetts, USA, August 15-20, 1976.
Hindmarsh, A.C. (1974). GEAR: Ordinary Differential Equation System Solver,
Lawrence Livermore Laboratory, Univ. California, Report No. UCID-30001,
Rev.3.
Hobbs, M.L.; Radulovic, P.T. & Smoot, L.D. (1993). Combustion and Gasification of
Coals in Fixed-beds, Prog. Energy Combust. Sci., Vol.19, pp.505–586, ISSN 0360-
1285.
Ishibasi, Y.; Oomori, T. & Uchiyama, Y. (1978). Experimental Study on Swirl Flame of Low-
Calorific Gas, Proc. the 6th Annual Conf. Gas Turbine Soc. Jpn., pp.7-11, Tokyo, Japan
(in Japanese).
Advances in Gas Turbine Technology
264
Ishizuka, S. & Tsuji, H. (1981). An Experimental Study of Effect of Inert Gases on
Extinction of Laminar Diffusion Flames, Proc. 18th Symp. (Int.) on Combust., The
Combust. Inst., pp.695-703, ISSN 0082-0784, Waterloo, Canada, August 17-22,
1980.
Isles, J. (2007). Europe Clean Coal Power Priorities are on Carbon Capture and Storage. In:
Gas Turbine World, DeBiasi, V., Ed.; Pequot Publishing: Fairfield, CT, USA, Vol.37,
pp. 20–24, ISSN 0746-4134.
Jenkins, S.D. (1995). Tampa electric company's polk power station IGCC project, Proc. 12th.
Annual Int. Pittsburgh Coal Conference, p.79, Pittsburgh, PA, USA.
Kalsall, G.J.; Smith, M.A. & Cannon, M.F. (1994). Low Emissions Combustor Development
for an Industrial Gas Turbine to Utilize LCV Fuel Gas, Trans. ASME: J. Eng. Gas
Turbines Power Vol.116, pp.559-566, ISSN 0742-4795.
Kato, K.; Fujii, K.; Kurata, T. & Mori, K. (1976). Formation and Control of Nitric Oxide from
Fuel Nitrogen : 1st Report, Experimental and Modelling Studies of Fuel NO in
Premixed Flat Flames, Trans. Japan. Soc. Mech. Eng., Series 2, Vol.42, pp.582-591,
ISSN 0029-0270. (in Japanese)
Kee, R.J.; Rupley, F.M. & Miller, J.A. (1990). The CHEMKIN Thermodynamic Data Base,
Sandia Report, SAND 87-8215B.
Kelleher, E.G. (1985). Gasification fo kraft black liquor and use of the pruducts in combined
cycle cogeneration, phase 2 final report, DOE/CS/40341-T5, prepared by
Champion Int'1. Co. for U.S. Dept. of Energy, Wash., D.C.
Kurimura, M.; Hara, S.; Inumaru, J.; Ashizawa, M.; Ichikawa, K. & Kajitani, S. (1995). A
Study of Gasification Reactivity of Air-Blown Entrained Flow Coal Gasifier, Proc.
8th. Int. Conference on Coal Science, Elsevier Science B.V., Amsterdam, Vol.1, pp.563-
566, ISBN:9780444822277.
Littlewood, K. (1977). Gasification: Theory and Application. Prog. Energy Combust. Sci.,
Vol.3, pp.35–71, ISSN 0360-1285.
Martin, F.J. & Dederick, P.K. (1977). NOx from Fuel Nitrogen in Two-stage combustion,
Proc.16th Symp. (Int.) on Comb./The Comb. Institute., pp.191-198, ISSN 0082-0784,
Cambridge, Massachusetts, USA, August 15-20, 1976.
Merryman, E.L. & Levy, A. (1997). NOx Formation in CO Flames; Report No.EPA-
600/2-77-008c; Battelle-Columbus Laboratories: Columbus, OH, USA, January
1997.
Miller, J.A.; Smooke, M.D.; Green, R.M. & Kee, R.J. (1983). Kinetic Modeling of the
Oxidation of Ammonia in Flames, Combust. Sci. Technol., Vol.34, pp.149-176,
ISSN 0010-2202.
Miller, J.A.; Branch, M.C.; McLean, W.J.; Chandler, D.W.; Smooke, M.D. & Kee, R.J. (1984).
The Conversion of HCN to NO and N
2
in H
2
-O
2
-HCN-Ar Flames at Low Pressure,
Proc. of the 20th Symp.(Int.) Combust., The Combust. Inst., pp.673–684, ISSN 0082-
0784, Ann Arbor, MI, USA, August 1984.
Miller, J.A. & Bowman, C.T. (1989). Mechanism and modeling of nitrogen chemistry
in combustion, Prog. Energy Combust. Sci., Vol.15, pp.287-338, ISSN 0360-
1285.
Developments of Gas Turbine Combustors for Air-Blown and Oxygen-Blown IGCC
265
Morgan, G.H. & Kane, W.R. (1962). Some Effects of Inert Diluents on Flame Speeds and
Temperatures, Proc. 4th Symp.(Int.) on Combust., The Combust. Inst., pp.313-320,
ISSN 0082-0784.
Nagano, T. (2009), Development of IGCC Demonstration Plant, Journal of the
Gas Turbine Society of Japan, Vol.37, No.2, pp.72-77, ISSN 0387-4168 (in
Japanese).
Nakayama, T.; Ito, S.; Matsuda, H.; Shirai, H.; Kobayashi, M.; Tanaka, T. & Ishikawa, H.
(1990). Development of Fixed-Bed Type Hot Gas Cleanup Technologies for
Integrated Coal Gasification Combined Cycle Power Generation, Central Research
Institute of Electric Power Industry Report No.EW89015.
Paisley, M.A. & Anson, D. (1997). Biomass Gasification for Gas Turbine Based
Power Generation, ASME paper, No.97-GT-5, Orlando, Florida, USA, June 2-5,
1997.
Pillsbury, P.W.; Cleary, E.N.G.; Singh, P.P. & Chamberlin, R.M. (1976). Emission Results
from Coal Gas Burning in Gas Turbine Combustors, Trans. ASME: J Eng. Power,
Vol.98, pp.88-96, ISSN 0742-4795.
Pratt, D.T.; Bowman, B.R. & Crowe, C.T. (1971). Prediction of Nitric Oxide Formation in
Turbojet Engines by PSR Analysis, AIAA paper No.71-713, Salt Lake City, Utah,
USA, June 14-18, 1971.
Roll, M.W. (1995). The construction, startup and operation of the repowered Wabash River
coal gasification project, Proc. 12th. Annual Int. Pittsburgh Coal Conference, pp.72-77,
Pittsburgh, PA, USA.
Sarofim, A.F.; Williams, G.C.; Modell, M. & Slater, S.M. (1975). Conversion of Fuel Nitrogen
to Nitric Oxide in Premixed and Diffusion Flames, AIChE Symp. Series., Vol.71,
No.148, pp.51-61.
Savelli, J.F. & Touchton, G.I. (1985). Development of a gas turbine combustion system for
medium-Btu fuel, ASME paper, No.85-GT-98, Houston, Texas, USA, March 17-21,
1985.
Song, Y.H.; Blair, D.W.; SimisnskiV.J. & Bartok, W. Conversion of Fixed Nitrogen to N
2
in
Rich Combustion, Proc. of the 18th Symp.(Int.) on Combust., pp. 53–63, ISSN 0082-
0784, Waterloo, Canada, August 17-22, 1980.
Takagi, T.; Ogasawara, M.; Daizo, M. & Tatsumi, T. (1976). NOx Formation from Nitrogen in
Fuel and Air during Turbulent Diffusion Combustion, Proc. 16th Symp. (Int.)
Combust., The Combust. Institute., pp.181-189, ISSN 0082-0784, Cambridge,
Massachusetts, USA, August 15-20, 1976.
Takagi, T.; Tatsumi, T. & Ogasawara, M. (1979). Nitric Oxide Formation from Fuel Nitrogen
in Staged Combustion: Roles of HCN and NHi, Combustion and Flames, Vol.35,
pp.17-25, ISSN 0010-2180.
White, D.J.; Kubasco, A.J.; LeCren, R.T. & Notardonato, J.J. (1983). Combustion
Characteristics of Hydrogen-Carbon Monoxide Based Gaseous Fuels, ASME paper,
No.83-GT-142, Phoenix, Arizona, USA, March 27-31, 1983.
Yamagishi, K.; Nozawa, M.; Yoshie, T.; Tokumoto, T. & Kakegawa, Y. (1974). A Study of
NOx emission Characteristics in Two-stage Combustion, Proc.15th Symp. (Int.) on
Advances in Gas Turbine Technology
266
Comb., The Comb. Institute., pp.1157-1166, ISSN 0082-0784, Tokyo, Japan, August
25-31, 1974.
Zanello, P. & Tasselli, A. (1996). Gas Turbine Firing Medium Btu Gas from Gasification
Plant, ASME paper, No.96-GT-8, Birmingham, England, June10-13, 1996.
12
Characterization of a Spray in the Combustion
Chamber of a Low Emission Gas Turbine
Georges Descombes
Laboratoire de génie des procédés pour l’environnement, l’énergie et la santé
France
1. Introduction
The use of a turbo-alternator in Lean Premixed Prevaporized combustion (LPP) for hybrid
vehicles is beneficial in reducing pollutant emissions at the nominal operating point. The
electric thermal hybrid demonstrator studied here consists of a low-emission gas turbine
and an alternator which provides the electric power to an electric propulsion motor and a
storage battery.
The combustion chamber of the gas turbine is adapted to the nominal operating point so as
to function in pre-vaporized combustion, premixed and lean mixtures. A problematic point,
however, is the emission of smoke and unburnt hydrocarbons during start-up because the
geometry of the combustion chamber is not adapted to moderate air flows.
In the transitional stages of start, an air-assisted pilot injector vaporizes the fuel in the
combustion chamber. The jet is ignited by a spark, the alternator being used as an electric
starter. This starting phase causes, however, the formation of a fuel film on the walls which
can be observed as locally rich pockets.
1 2 3 4 5 6
Exchanger Fuel Ignition Turbine Compressor Alternator
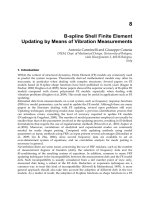
Fig. 1. Diagram of the turbo alternator
Advances in Gas Turbine Technology
268
2. The turbo alternator
The turbo alternator has a single-shaft architecture on which the wheels of the compressor
and turbine, as well as the high speed alternator, are fixed. The turbine is a single-stage
compression/expansion, radial machine with a heat exchanger, as shown in Figure 1. At the
nominal operating point, the supercharging air is preheated upstream of the combustion
chamber by recovering heat from exhaust gases, thus improving the output of the cycle
while decreasing the compression ratio. The exchanger consists of a ceramic heat storage
matrix rotated around its axis by a hydraulic engine.
The turbo-alternator delivers an electric output of 38 kW at full load at 90000 rpm. The
acceptance tests provide the cartography of the stabilized performance of the turbo-
alternator from the turbine inlet temperature and the number of revolutions. The power and
the output increase naturally with the temperature, and the optimal operating range is
between 70000 and 85000 rpm; the temperature is between 975°C and 1025°C.
3. The combustion chamber
The Lean Premixed Pre-vaporized (LPP) combustion chamber is divided into three zones
(Figure 2). First of all, the fuel is injected and vaporized in a flow of hot air with which it
mixes. In this zone, complete evaporation and a homogeneous mixture must be achieved
before the reaction zone preferably just above the low extinction limit in order to limit the
formation of NO
x
emissions (Leonard and Stegmaïer, 1993, Ripplinger et al., 1998). The
flame is then stabilized with the creation of re-circulation zones, and combustion proceeds
with a maximum flame temperature generally lower than 2000K (Poeschl et al., 1994,
Ohkubo et al., 1994). The third area is the dilution zone which lowers the temperature below
the threshold imposed by the temperature limit of the turbine blades (Turrell et al., 2004).
1 2 3 4 5 6 7
Pilot
injector
Main
injectors
Lean
mixture
Lean
combustion
Dilution
zone
Pilot flame
Mixture
pipe
Fig. 2. Diagram of the LPP combustion chamber
The geometry of this combustion chamber is optimised for nominal operation. As
modification of the aero-thermodynamic characteristics of the air flow at partial load and at
start-up is not conducive to flame stability (Schmidt, 1995), a pilot injector is therefore used;
this also serves as a two-phase flame whose fuel spray does not burn in premixed flame.
Characterization of a Spray in the Combustion Chamber of a Low Emission Gas Turbine
269
4. The pilot injector
During the starting phase, the low compression ratio and thermal inertia of the exchanger
means that the inlet air cannot be preheated, making LPP operation impossible. The main
injectors do not intervene during this phase and are used only when a temperature above
800°C is reached at the turbine inlet.
A pilot injector is used to vaporize the fuel during start-up. The jet is ignited by the spark
and a turbulent two-phase flame ensures the temperature increase of the machine.
Additional fuel is also provided by the pilot injector to stabilize the flame in weak
combustion modes and at low power.
The coaxial injector is characterized by a central fuel jet surrounded by a peripheral high-
speed gas flow. The system provides the injector with predetermined and adjustable
quantities of liquid fuel and air flow. It is composed of two parts, an air-assisted circuit and
a pressurized fuel circuit.
It is observed that the maximum fuel flow, which is about 8 kg/h of fuel for a pressure of 12
bar, remains insufficient to obtain correct vaporization of the fuel. A complementary air-
assisted circuit is therefore necessary to interact with the fuel swirl of the pilot injector
where atomisation begins. Fuel atomisation is intensified by the counter-rotating movement
of the two fluids (Figure 3).
Fig. 3. Formation of the fuel-air mixture
The tests carried out in the laboratory on a turbo-alternator test bench also showed the need
for a variable air flow in the pilot injector because the fuel jet of the pilot injector does not
always ignite correctly. When a significant increase in temperature is detected in the
exhaust, smoke is emitted and its concentration varies significantly depending on the
injection parameters . The evolution of the air flow acts directly on the ignition timing and
the temperature, as shown by the curves on figure 4.
The ignition timing increases with the increase in the air pressure and the temperature
increases more rapidly when the air pressure rises. It is observed that smoke appears
approximately thirty seconds after the start-up of the turbine, but vanishes more quickly
when the air pressure is higher. Increasing the temperature velocity setting of the turbine
made it possible to optimise the burnt fuel fraction and to reduce smoke emissions
(Pichouron, 2001).
Advances in Gas Turbine Technology
270
TiT (°C) Speed (rpm)
0
100
200
300
400
500
600
700
800
900
0
20 40 60 80 100 120
Time (s)
0
10000
20000
30000
40000
50000
60000
TIT (P=0.4 bar) TIT (P=0.5 bar) TIT (P=0,25 bar)
TIT (P=0,6 bar)
Speed
(
Fig. 4. Evolution of the turbine inlet temperature (TiT) and turbine speed (rpm) at start up of
the gas turbine as a function of time and air pressure
5. Experimental study of the non-reactive jet
The preliminary start tests and the analytical study revealed the existence of a correlation
between the ignition and the combustion of a fuel spray as a function of its physical
characteristics (Pichouron, 2001). The vaporization dynamics of the pilot injector were first
studied in the starting phase. The influence of the injection parameters were controlled as
was the quality of the jet in terms of drop size, law of distribution as well as jet angle and
mass fuel distribution. This cartography aimed to define the optimised operating points as
well as the boundary conditions which were then used in the numerical study of the jet.
The air flow of the pilot injector significantly modifies the structure of the jet which is
characterized by the spray angle, the fragmentation length, the size distribution of the
droplets inside the spray and the penetration. Photographs of the jet taken on the injection
bench in the laboratory show the effect of the air flow on the structure of the jet (Figure 5).
(a) without air flow (b) with an air flow of 10 l/min
Fig. 5. Cartography of the spray (liquid flow: 7.3 kg/h)
Inlet temperature turbine (°C)
Speed turbine (rpm)
Characterization of a Spray in the Combustion Chamber of a Low Emission Gas Turbine
271
A granulometric study conducted with the participation of the laboratory CORIA (Rouen,
France) also made it possible to measure the distribution of the drop diameters of the injector
as a function of the air pressure, the viscosity and the fuel pressure (table 1). The drop sizes
were measured by the optical diffraction of a laser beam which passes through the cloud of
drops. By measuring the thickness of the cloud of drops in the path of the laser beam and the
attenuation of the direct beam, the volume concentration can be obtained (Figure 6). These
results made it possible to give the initial conditions of the jet and its dispersed phase.
The geometry of the jet was experimentally investigated in order to measure the angle
formed by the jet, to determine the mass distribution of the fuel in the jet and to study axial
symmetry. The test bench is composed of a feeding circuit of fuel and air (Figure 7). The fuel
jet which develops with the free air is studied and the air mass fuel rates of air flow for the
operating points are given in table 1.
Fuel flow (kg/h) 4,4 5,7 6,6 7,7
Air flow (l/min) 10-16-24 10-16-24 10-16-24 10-16-24
Table 1. Operating points for the geometrical study of the spray
Fig. 6. Diagram of the drop size measurements
Fig. 7. Diagram of the test rig for characterization of the spray
Advances in Gas Turbine Technology
272
6. Modelling of the jet
6.1 Identification of a volume law of distribution
The most widely used expression is that originally developed for powders by Rosin and
Rammler, where Q is the fraction of total volume contained in drops with a diameter
lower than D, X and Q are two parameters which characterize the drops composing the jet
(Eq. 1).
q
X
D
Q
exp1
(1)
By identifying X and Q using the experimental results of the granulometric study (Ohkubo
and Idota, 1994), the distribution of the drop sizes of the injector must be checked by the
Rosin-Rammler law where X is the diameter when 63.2% of the liquid volume is dispersed
in drops smaller than X, Q being calculated starting from the Rosin-Rammler law (Eq. 2).
XD
Q
q
/ln
1lnln
(2)
Figure 8 shows the experimental distribution curve and the associated Rosin Rammler law.
The measurements were made at the centre of the spray. The air and fuel mass flows are
respectively 16 l/min and 7.7 kg/h. The curves are cumulative distributions of the drop
sizes and represent the fraction of the total spray volume in drops larger than the diameter
considered. Each measurement corresponds to an operating point of the injector to which
corresponds a calculation of the coefficients X and Q of the Rosin-Rammler law.
0
0.1
0.2
0.3
0.4
0.5
0.6
0.7
0.8
0.9
1
0 100 200 300 400 500 600
Rosin Rammler
Exp.
diameter of drops ()
Fig. 8. Experimental distribution of the drop sizes and of the associated Rosin-Rammler law
The Rosin-Rammler law correctly describes the drop size distribution at the centre and the
periphery of the jet, in particular when the air flow is low. The validity of the law was then
checked for all the injector operating points and for the two fuels: diesel fuel and kerosene.
The modeling of the fuel jet in terms of drop size and volume distribution was thus
validated by the Rosin-Rammler law in which coefficients are given starting from the
granulometry results.
Fraction of total volume
Characterization of a Spray in the Combustion Chamber of a Low Emission Gas Turbine
273
6.2 Cartography of the jet
The effect of the air flow can be very clearly observed on figure 9 when the mass fuel rate of
flow is maintained constant. For an air flow of 24 l/min, 50% of the volume of fuel injected
is vaporized in drops with a diameter less than 50 microns. If the air flow is reduced to 3.5
l/min, the maximum drop size required to vaporize the same volume of fuel reaches 150
microns.
0
0.1
0.2
0.3
0.4
0.5
0.6
0.7
0.8
0.9
1
0 100 200 300 400 500 600
Air:3,5l/mn
Air:6l/mn
Air:16l/mn
Air:24l/mn
diameter of drops ()
Fig. 9. Evolution of the spray granulometry as a function of the air flow (measurements
made 10 mm from the spray centre, mass fuel flow 7.7 kg/h)
The study also shows that the increase in the mass fuel flow rate makes the jet less uniform by
producing a significant number of large drops. The increase in the mass fuel flow rate from 4.4
to 7.7 kg/h causes an increase in the maximum drop size from 150 to 250 microns in the centre
of the jet. The effects related to the increase of the mass fuel flow rate are also greater at the
periphery than in the centre of the jet. These results confirm that the level of atomisation in the
jet can be estimated by calculating the mass ratio of the mass fuel flow rate and the air flow.
6.3 Angle of the spray
The jet angle has a value ranging between 30 and 35° on both sides of the longitudinal axis
of the injector when the air flow is 24 l/min and it is the same for a flow for 10 l/min. This
shows that the geometry of the jet is independent of the mass fuel flow rate when the air
flow is 24 l/min. Finally, in agreement with Lefebvre (1989), it can be concluded that the jet
angle is only slightly influenced by the air flow.
6.4 Mass distribution of the fuel in the jet
The air flow strongly influences the mass distribution of the fuel in the jet, since increasing
the air flow concentrates a high proportion of the fuel in the centre of the jet. Only a small
quantity of fuel is then located beyond 30° from the injector axis. The tests show
conclusively that the axial symmetry of the jet is respected for the operating conditions, in
particular with air flows above 20 l/min.
6.5 Correlations of the SAUTER average diameter
The lack of a consolidated theory on vaporization processes meant that empirical
correlations had to be used to evaluate the relation between a representative diameter, the
Fraction of total volume
Advances in Gas Turbine Technology
274
average diameter and the injection conditions which relate to the physical properties of the
liquid, the geometrical characteristics of the injector as well as the outputs of liquid and air
flow.
Several definitions of the average diameter have been established depending on the
processes observed, but the SAUTER average diameter is generally used to describe
vaporization in a medium in which mass and heat transfer phenomena dominate, such as
the combustion of a fuel jet (Inamura and Nagai, 1985, Simmons, 1979, Elkotb et al., 1982,
Faeth, 1983).
The evolution of the properties of the pilot injector jet is estimated starting from the
correlation of Elkotb et al., 1982. It takes into account a geometrical parameter (the diameter
of the injector exit), the physical properties of the fluid to be vaporized (surface stress,
density and viscosity) and the operating conditions (relative velocities of the liquid and the
ambient air, and ratio of the air flow to the liquid flow).
The correlations studied make it possible to better understand the operation of the air-
assisted injector used at turbine start-up. The SAUTER average diameter grows with the
increase in viscosity and the surface tension of the liquid spray. The use of kerosene, which
is less viscous than diesel fuel, makes it possible to decrease the SAUTER average diameter,
and the air flow contributes very significantly to vaporization. It is indeed necessary to
obtain a high relative speed between the liquid spray and the ambient conditions to ensure
good atomisation. This speed is obtained by maintaining the ratio of the mass throughput
of the air flow to the mass throughput of liquid spray close to a value of 0.4.
7. Numerical study of the non-reactive jet
Modelling is based on the concept of average size but the aim is not to seek the spatial and
temporal evolution of the instantaneous sizes, rather to study their average behaviour. The
instantaneous flow field is therefore replaced by an average part and a fluctuating part.
These definitions are applied to the conservation equations and the “average temporal”
operator is then applied to the resulting equations.
The non-linearity of the convection terms reveals additional terms which represent the
correlations of the fluctuations in the physical sizes of the flow. These unknown factors are
approximated using an isotropic k- model both for the study of the non-reactive jet and for
the later study of turbulent combustion in gas phase. The concept of turbulent viscosity
proposed by Boussinesq shows that it is possible to approach the additional terms
(Pichouron, 2001).
7.1 Liquid phase
The spray is modelled according to a Lagrangian description by a particle unit and it is
assumed that the dispersed phase is sufficiently diluted to neglect interactions between the
drops (Zamuner, 1995). In practice, the volume fraction occupied by the drops in the jet
should not exceed 10 to 12%. Primary disintegration, coalescence and collisions between
drops can therefore be neglected. The jet is thus modelled by a set of drops grouped in
layers with initial conditions relating to the position, velocity, size, temperature and number
of drops represented.
The drops are assumed to be spherical and non-deformable, without clean rotation or
interaction (Zamuner, 1995, Wittig et al., 1993). The flow around a drop is assumed to be
Characterization of a Spray in the Combustion Chamber of a Low Emission Gas Turbine
275
homogeneous and the particle density much higher than that of gas. Gravity, the
Archimedes force, the added mass term, the force due to the pressure gradient , the Basset
force and the Saffman force, are neglected.
The initial conditions of the calculation of the drop trajectories in the dispersed phase result
from the experimental study of the jet. The initial drop diameters were determined by the
value of the diameters measured 30 mm downstream from the injector nozzle and it was
verified that the droplets did not undergo secondary vaporization outside the path of the
laser beam.
With low relative speeds, the spherical shape of the droplets is preserved by the combined
action of surface stress and the viscous forces of the fuel. When the speed increases, the
aerodynamic loads acting on the surface of the drop cause deformation, oscillation, and
finally disintegration of the liquid particle.
Two groups of parameters make it possible to distinguish the various modes from
secondary disintegration (Schmel et al., 1999, Yule and Salters, 1995), namely Weber
numbers We, and Ohnesorge numbers On (Eqs. 3 and 4) which respectively determine the
relationship between the aerodynamic loads exerted on the drop and the surface stress, and
the relationship between viscous friction in the drop and surface stress (Krzecskowski, 1995,
Pilch and Erdman, 1987). is the density of surrounding gas, u
rel
is relative speed between
gas and the particle, and D,
g
,
g
,
g
are respectively the diameter, surface stress, viscosity
and density of the fuel.
g
2
rel
Du
We
(3)
gg
g
D
On
(4)
No deformation, or oscillation is observed when the Weber number is lower than a breaking
value W
ec
. Beyond this breaking value, three different mechanisms are observed which
control the disintegration of the droplets in the case of typical Weber numbers of the flows
in a gas turbine combustion chamber. For an Onhesorge number higher than 0.1, a
significant influence of viscosity is observed and the transition between the various modes is
given by the Weber number. Correlation (5) can then be used to assess the degree of
vaporization in the two-phase flows measured. For the relative speeds studied, the drops
must have a minimum diameter of 100 m to undergo secondary vaporization.
W
ec
=12 (1+1.077 On
1.6
) (5)
The characterization of the jet shows that for an air flow of 24 l/min, the pilot injector emits
a jet made up mainly of drops with a diameter lower than 70 m. In this configuration, only
a very small quantity of the drops is subjected to secondary vaporization. On the other
hand, when the air flow is 10 l/min, a maximum diameter of drops of about 180 m is
reached.
Taking into account the ejection speeds estimated for the drops, it can be noted that only the
drops with diameters larger than 100 m are likely to reach the disintegration mode. This
indicates that secondary vaporization may therefore occur only over 1.5% in mass of the
total fuel flow. Lastly, even if the relative speed increase between the drops and gas favours
Advances in Gas Turbine Technology
276
secondary vaporization, this physical phenomenon will never be very important within the
present framework. Secondary vaporization was therefore be neglected, as was the
behaviour of the drops after rebound from the walls.
7.2 Gas phase
The fuel drops warm up and evaporate during their trajectory in the gas phase. The
evaporation process of a drop composed of a mixture of hydrocarbons can be divided into
three fields for modelling mass and heat transfer (Prommersberger et al., 1999, Aggarwal
and Peng, 1994).
The most fully developed approaches (model DLM, Diffusion Limit Model) take account of
the heterogeneous temperature field in the droplet, of the influence of the drop and the
multi-component composition of the hydrocarbon (Hallmann et al., 1995, Li, 1995). Certain
models treat drop heating and vaporization simultaneously, while others assume that the
droplet warms up initially without evaporating, and that when it reaches a sufficient
temperature, it vaporizes (Schmehl et al., 1999). It is the latter approach which is adopted
here, following three successive behavior laws (Pichouron, 2001). This involves calculating
reheating of the droplet without exchange of mass with the surrounding medium from the
ejection temperature until the vaporization temperature.
Beyond the vaporization temperature, the mass and heat transfer between the drop and the
surrounding medium is calculated, up to a boiling point. The convective boiling of the drop
at iso-temperature is then predicted.
Calculation proceeds in a fixed geometry with motionless walls, entries for the dilution and
air for combustion and an exit for the combustion products. For the entries and the exit, the
boundary conditions are imposed in flow in the study of the non-reactive jet and in pressure
in the later study of the turbulent combustion of the jet.
The limiting conditions of flow and pressure resulting from the experiment are obtained on
the test bench.
7.3 Coupling of the liquid and gas phases
The drops act on gas by the source terms introduced into the equations. The source terms
are determined by summing the exchanges along the trajectory of the particles which pass
through the control volume. The momentum transfer from the continuous phase to the
dispersed phase is obtained by calculating the variation in momentum of the particle
traversing the control volume. The heat exchanged between the continuous and dispersed
phases is deduced from the thermal variation in energy of the drop which passes through
the control volume. The mass transfer of the dispersed phase towards the continuous phase
is obtained by calculating the mass variation of the drop traversing the control volume
(Reitz and Bracco, 1982).
8. Limiting conditions of calculation
8.1 Space distribution of the drops at the injector outlet
For the 3D representation, the jet is described by a hollow cone. By defining several hollow
cones of identical origin and axis, but with a different ray R and angle , it is possible to
represent the jet of the pilot injector. The fuel drops initially form crowns, and taking into
account the secondary assumption of non-disintegration, the origin of the crowns is located
at the injector nozzle (Litchford and Jeng, 1991).
Characterization of a Spray in the Combustion Chamber of a Low Emission Gas Turbine
277
Initially, the fuel drops are thus divided regularly and into an identical number on
concentric crowns (Figure 10). Many numerical tests were carried out to determine the
optimal number of crowns. The best representation is obtained with ten crowns for
vaporization with an air flow of 24 l/min, and with five crowns for 14 l/min, the crown
having a constant external diameter of 2 mm.
Fig. 10. Example of space distribution of the drops on the injector outlet
8.2 Jet angle
The jet is represented by five or ten hollow cones for which it is necessary to define an angle
corresponding to the initial direction of the drops distributed on the crowns. From
experimental measurements of the jet angle, the external taper angle
ext
, was defined; the
hollow taper angle i
th
is then given by Equation (6), where N is the number of crowns.
n
i
ext
n
i
.
(6)
8.3 Initial diameters
To determine the initial Lagrangian diameters, two series of diameters were selected, based
on the granulometry measurements. It was observed that when the air flow in the injector
was 24 l/min, the drop sizes are less widely dispersed and that drops with a diameter above
100 m are rare. Similar observations were made for an air flow of 14l/min, with a
maximum diameter of 200 m. Five (respectively 10) classes of drops were therefore defined
for an air flow of 24 l/min (respectively 14 l/min). Each class corresponds to an initial
diameter in the calculation of the droplet trajectory.
8.4 Mass flow by trajectory
As the liquid phase flow has to be respected whatever the number of drops injected into the
calculation field, it is assumed that a fraction of this flow is allocated with each calculated
trajectory and the summation of the flows for each trajectory is equal to the fuel flow in the
injector. To attribute a flow to each trajectory, the Rosin-Rammler law was used, as it
satisfactorily characterizes the drop size distribution in the pilot injector jet . This
representation assumes that several identical drops forward per unit of time on each
trajectory (Zamuner, 1995).
Advances in Gas Turbine Technology
278
8.5 Initial particle speed
It is difficult to determine the initial particle speed given that the fuel is injected via the tube
into the injector envelope and that the action of the air flow on the liquid jet takes effect at
the very end of the injector envelope, in a zone very close to the section considered as the
modelling injection surface. Lay (1997) suggests choosing the initial speed of the drops
randomly in a range which evolves by 0 m/s at the local speed of the gas phase. It is further
assumed that the initial speed of the drops is constant whatever the diameter and the spatial
position of the particle. The estimated speed is based on the speed characteristics of the
liquid exiting the injector channel. Knowing that the effective bypass section at the nozzle of
the tube is 96.3.10
-3
mm
2
, a speed V
l
was determined for the liquid phase. The initial speed
of the drops V
g
is given by applying a corrective factor whose value depends on the air flow.
8.6 Grid of the geometry
The geometry selected to validate the injection model is a cylinder 300 mm in diameter and
200 mm in length; the medium is composed of air at rest under atmospheric pressure. At
one extremity of the cylinder, a centred disc with a diameter of 2.35 mm represents the
injector nozzle exit where the initial jet conditions and boundary conditions are imposed to
model the air flow. The other end of the cylinder is the simulation exit.
The grid of the geometry consists of 68000 hexahedral cells with a total of 70520 nodes; the
quality of the cells and nodes is monitored by a tracer. In the zone downstream from the
injector nozzle, the mesh size was fixed at a value ranging between 0.2 and 0.5 mm, based
on the results of Sugiyama et al., (1994) cited by Levy (1997), which indicate care should be
taken that the mesh does not exceed 1 mm on side in the delicate zones. The modelled field
is the top of the combustion chamber made up of the premixing tube and the air inlet ducts.
The fuel is vaporized in the premixing tube by the injector, the extremity of which is placed
in inlet duct.
8.7 Dispersed phase
Three reference test cases were used to compare the results, and the initial conditions of the
dispersed phase are defined following description given previously (table 2).
Case n°1 Air flow =0.285g/s (14l/min)
Fuel flow 1=1.84g/s (6,6 kg/h)
Case n°2 Air flow =0.5g/s (24l/min)
Fuel flow=1.22g/s (4,4 kg/h)
Case n°3 Air flow =05g/s (24l/min)
Fuel flow=1.84g/s
Table 2. Operating points for the study of the spray
8.8 Gas phase
A speed condition is imposed for the injector air flow which makes it possible to combine
the requirements of flow (experimental measurement of 14 l/min or 24 l/min) and of flow
direction (imposed by the geometry of the injector nozzle). A fraction of the total flow
measured on the test bench is imposed on the inlet ducts, based on the division of the
discharge between the air intake according to their effective surface.
Characterization of a Spray in the Combustion Chamber of a Low Emission Gas Turbine
279
9. Validation of calculations
9.1 Concentration
The calculated volume concentration of the liquid phase is compared with the experimental
results. In the post-processing phase, the concentration value calculated along lines
registered on a fictitious cylinder representing the laser beam and located 30 mm
downstream from the origin of the injection was recorded (Figure 11).
Fig. 11. Calculation of the average concentration of the liquid phase
Figure 12 represents the instantaneous concentrations of the liquid phase along the 5 radial
lines (C1 to C5) and the configurations of the concentrations remain similar to those
described in the literature for the three cases tested. A deficit in fuel drops on the axis of the
injector can be observed, followed by a very clear increase while moving away from the
axis, before a second deficit which corresponds to the physical limit of the jet. Note that this
same tendency was observed in the experimental study of the jet angle.
0
0,1
0,2
0,3
0,4
0,5
0,6
0,7
0,8
25 20 15 10 5 0 -5 -10 -15 -20
Transversal distance (mm)
Concentration (kg/m3)
C1
C2
C3
C4
C5
Fig. 12. Instantaneous concentration of the liquid phase as a function of the transverse
position. (mass fuel flow rate: 1.22 g/s and air flow: 0.5 g/s)
The numerical and experimental average concentrations for the three studied cases were
compared. The agreement is very good in the case of the lowest air flow (0.285g/s). For the
air flow of 0.5 g/s, the difference between the numerical and experimental results shows the
Advances in Gas Turbine Technology
280
limits of the injection model used here: the experimental study revealed the very strong
impact of the air flow on the disintegration of the jet and correlatively on the initial particle
speed, which significantly influences the trajectory and thus the concentration of the
droplets. The injection model however is kept to study the evolution of the two-phase flow
in the ignition zone.
9.2 Simulation of the ignition zone
The experiment shows that the explosion limits depend on the average diameter of the
droplets, and that an optimal drop size minimizes the ignition energy required. It was as
highlighted as in fact the smallest droplets govern the behavior of the spray to the ignition.
The injection model is thus used to numerically study the particle behavior in the ignition
zone as a function of their diameter, their initial position in relation to the injector nozzle,
and the air flow in the inlet ducts. In the simulation field, the end of the spark which
penetrates the ignition zone was not reproduced.
9.3 Aerodynamic field of the jet
Figure 13 shows the field rate of the gas flow for test case n°3. It is observed (13A) that the
gas has a high speed at the beginning of the jet due to the air flow, confirming the influence
of the air flow on the droplet trajectory that was observed in experiments. Downstream,
inside the premixing tube, it can be seen that the field speed is characterized by an intense
zone on the injector axis (again evidencing the influence of the air flow) and a calmer area
when deviating from the axis. Along the wall of the premixing tube, a return flow is
observed (13B), though the speeds reached locally (less than 7m/s) remain low compared to
the speeds reached on the injector axis.
m/s
m/s
(A) (B)
Fig. 13. Gas flow rate in a diametrical plane Field speed (A) and negative axial speed along
the walls (B)
The evolution of the radial profiles of the components speed is shown on Figure 14 for 4
positions on the axis of the premixing tube geometry. A strong decrease in axial speed can
be observed when the flow deviates from the axis, as along the axis. Observation of the
evolution of the radial and tangential components highlights the axi-symmetry of the flow
(14A and 14B). It can be seen that the maximum intensity of each component is reached in a
zone located 5-6 mm from the axis of the geometry, the dimensions of this corridor being
Characterization of a Spray in the Combustion Chamber of a Low Emission Gas Turbine
281
conditioned by the throttling diameter (12 mm) at the end of the convergent one. Beyond
this corridor, marginal recirculation zones with weak kinetic energy are formed under the
action of the central flow shearing forces.
(A) (B)
Fig. 14. Evolution of the profiles of the radial (A) and tangential (B) velocity components for
4 positions on the axis of the geometry
The simulation results for two positions on the axis (3 mm and 15 mm) and for each
component speed (Figure 15) were also compared. These test cases differ by their air flows.
The variation in the air flow significantly modifies the axial speed in the zone of the axis of
geometry (15A and 15B), has a more moderate influence on radial speed (15C and 15D), and
has no impact on tangential speed (15E and F).
(A) (B)
(C) (D)
Advances in Gas Turbine Technology
282
(E) (F)
(left-hand column: calculation with the position 3mm, right-hand column: calculation with the position 15mm)
Fig. 15. Comparison of the axial (A and B), radial (C and D) and tangential (E and F) velocity
components of gas for test cases 1 and 3.
The field velocity simulated close to the spark is shown on Figure 16. The mean velocity in
this zone is influenced primarily by the air flow entering the inlet ducts. It can be seen that
the re-circulation zone increases upstream with the increase in the air flow of combustion
(16A and B), and that the tangential component is significantly increased (16C and D). The
studies by Snyder et al., 1994, and Yamada et al., 1995 showed that the increased mean
velocity increases the minimal ignition energy and this effect will have to be taken into
account to define the ignition delay in the combustion chamber.
(A) (B)
(C) (D)
Fig. 16. Comparison of the field velocity in the ignition zone for two rotation speeds: 5000
rpm (A) and (C) and 40000 rpm (B) and (D)
Characterization of a Spray in the Combustion Chamber of a Low Emission Gas Turbine
283
9.4 Trajectory of the fuel drops
The trajectory of the drops is studied according to three principal parameters. The injector
air flow determines the granulometry of the jet and influences the aerodynamics along the
simulation axis. The rotation speed of the turbine determines the air flow entering the inlet
ducts and influences the swirl intensity in the premixing tube . The penetration depth of the
injector nozzle modifies the geometry of the simulation field.
The numerical study of the trajectories shows that drops with a diameter equal to or higher
than 40 m traverse the field, do not impact the walls and that their trajectories are
helicoidal. This effect is imposed by the swirl movement in the premixing tube. The increase
in the air flow (14 l/min to 24 l/min), by increasing the initial speed of the drops and the
axial speed of the gas phase along the axis of symmetry, decreases their residence time in
the ignition zone. For lower diameters, the drop-gas interaction has a stronger effect.
Figure 17 compares the trajectories of the 20 m drops injected from an identical origin and
with the same angle. In the case of vaporization at 14 l/min, the drop has less kinetic energy
and undergoes the surrounding aerodynamic effects more. The left-hand column on figure
17A shows the case with 14 l/min, and that on the right-hand side the case with 24 l/min
(figure 17B). The comparison shows that for the lowest flow, the trajectory of the drops
deviates more and that for the maximum angle, the return flow along the walls collects
more drops.
It can thus be considered that the damping of the walls is due to the smallest drops. They
have the lowest speed and are located in the zone outside the jet, and consequently, the jet
angle and particle speed need to be considered to study this phenomenon. The numerical
study also shows that damping of the walls can be carried out by direct impact of the largest
drops in the case of an open jet angle. In this case, the large drops have a rectilinear
trajectory from injection to the wall.
min/14 ,3,0 ,12 ,20
tan
lqmmrm
ceassis
min/24 ,3,0 ,12 ,20
tan
lqmmrm
ceassis
(A) (B)
Fig. 17. Trajectory of the 20-micron drops as a function of the air flow
9.5 Influence of the turbine rotation speed
The turbine rotation speed modifies the air flow in the entry ducts. We saw that this flow
does not have a significant influence on the gas flow in the zone close to the field axis where
the effects of the air flow of the injector dominate. Beyond this zone, on the contrary, the
swirl intensity increases with the air flow in the entry ducts and modifies the field gas speed