Heat Transfer Theoretical Analysis Experimental Investigations and Industrial Systems part 4 pot
Bạn đang xem bản rút gọn của tài liệu. Xem và tải ngay bản đầy đủ của tài liệu tại đây (1.57 MB, 40 trang )
Heat Transfer - Theoretical Analysis, Experimental Investigations and Industrial Systems
110
2004) where pressure information is required. Arrays of current pressure sensors can be
readily fabricated along the channel or in a micromixer for more detailed flow information.
They can also be fabricated at inlet, outlet or inside of a micropump for evaluation of its
performance.
Theoretical modeling for the stress and deformation of the diaphragm is derived. Numerical
calculation is provided for diaphragm design consideration. Finally, the current pressure
sensors made can provide a much better thermal insulation than the ones made by the
previous surface micromachining process of silicon because of the use of the extremely low
thermal conductivity materials, such as the SU-8 and the Pyrex glass. The SU-8 material has
a thermal conductivity of 0.2 W/mK (Monat et al., 2007) where the Pyrex glass has a value
of 1.4 W/mK. This is highly important in the fabrication of a micro thermal system where
thermal insulation should be seriously considered. More detailed fabrication techniques and
performance evaluation of this sensor are also provided and discussed.
6.2.2 Design consideration
Before fabrication process, the size of the SU-8 diaphragm used in the pressure sensor
should be determined from a proper analysis and design. The size of the SU-8 diaphragm is
actually determined by the pressure range to be measured, the maximum strain that the
diaphragm can sustain and the sensitivity required. The deformation of SU-8 diaphragm can
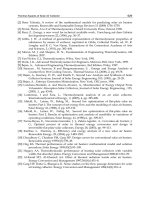
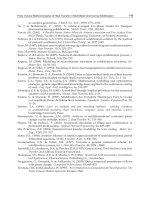
be modeled as a square shell or plate with four edge clamped under a uniform normal
pressure force as shown in Figure 19.
Fig. 19. Schematic diagram for the square plate deformed under pressure force.
From the solving of the governing equation for the deflection of the plate, the deflection of
plate can obtain:
4
1,3,5,
() ()sin
n
n
n
qb ny
uXx
Dn b
π
π
∞
=
=Σ
(6-4)
Microchannel Heat Transfer
111
By letting n= 1, 3 and 5 only, the maximum deflection can be found as follows:
4
2
max
3
(1 )
p
b
uC
Eh
ν
=−
(6-5)
where C is
4
0.032
1
α
+
, with the assumption that all edges of the plate are clamped, and α is
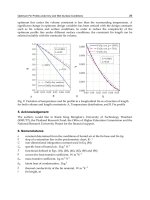
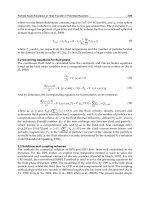
ratio of the width to the length of the plate. However, C obtained by Guckel (1990) is 0.0152.
The comparison is shown in Figure 20, which shows that for the diaphragm size of 200μm
by 200μm and the thickness of the diaphragm varying from three to thirteen micron, the
numerical result from ANSYS calculation agrees very well with the approximate solutions
of Westergaard and Guckel, respectively. Therefore, the ANSYS is adopted for calculation in
the design for proper size of diaphragm.
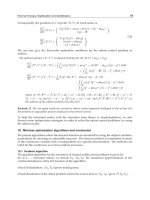
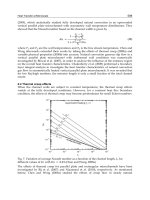
For a pressure range from 1 to 4 atms, the prediction for the maximum strain occurred in the
plate versus the applied pressure force is presented in Figure 21 for different thickness of
diaphragm. The maximum strain the SU-8 layer can sustain is found 0.77% (Guckel, 1991).
Therefore, the rectangle presented in Figure 21 represents the safety region where the
maximum strain is less than 0.77% for the diaphragm size designed. For a better sensitivity,
i.e. more deflection, the size of 150μm×150μm wide at a thickness of approximately 9 μm is
selected.
Fig. 20. Comparison of the numerical result from the ANSYS with the analytical results and
other published data.
Polymer pressure sensor does not have the problems of narrow depth of cavity and stiction
of diaphragm made by surface micromachining method. The most promising candidate for
pressure sensor fabrication is the use of the photoresists, i.e. SU-8. The SU-8 can be readily
Heat Transfer - Theoretical Analysis, Experimental Investigations and Industrial Systems
112
spin coated on the substrate from a few microns to a hundred microns thick. This can give
us a much deeper cavity depth if diaphragm layer can be properly deposited on the top to
enclose the cavity, as shown in Figure 18. The diaphragm designed uses the same material
as the cavity side wall in order to reduce difference of the thermal expansion coefficient for
the cavity wall and the diaphragm which may cause deflection of diaphragm and
significantly affect measurement accuracy. In this way, one would face another problem of
selecting suitable sacrificial material to fill into the cavity to create a flat surface in order to
spin coat the SU-8 diaphragm on the above. In addition, the sensor material currently
available, which is to be deposited on the top of diaphragm, is piezoresistive film that is a
doped polysilicon layer deposited by LPCVD at a high temperature process. The use of high
temperature process of doped polysilicon for sensor formation has precluded the possible
use of SU-8 as both diaphragm and side wall of cavity.
Fig. 21. The maximum strain variation with pressure for different sizes and thicknesses of
SU-8 diaphragm.
However, this difficulty can be readily overcome by reversing the fabrication process of the
pressure sensor. That is, one can first deposit the the piezoresistive layer and the metal lines
on the silicon substrate which is a high temperature process, and then the diaphragm and
the cavity wall which is a low temperature process. The piezoresistive layer can be made
with the polysilicon layer implanted with very high concentration of boron or phosphorous.
Microchannel Heat Transfer
113
In the current process, one selects very high concentration of boron such that the resistivity
variation with the temperature in the polysilicon layer can be minimized. From the
experimental data plotted in (Shen, 2004; Kanda, 1982; Mason, 1969), for boron
concentration greater than 10
20
atms/cm
3
the resistivity variation with temperature can be
negligible small. Thus, this concentration of boron is adopted in the implantation process for
the polysilicon layer. After implantation, the polysilicon is annealed for 30 mins at 950
o
C.
The next step is to spin coat SU-8 diaphragm, which has the flexibility to readily control the
thickness. It is then followed by spin coat another layer of SU-8 for cavity wall at desired
thickness. Thus, the formation of SU-8 layer will not go through a high temperature process.
Finally, a Pyrex glass can be bonded with the patterned SU-8 layer on the top to enclose the
cavities. Once the silicon substrate is completely removed by wet etch, a successful pressure
sensors can be readily achieved.
6.2.3 Fabrication processes (Ko, 2009)
1. A 0.3 μm thick LPCVD TEOS oxide is deposited on the (100) wafer and used as
protection mask for the upper layer devices during the later long period of TMAH wet
etch to completely remove the Si wafer.
2.
Next, a 0.3 μm thick LPCVD polysilicon film is deposited and then implanted heavily
with boron with a dose of 3×10
15
atoms/cm
2
. This amount of dosage corresponds to a
concentration of 10
20
atoms/cm
3
in the layer. After annealing at 950
o
C for 30 minutes,
the doped polysilicon is patterned as the pressure sensors.
3.
Before metallization, a 0.3 μm thick LPCVD TEOS oxide is deposited as insulation.
Then, contact holes were opened in this layer for metallization. The metallization was
made by sputtering standard IC four layers of metals, i.e. Ti/TiN/Al-Si-Cu/TiN with a
thickness of 0.04µm/0.1µm/0.9µm/0.04µm, respectively, onto the substrate surface.
The metal layers were then patterned into circuits, as shown in Figure 22(a).
4.
A 9 μm thick SU-8 layer is spin coated on the substrate as the pressure sensing
diaphragm. Then, a 50 μm thick SU-8 layer is spin coated again on the substrate and
patterned into the active cavity to allow for movement of the pressure diaphragm. It is
noted that there is a soft bake before layer exposure to evaporate the solvent and a post
exposure bake to make the edge between the exposed and unexposed region more
sharp and clear. Finally, instead of using the hard bake, a high intensity of light is used
to illuminate to complete the cross-linking of the resin since the hard bake will need a
temperature at 200
o
C that will damage the underneath thick epoxy layer. For the soft
bake, the SU-8 layer is first maintained at 65
o
C for 7 minutes with a 5
o
C/minute
ramping rate starting from room temperature, and then baked at 95
o
C for 15 minutes
with a 5
o
C/minute ramping rate starting from 65
o
C to release the internal residual
stress of SU-8 thick layer. In fact, the success of the SU-8 channel strongly depends on
the baking process after light exposure.
5.
It is now ready to move the devices made on the Si wafer onto a low thermal
conductivity Pyrex glass. This is done first by bonding the silicon wafer with the Pyrex
glass, as shown in Figure 22(b).
6.
After the bonding process, the silicon substrate is ready for removal and cleared off.
This is done by wet etch the silicon with TMAH solution at 90
o
C for 5-6 hours. Instead
of using KOH, the selection of TMAH is attributed to its relatively high selectivity for
silicon versus oxide. This can avoid the sensors attacked by the etchant during the long
period of wet etch process since the protection layer of the sensors are made of TEOS
Heat Transfer - Theoretical Analysis, Experimental Investigations and Industrial Systems
114
oxide. A successful movement of the pressure sensors onto the Pyrex glass substrate is
shown in Figure 23(a). The cavities of the pressure sensors are successfully made, as
shown in Figure 23(b). No distortion was found.
7.
Next, a 80 µm thick SU-8 layer is spin coated on the substrate and patterned by
lithography to form a test section for the pressurized gas.
8.
A PMMA plate is then bonded, using epoxy resin, to enclose the test section, as shown
in Figure 22(c). The pressure sensor is completed.
Epoxy layer
Silicon substrate
Dielectric layer (TEOS)
Sensors
SU-8 layer
Pyrex 7740 glass
Metal layer
PMMA plate
(a)
(b)
(c)
Test Section
Pressure Cavity
Epoxy layer
Silicon substrate
Dielectric layer (TEOS)
Sensors
SU-8 layer
Pyrex 7740 glass
Metal layer
PMMA plate
Epoxy layer
Silicon substrate
Dielectric layer (TEOS)
Sensors
SU-8 layer
Pyrex 7740 glass
Metal layer
PMMA plate
(a)
(b)
(c)
Test Section
Pressure Cavity
Fig. 22. Fabrication process of pressure sensor (Ko, 2009).
Microchannel Heat Transfer
115
Fig. 23. Side view of SEM photographs. (a) Pressure sensor resistor embedded in SU-8
diaphragm and (b) pressure sensor diaphragm and cavity made by SU-8 lithography (Ko,
2009).
6.2.4 Characteristics of pressure sensors (Ko, 2009)
Since the arrays of pressure sensors were made of polysilicon layer doped with a designated
concentration of 10
20
atoms/cm
3
of boron, the temperature coefficient of resistance (TCR) of
the sensors is almost zero which can eliminate the temperature effect for the sensors. In
addition, the resistance of sensors designed is very large and is about 57-58 KΩ. The
pressure effect on the resistivity of the sensor is expected very large. Therefore, the sensors
have a very high signal resolution. The complicated temperature compensation currents and
the electrical signal amplifier are not required and used in this sensor system. The
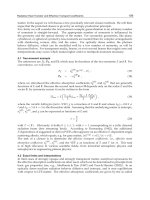
characteristic curves for the sensors were obtained, as shown in Figure 24. The results show
Heat Transfer - Theoretical Analysis, Experimental Investigations and Industrial Systems
116
a very linear variation between the pressure and the resistance of the sensors. Since the
diaphragm is made of SU-8 materials, which has a smaller Young’s modulus than the
polysilicon film, this leads to a higher strain in the SU-8 film. Therefore, the resolution for
the present SU-8 diaphragm sensors is much higher than the polysilicon diaphragm sensors
and is found to be 20.88 ohm/psig.
In order to test the reliability, i.e. the response, recovery and life time or fatigue of the
current pressure sensors, a pressurized air is supplied to the sensor cavity for a period of 30
seconds and then released. The repeated sharp rise and descend of the pressure, as shown in
Figure 25, suggests that the present SU-8 pressure sensor has very good reliability. Higher
frequency of pressure oscillation still indicates that response and recovery test in the current
sensor is still reliable except a slight drop of the oscillation signal is observed, as shown in
Figure 26. This slight drop in oscillation signal is attributed to the frictional heating of the
polymer diaphragm due to high frequency of vibrations. The frication heating increases the
temperature and leads to reduction of the resistance of the polysilicon sensor. After cooling
the sensor back to the ambient temperature, oscillation signal recovers back to the original
value. The frictional heating may not be readily seen in polysilicon sensor due to the very
high thermal conductivity of the material that can rapidly dissipate the frictional heating.
The test for membrane under high frequency oscillation of pressure has proceeded for more
than three thousand cycles which is more than 24 hours and does not indicates creeping or
fatigue of the SU-8 membrane.
In addition, the sensor is put into oven at controlled temperatures for calibration at different
temperatures. The results indicate that resistance variation at different temperatures is small
and is less than 1% of the measured value. As one plots pressure variation versus
temperature, as shown in Figure 27, the pressure variation is very small and less than 1 psig.
The small pressure variation versus temperature may be attributed to the difference in the
thermal expansion coefficient between the SU-8 and the Pyrex glass which causes small
stress in the SU-8 side wall and the diaphragm. It is expected that replacing the Pyrex glass
with other high temperature polymer plate, such as Poly(ether-ether-ketone) (PEEK), that
can endure the high temperature annealing process of the SU-8 and have a closer thermal
expansion coefficient to the SU-8, can further reduce the temperature effect on the pressure
measurements.
Finally, in order to ensure that the SU-8 side wall or the diaphragm of the sensor is not
permeable to the air, permeability test for the SU-8 to the air is performed. This is done by
sending pressurized air into the test section (chamber), as shown in Figure 22(c), of the
sensor at desired pressure level and closing both the inlet and outlet valves. The pressure
variation in the test section is monitored by the sensor for more than 7 days, and the signals
are sent into computer for plotting. It appears that the pressure inside the test section is
almost kept constant except for a slight variation due to noise from the instrument. The
variation of the pressure due to noise is less than 1.76% of the total pressure during a long
period of 7 day observation. This result indicates that the pressurized air inside the test
section will not leak slowly through the SU-8 diaphragm into the pressure chamber, nor the
pressurized air (in either the test section or the pressure chamber) will leak slowly through
the SU-8 side wall into the ambient. This permeability test also indicates that the SU-8
diaphragm will not creep under a constant pressure load of 350 kPa for 7 days. Therefore,
one may expect that the SU-8 diaphragm will not creep as long as the pressure load is
within the elastic deformation of the material unless when the material becomes aged.
Microchannel Heat Transfer
117
Fig. 24. A very linear variation between the pressure and the resistance of the sensors (Ko,
2009).
Fig. 25. Response and recovery test for pressure sensor at different pulsed pressures (Ko,
2009).
Heat Transfer - Theoretical Analysis, Experimental Investigations and Industrial Systems
118
Fig. 26. Response and recovery test for pulsed pressure at high frequency (Ko, 2009).
Fig. 27. Thermal stability test shows that the pressure signal is almost independent of
temperature variation in the system (Ko, 2009).
Microchannel Heat Transfer
119
7. Fabrication of microchannel integrated with arrays of miniaturized
pressure sensors and temperature sensors
The development and fabrication of a micro-flow heated channel for studies of local flow
and heat transfer process is very important not only for the basic research but also for
practical application in MEMS or NEMS thermal system. Unfortunately, most of the current
micro-channel used (Choondal and Suresk, 2000; Yu et al., 1995) or fabricated (Jiang et al.,
1999; Tao and Mahulikar, 1998; Chu et al., 1994) could not provide a local or detailed flow
and heat transfer information, but a global information (only for flow information at inlet
and outlet). How to prevent or control heat loss are the most important considerations for
heat transfer study. Most of the MEMS or NEMS techniques developed up to the present are
to use silicon wafer, a very good thermal conductor that has a very high thermal
conductivity (148 W/mK), as substrate to fabricate a microchannel (Pfahler et al., 1990;
Pfahler et al., 1991; Arkilic and Breuer, 1994; Arkilic and Schmidt, 1997; Shih et al., 1996; Qu
et al., 2000a and 2000b; Ren and Li, 2001; Ren et al., 2001a and 2001b). This will lead a large
amount of heat loss from the inside channel to the outside ambient, a uniform heat flux
boundary condition on the heated wall could not be maintained. Therefore, local heat
transfer information in the channel cannot be obtained and understood.
The idea to fabricate a suspended channel over an air layer (Wu et al., 1998) to reduce the
heat loss may be adopted to fabricate a heat transfer channel. However, this kind of channel
that has a very thin wall can be readily deformed by the high-pressure flow. This
deformation is expected to significantly affect the detailed flow and heat transfer process
inside the channel. In addition, the techniques involved in the fabrication are suitable for
fabrication with a very small height (in a few micrometers) channel.
The current work is to develop a novel fabrication procedure for a micro-channel system
that can be used to study and obtain the flow and the local heat transfer coefficient inside
the channel. One side of the channel wall can be heated uniformly and all the other
sidewalls can be well insulated. In the meantime, the heated wall is integrated with an array
of micro-temperature sensors and pressure sensors that can provide measurements of local
temperature and local pressure of the heated wall and study the local flow and heat transfer
process along the channel.
Initially, both the heater and the array of temperature sensors and pressure sensors that are
made of polysilicon layer doped with different concentration of boron are deposited on a
(100) silicon wafer by LPCVD. Then, an ultra thick SU-8 layer is spin coated on the substrate
and patterned into the active cavity of the pressure diaphragm. After SU-8 lithography
process, both the heater and the array of the sensor layers are moved to the surface of a low
thermal conductivity Pyrex glass. This was made by bonding the deposited silicon wafer
with the Pyrex glass to use a thick layer of epoxy resin. Then, the TMAH (25 wt%) solution
at 90
o
C was used to etch and completely remove the silicon wafer. The next step is to spin a
thick layer of SU-8 on the epoxy-glass substrate and form a micro-channel structure by
lithography. The last step is to bond the epoxy-glass substrate with a thick PMMA plate to
form a well-insulated and compact micro-channel. It is noted that both the SU-8 layer and
PMMA plate are the very low thermal conductivity materials, as shown in Table 2. Design
consideration and fabrication techniques involved in this processes will be discussed in the
following sections.
Heat Transfer - Theoretical Analysis, Experimental Investigations and Industrial Systems
120
7.1 Design consideration
In the design of a micro-channel for the current flow and heat transfer study, the most
important consideration is to reduce or control the amount of the heat loss from the channel
to the ambient and to provide a uniform heat flux input on the wall that can be readily
measured. To provide a uniform heat flux on the wall is not difficult. This can be achieved
by selecting a resistor material that is independent of the temperature and distributing the
resistor material uniformly on the channel wall. To pass a steady current through the
resistor, a uniform heat generation along the wall can be obtained. However, the heater may
have an uncontrollable heat loss at different locations such that the some of heat generated
in the heater may lose to the substrate and the real heat input into the channel flow is not
uniform. Thus, a uniform heat flux boundary condition on the wall cannot be obtained. In
addition, the thermal energy inside the channel flow may lose to the wall and subsequently
lose to the substrate if the wall is very conductive. Unfortunately, most of the MEMS
techniques developed up to the present use silicon wafer, a very good thermal conductor
that has a very high thermal conductivity, as a substrate to fabricate a micro-channel. These
difficulties make the measurements and analysis of the heat transfer inside a formidable
task. Chen et al. (2001) etched an air layer underneath the channel system to reduce the heat
loss. This air layer is thick enough to effectively reduce the heat loss. However, it makes the
heated wall very thin that the channel may distort itself during high-pressure gas or liquid
flowing through the channel. In addition, the channel fabricated is very complicated.
Although the design of using the air layer underneath the channel as insulation is a good
idea, the fabrication process is very complicated and difficult, and the yield of the
fabrication is very low.
Material
Thermal Conductivit
y
(W/mK) at 300K
Thermal Expansion Coefficient
(ppm/K) at 300K
Silicon 148 2.6
Al-Cu-Si alloy 161 19.2
Polysilicon 34 2.4
Silicon nitride 16 0.8
Silicon oxide 1.38 10.3
Pyrex glass 1.4 2.8
Epoxy resin 0.15 62.5
PMMA plate 0.16 62
SU-8 0.2*
52*
Air 0.026
Data can be found in data sheet for NATO
TM
SU-8 negative tone photoresists, formulations 50 and 100,
released by Micro Chem Corp.
Table 2. Thermal physical properties of the fabrication materials (Touloukian, 1970-1979).
In general, the heat input into the channel flow system can be moved away from the bottom
heated wall of the channel by the convective flow, i.e. air or water flow through the channel.
However, some portion of the heat input, i.e. the heat loss, can be moved away to the
ambient by the conduction of the substrate or the channel structure. In fact, most of heat loss
occurs by the substrate conduction, especially for a substrate with a higher thermal
conductivity. Thus, in order to effectively reduce the heat loss and maintain a uniform heat
Microchannel Heat Transfer
121
flux boundary condition on the heated wall, several alternatives can be selected. One can
use the thermal insulation materials on the back of the silicon substrate to reduce the heat
loss. In addition, to reduce the spanwise heat conduction along the substrate, the thickness
of the substrate can be reduced by mechanical polishing or particular wet etching
techniques. In addition, instead of using the air layer underneath the channel, one was
thinking of using other low thermal conductivity materials, such as Pyrex glass, as substrate.
However, by a careful calculation even the Pyrex glass could not provide enough thermal
insulation for both the channel and the heater. Other materials such as PMMA, polyimide or
epoxy resin that have a much lower thermal conductivity, as shown in Table 2, can be used
to avoid the heat loss from the heater to the ambient outside. An alternative insulation is to
move the devices above the silicon wafer onto the Pyrex glass. This requires bonding the
device with the Pyrex glass using epoxy resin, which is a low thermal conductivity material.
Therefore, the epoxy resin can be served as both the bonding agent and a part of the
substrate. This can significantly reduce both the normal and the spanwise conduction along
the substrate. A schematic diagram designed for the microchannel integrated with arrays of
micro pressure and temperature sensors is shown in Figure 29.
Fig. 28. Micro-channel system with arrangements of arrays of micro pressure sensors, micro
temperature sensors and two sets of heaters used for study of micro scale heat transfer and
pressure drop of the flow.
7.2 Fabrication process flow
The entire fabrication process, as shown in Figure 29, is described in the following:
1.
A 0.3 μm thick LPCVD tetraethoxysilane (TEOS) oxide is deposited on the (100) wafer
and used as protection mask for the upper layer devices during the later long period of
TMAH wet etch to completely remove the Si wafer.
2.
The temperature sensors were made by depositing a 0.3 μm thick LPCVD polysilicon
layer and then implanting with boron with a dose of 3×10
14
atoms/cm
2
. This amount of
dosage corresponds to a concentration of 10
19
atoms/cm
3
in the layer. After annealing at
950
o
C for 30 minutes to re-crystallize the polysilicon layer and to uniformly diffuse the
dopant ions across the layer, the doped polysilicon was patterned. The concentration of
10
19
atoms/cm
2
will give a linear relationship between the resistivity and the
temperature of the doped polysicon layer. Thus, after proper calibration, the doped
polysilicon layer can be used as temperature sensors.
Heat Transfer - Theoretical Analysis, Experimental Investigations and Industrial Systems
122
3. Next, after a deposition of a 0.3 μm thick LPCVD TEOS layer as insulation, a 0.3 μm
thick LPCVD polysilicon film is deposited and then implanted heavily with boron with
a dose of 3×10
15
atoms/cm
2
. This amount of dosage corresponds to a concentration of
10
20
atoms/cm
3
in the layer. After annealing at 950
o
C for 30 minutes, the doped
polysilicon is patterned as the pressure sensors.
4.
Before metallization, a 0.3 μm thick LPCVD TEOS oxide is deposited as insulation.
Then, contact holes were opened in this layer for metallization. The metallization was
made by sputtering standard IC four layers of metals, i.e. Ti/TiN/Al-Si-Cu/TiN with a
thickness of 0.04 µm/0.1 µm/0.9 µm/0.04 µm, respectively, onto the substrate surface.
The metal layers were then patterned into circuits, as shown in Figure 29 (a).
5.
A 9 μm thick SU-8 layer is spin coated on the substrate as the pressure sensing
diaphragm, as shown in Figure 29 (b). Then, a 50 μm thick SU-8 layer is coated again on
the substrate and patterned into the active cavity to allow for movement of the pressure
diaphragm. It is noted that there is a soft bake before layer exposure to evaporate the
solvent and a post exposure bake to make the edge between the exposed and
unexposed region more sharp and clear. Finally, instead of using the hard bake, a high
intensity of light is used to illuminate to complete the cross-linking of the resin since the
hard bake will need a temperature at 200
o
C that will damage the underneath thick
epoxy layer (refers to the epoxy layer mentioned in item 5 below). For the soft bake, the
SU-8 layer is first maintained at 65
o
C for 7 minutes with a 5
o
C/minute ramping rate
starting from room temperature, and then baked at 95
o
C for 15 minutes with a 5
o
C/minute ramping rate starting from 65
o
C to release the internal residual stress of SU-
8 thick layer. In fact, the success of the SU-8 channel strongly depends on the baking
process after light exposure.
6.
It is now ready to move the devices made on the Si wafer onto a low thermal
conductivity Pyrex glass. This is done first by bonding the silicon wafer with the Pyrex
glass, as shown in Figure 29 (c), using epoxy resin as the bonding agent. Since the epoxy
resin has a significantly lower thermal conductivity than the Pyrex glass, this can better
reduce the heat loss from the channel to the ambient.
7.
After the bonding process, the silicon substrate is ready for removal and cleared off.
This is done by a wet etch process. The silicon is etched with TMAH solution at 90
o
C
for 5-6 hours. Instead of using KOH, the selection of TMAH is attributed to its relatively
high selectivity for silicon versus oxide. This can avoid the sensors attacked by the
etchant during the long period of wet etch process since the protection layer of the
sensors are made of TEOS oxide. After successful movement of the pressure sensors
onto the Pyrex glass substrate, no distortion was found, as shown in Figure 29(d).
8.
Next, another SU-8 layer is spin coated on the epoxy-glass substrate at desired thickness
and patterned by lithography to form a rectangular microchannel and cavities of the
pressure sensors that connect with channel through narrow size tunnels. The side walls
of the channel, the narrow tunnels, or the cavities of the pressure sensors are
successfully made, as shown in Figures 30 (a), (b) and (c). It is noted that a similar post
exposure bake should be made in order to obtain a nice shape of channel and cavities of
the pressure sensor.
9.
A PMMA plate is then bonded, using epoxy resin, with the epoxy-glass substrate to
enclose the channel and the cavities, as shown in Figure 29 (e).
A picture for the completed channel is shown in Figure 30 (d).
Microchannel Heat Transfer
123
Epoxy layer
Silicon substrate
Dielectric layer (TEOS)
Sensors
SU-8 layer
Pyrex 7740 glass
Metal layer
PMMA plate
(a)
(b)
(c)
(d)
(e)
(d)
(e)
Fig. 29. Fabrication process for the entire microchannel system.
Heat Transfer - Theoretical Analysis, Experimental Investigations and Industrial Systems
124
Microchannel Heat Transfer
125
Fig. 30. SEM photographs of SU-8 channel integrated with arrays of micro pressure sensors:
(a) global view, (b) close view and (c) cross section view and (d) the completed
microchannel (Ko, 2009).
8. Local pressure drop and heat transfer characteristic inside a microchannel
8.1 Liquid flow characteristics
In order to compare with the experimental data, theoretical analysis of the flow
characteristic inside the microchannel is performed. Since the microchannel has very wide in
size as compared with the height, the microchannel flow can be assumed as parallel plate
channel flow. Since the microchannel flow can rapidly become fully developed, as indicated
in the later data measurement, the governing equation for fully developed flow in the
microchannel can be greatly simplified. The solution can be readily found as follows
(Incropera et al., 2007):
2
2
1
() ( )
22 2
y dp H dp dp
u
yyy
H
y
dx dx dx
μμ μ
=− = −
(8-1)
To integrate the equation transversely, the mean velocity of the flow in the channel can be
obtained as follows:
2
12
Hdp
U
dx
μ
=−
(8-2)
where U is the mean velocity of the flow. From Eq. (6-2), the longitudinal pressure
distribution can be found as follows:
2
12
xi
U
pp
x
H
μ
=−
(8-3)
(d)
Heat Transfer - Theoretical Analysis, Experimental Investigations and Industrial Systems
126
or
2
12 Ul
p
H
μ
Δ=
The Reynolds number here is defined as the liquid density times the mean velocity of the
flow and the hydraulic diameter (D
h
) of the rectangular channel divided by the dynamic
viscosity of the liquid as follows:
Re
h
UD
ρ
μ
= (8-4)
where
is ρ the density of the water. The friction factor of flow can be calculated with a given
pressure drop.
For the liquid flow, Qu et al. (2000, 2002) has found that the pressure drop in microchannel
is significantly higher than the theoretical analysis due to the roughness effect. To eliminate
the wall roughness effect, therefore, the roughness on the wall surface of the current micro-
channel is minimized, and is less than ± 5 nm to 15 nm. This roughness is negligibly small in
comparison with the height of the channel, which is either 68.2 μm or 23.7 μm. During the
experiment, the pressure distributions measured at different Reynolds numbers are
compared with the analysis, as shown in Figure 31(a) for the channel height at 34.7 μm. The
pressure drop of the water is found significantly higher than the prediction by Eq. (8-3). A
similar result was also found by Mala and Li (1998) who showed that the pressure drop of
water in micro-tubes is significantly higher than the analysis. Under the same flow rate and
tube diameter, the pressure drop in metal tubes is lower than in silica glass tubes. This can
be attributed to the electric surface potential in the channel which attracts counterions in the
liquid and causes formation of electric double layer on the wall. The thickness of the EDL in
the micro channel for these three different solutions can be estimated by the inverse of the
square root of the Debye-Huckel parameter (Mala et al. 1997) as follows:
1/2
22
()
2
ob
i
T
zen
ε
εκ
τ
∞
=
(8-5)
where ε is the dielectric constant of the solution and ε
o
is the permittivity of vacuum, κ
b
is
the Boltzmann constant, T is the absolute temperature, n
∞
and z
i
are the bulk concentration
and the valence of type i ions. Therefore, the EDL thickness is approximately 1 μm for water.
In order to minimize the EDL effect, the working fluid used is changed to KCl solution at
concentration of 10
-4
M or 10
-2
M, which can effectively remove the surface charges by the
metal ions in the solution and significantly reduce the thickness of EDL. The EDL thickness
is approximately 100 nm for the KCl solution with concentration of 10
-4
M and 1 nm for the
KCl solution with concentration of 10
-2
M. The result indicates, as shown in Figure 31(a), that
the pressure distribution for a higher KCl concentration (10
-2
M) is significantly lower than
for the pure DI water and is close to the analysis. It appears that the deviations for the
experimental data of water from the prediction are attributed to surface charges and the
EDL on the channel wall. The thicker the EDL, the greater is the deviation of the pressure
drop from the analysis. The current finding for the reduction of EDL thickness which makes
Microchannel Heat Transfer
127
the pressure drop in the microchannel approach to the analysis agrees with the results in
Ren et al. (2001). When the channel height increases to 68.2 μm, the pressure drops for the
case of the pure water and the cases of different concentrations of KCl solutions collapse
into a single line, as shown in Figure 31(b), and are closer but higher than the analysis. It
appears that the EDL of different fluids does not have a significant effect on the pressure
drop in a greater height of channel even though the EDL of different fluids on the wall has
different thickness.
For a large scale channel, the entrance region can be clearly identified by the non-linear
distribution of pressure distribution. However, in the entry region, no clear indication of
non-linear distribution of pressure can be found, as shown in Figure 31(a) or 31(b). For large
scale channel, the entry length can be estimated by the equation as follows Ren et al. (2001):
L
in
= 0.02 D
h
Re (8-6)
For the channel height at 68.2 μm and Reynolds number at 128, the hydrodynamic entry
length calculated from Eq. (8-6) is approximately 300 μm. However, pressure drop within
300 μm does not indicated greater or nonlinear variation, as shown in Figure 31(b). It shows
that the hydrodynamic entry region in microchannel is very short and could not be
identified from the current pressure distribution measurements. It appears that the
boundary layer in the entrance region of a microchannel develops very fast and becomes
fully developed very close to the entrance.
The same kinds of fluids are also performed in channels at the height of 23.7 μm. In the
channel at the height of 23.7 μm, more deviations of the pressure drop data for different
fluids occur, as shown in Figure 32(a) for pressure drop variation with the Reynolds
numbers in the fully developed region. The pressure drop for water flow has the largest
slop, and decreases when the concentration of KCl solution increases. These results clearly
indicate the effect on the thickness of EDL relative to the height of channel. For water flow
with a thicker EDL on the channel wall, the appearance of the EDL can increase the pressure
drops by 13.4 % in the smaller height of channel (23.7 μm), but increase only 8.6 % in the
greater height of channel (34.7 μm). For the channel height at 68.2 μm, all the pressure drop
variations with the Reynolds number for different fluids collapse into a single line, as shown
in Figure 32(b), and are closer but higher than the analysis. The higher pressure drop data
for different fluids than the prediction by Eq. (8-3) can be attributed to the aspect ratio effect
of the channel. The prediction by Eq. (8-3) is based on an analysis in a parallel plate channel,
while the current channel with channel height of 68.2 μm or 23.7 μm has an aspect ratio of
1:7.3 or 1:21, respectively.
From the definition of the friction factor,
2
2
1
2
2
wh
Dd
p
f
Udx
U
τ
ρ
ρ
== (8-7)
where D
h
is hydrodynamic diameter of the channel cross section and is equal to
2Hw/(H+w).
The product of friction factor, f, and the Reynolds number is defined as the Poiseuille
number (Po) (Baviere, 2004) and can be written as follows for parallel plate channel:
Heat Transfer - Theoretical Analysis, Experimental Investigations and Industrial Systems
128
Re 24Po f
=
= (8-8)
The parallel plate channel has an infinite width in z direction, the velocity is a two
dimensional parabolic profile. However, when the channel width in the z direction is finite
the velocity close to the side wall becomes three dimensional. The side wall effect can
produce greater pressure drop. The smaller the channel width in the z direction, the greater
the aspect ratio, the greater the pressure drop becomes. For large scale channel, the greater
Po value for channel with greater aspect ratios has been calculated and correlated in terms
of aspect ratio, α
as follows Baviere et al. (2004):
Po(α) = 24 (1 - 1.3553 α + 1.9467 α
2
- 1.7012 α
3
+ 0.9564 α
4
- 0.2537 α
5
) (8-9)
From Eqs. (8-7), (8-8) and (8-9) the pressure gradient can be re-calculated for the aspect ratio
less than 1:21, as shown in Figure 33(a) and Figure 33(b) indicated by the red dash line. The
pressure gradient predicted by Eq. (8-9) in the fully developed region agrees very well with
the data for working fluid at the much higher concentration of KCl or when channel height
is very large (68.2 μm) and EDL effect is negligible small. For clarity, the Po number for both
the data and the prediction by Eq. (8-8) has been plotted as shown in Figure 33. The
agreement between data and the prediction at channel height of 68.2 μm indicate that wall
roughness in the current channel has a negligible effect on the pressure drop. Even at a
smaller height of channel, 23.7 μm, the agreement between data at high concentration of KCl
with negligible effect of EDL and the prediction further indicates the negligible effect of the
wall roughness in the current channel.
In order to compare with the pressure drop data published in the literature, the normalized
friction constant which is most frequently used is adopted and written as follows.
exp
*
f
theor
y
Po
C
Po
=
(8-10)
where the friction constant Po
exp
is found from the product of Re with the measured friction
factor and Po
theory
is directly evaluated from Eq. (8-8). Large discrepancy among different
works can be found as shown in Figure 34(a) and Figure 34(b). The data selected here for
comparison are only limited to rectangular channels which have a channel height close to
the current channel. More detailed sizes of the channels and the materials the channels used
are also listed in the table underneath the figure. In general, the normalized friction
constants for all the work in the past are not only much greater than unity which is a
theoretical prediction for large scale channel, but also greater than the data of the current
work. This is attributed to the use of the inlet and outlet pressure to calculate the pressure
drop in the channel which is used to evaluate the friction constant. Most of the work in the
past can not obtain the pressure inside the channel, but measure the pressure outside the
channel at the inlet and outlet (Pfund et al., 2000; Xu et al., 2000; Papautsky et al.,1999; Peng
et al., 1995). Since there is large pressure loss for flow entering or exiting the channel, the
pressure drop measured outside the channel at the inlet and the outlet is much greater than
the actual pressure drop in the channel. Therefore, much greater friction constants obtained
from others are expected.
Microchannel Heat Transfer
129
Location (μm)
0 1000200030004000
Pressure (kPa)
0.0
34.5
69.0
103.4
137.9
172.4
206.9
Pure Water
KCl = 10
-4
M
KCl = 10
-2
M
Pure Water
KCl = 10
-4
M
KCl = 10
-2
M
Pure Water
KCl = 10
-4
M
KCl = 10
-2
M
Calculation
Re = 6.5
Re = 15.6
Re = 25
H = 34.7μm
Location (μm)
0 1000 2000 3000 4000
Pressure (kPa)
0.0
34.5
69.0
103.4
137.9
172.4
206.9
Pure Water
KCl = 10
-4
M
KCl = 10
-2
M
Pure Water
KCl = 10
-4
M
KCl = 10
-2
M
Pure Water
KCl = 10
-4
M
KCl = 10
-2
M
Calculation
Re = 30.4
Re = 80.7
Re = 128.5
H = 68.2μm
Fig. 31. Local pressure distributions at different Reynolds numbers in a micro-channel with
channel height of (a) 34.7 μm and (b) 68.2 μm (Ko, 2009).
Heat Transfer - Theoretical Analysis, Experimental Investigations and Industrial Systems
130
Fig. 32. Pressure drops at different Reynolds numbers in fully developed region a micro-
channel with (a) channel height of 23.7 μm and (b) channel height of 68.2 μm (Ko, 2009).
Microchannel Heat Transfer
131
Fig. 33. The Poiseuille numbers at different Reynolds numbers in a micro-channel with (a)
channel height of 68.2 μm and (b) channel height of 23.7 μm (Ko, 2009).
Heat Transfer - Theoretical Analysis, Experimental Investigations and Industrial Systems
132
References Channel Material
Working
Fluid
Height
(m)
Width
(m)
Aspect
Ratio
D
h
(m)
Peng et al. (1995) stainless steel Water 100 200 0.5 133
Pfund et al.(2000)
Polycarbonate-
Gasket-Polyimide
Water 263 10000 0.263 416.4
Xu et al. (2000) Glass-Silicon Water 43.7 415.3 0.106 79.08
Ren et al. (2001) Silicon
Water/K
Cl
40.5 5000 0.0081 80.34
Present work (Ko,
2009)
Polymer
Water/K
Cl
68.2 500 0.1364 120.02
Microchannel Heat Transfer
133
Reference
Channel
Material
Working
Fluid
Height
(m)
Width
(m)
Aspect
Ratio
D
h
(m)
Papautsky (1999) Nickel Water 24.65 600 0.0411 47.35
Papautsky-1(1999) Nickel Water 26.35 150 0.1757 44.82
Ren et al. (2001) Silicon
Water /
KCl
28.2 5000 0.0056 56.08
Present work
(
Ko, 2009
)
Polymer
Water /
KCl
23.7 500 0.0474 45.24
Fig. 34. (a) Comparison of the normalized friction constants between the current work and
the published results for current channel with (a) 68.2 μm in height and (b) 23.7 μm in
height.