Heat Transfer Theoretical Analysis Experimental Investigations and Industrial Systems part 9 pot
Bạn đang xem bản rút gọn của tài liệu. Xem và tải ngay bản đầy đủ của tài liệu tại đây (4.52 MB, 40 trang )
Heat Transfer - Theoretical Analysis, Experimental Investigations and Industrial Systems
310
advantages, from ease of installation and operation and efficiency of the process to the
variety of products that can be cooled in this type of equipments.
The selection of the best cooling method varies according to the desired application and
depends on several factors, including the cooling rate required, subsequent storage
conditions and costs of equipment and operation. Systems properly designed may increase
efficiency and reduce the cost of operation (Talbot & Chau, 1998; ASHRAE, 2002).
Talbot & Fletcher (1996) compared the efficiency between an air blast system and a storage
chamber. During the cooling process of grapes, there was a reduction of 6.7
o
C in one hour
and 14.6
o
C after 2.5 hours, compared to a decrease of only 2 °C in one hour and 3.5
o
C in 2.5
hours in the storage chamber. Experiments carried out using a prototype portable forced-air
device offered promising results (Barbin et al., 2009). The system was designed to be used
inside cooling and freezing chambers, aiming to improve heat flow rates.
2.4 Air flow
Cooling time by forced air systems is determined by airflow and product thermal load,
which affects the amount of energy to move the air around the product and inside the
system. The most common industrial applications use direct cold air insufflations inside the
system. The airflow varies according to the speed and amount of air flowing through
products and its variation results in longer or shorter freezing time. A correct orientation of
the air flow inside the equipment and around the product can significantly reduce
processing times (Cortbaoui et al., 2006). Surface area of contact between products and
cooling air and products arrangement are other parameters that affect forced air cooling
(Baird et al., 1988; Fraser, 1998; Laguerre et al., 2006).
In industrial plants, air flow is highly turbulent due to the fans movement and to wakes
originated from upstream obstacles. Resende & Silveira Jr. (2002b) showed that the air
velocity in forced air tunnels are strongly influenced by any changes in the amount of
product inside the system, causing the air to flow through preferential paths, leading to
increased freezing time and poor heat transfer coefficients. Results show that variations in
heat transfer coefficients may occur according to the product positioning inside the
equipment. Vigneault et al. (2005) studied how gravity influences air circulation in
horizontal air flow, showing that low levels of air flows may be more affected, causing
temperature variation of the cooling air and reducing the flow to the upper chamber. This
could be an important parameter to consider when designing cooling and freezing systems.
Exhausting air is more appropriate to avoid air to flow through preferential corridors,
leading to more uniform heat exchange when compared to insufflations processes (Fraser,
1998).
Conventional cooling methods by forced air are an efficient alternative to removing the heat
load of fruits and vegetables during post-harvest cooling. Air exhaustion is widely used for
this purpose, as it improves the air distribution in the products surrounding. This system is
usually used inside cooling chambers. With the fan in operation, it creates a low pressure
region surrounding the products. The cooling air flows through this region between the
small opening areas, reducing the product temperature (Talbot & Fletcher, 1996; Talbot &
Chau, 1998; Fraser, 1998; Abrahao, 2008). The possibility of adapting a cold room for use as a
system for forced air represents an economical advantage of this process (Talbot & Fletcher,
1996).
Baird et al. (1988) showed that the velocity of cooling air influences directly the operational
cost of cooling systems, as it can change with the increase of air velocity in the system. The
Comparison of the Effects of Air Flow and Product Arrangement on Freezing Process
by Convective Heat Transfer Coefficient Measurement
311
lowest costs were obtained with air velocities between 0.1 and 0.3 m/s. To study the cooling
of plastic balls filled with a solution of carrageen, Allais et al. (2006) showed that increasing
the speed of air flow, ranging from 0.25 m/s to 6 m/s, reduced the half-time cooling of
samples from 800 s to 500 s. But this variation is exponential, and the reduction tends to be
smaller from speed of 2 m/s. Results obtained by Vigneault et al. (2004a, b) for cooling
process using forced air show that air flows above 2 l/s.kg and air velocities of insufflations
higher than 0.5 m/s cause no influence on half-cooling time of the samples.
2.5 Instruments and methods for measurement of air flow velocity
There are several methods for measuring air flow velocity described in the literature, with
different principles, and the accuracy of the sensors used in each of these techniques varies
significantly, making them suitable for particular applications. Hot-wire anemometer is one
of the most used instruments because of its wide applicability. Due to the small size and
short response time, these instruments are suitable for detailed study of fluid flow, and are
commonly used to measure the air flow in ventilation systems and air conditioning. The
hot-wire anemometer measures the instantaneous velocity of fluids.
The core of the anemometer is an exposed very fine hot wire heated by a constant current up
to some temperature above ambient. Air flowing past the wire has a cooling effect on the
wire. By measuring the change in wire temperature under constant current, a relationship
can be obtained between the resistance of the wire and the fluid flow velocity, as the
electrical resistance of most metals is dependent upon the temperature of the metal. This
kind of instrument has a fine spatial resolution compared to other measurement methods,
and as such is employed for the detailed study of turbulent flows, or when rapid velocity
fluctuations are of interest.
Resende & Silveira Jr. (2002b) and Nunes et al. (2003) suggest that several measurements in
the cross-section of the air flow could lead to a more accurate determination of the air
velocity. The average velocity is therefore used for determination of the air flow in the
selected position, according to (3):
S
V vdS=
∫
(3)
In this equation, V is the flow (m
3
/s), S is the total area (m
2
) and v is the velocity vector (m/s).
2.6 Packaging and storage
Packaging affects the heat transfer coefficients of food items in several ways. It is a barrier to
the transfer of energy from the food by acting as insulation to the food item, thus lowering
the heat transfer coefficient. Packaging may also create air-filled voids and bubbles around
the food item which further insulates the food and lowers the heat transfer coefficient
(Becker and Fricke, 2004). Results presented by Santos et al. (2008) showed that freezing
process of meat in cardboard boxes is underrated and the processing time sometimes is not
enough for all the samples to reach the desired temperature. Replacing cardboard boxes by
metal perforated boxes produced a reduction of up to 45% at the freezing time for this
product.
Becker and Fricke (2004) developed an iterative algorithm to estimate the surface heat
transfer coefficients of irregularly shaped food items based upon their cooling curves,
considering the density of the food item and the packaging. This algorithm extends to
Heat Transfer - Theoretical Analysis, Experimental Investigations and Industrial Systems
312
irregularly shaped food items existing techniques for the calculation of the surface heat
transfer coefficient previously applicable to only regularly shaped food items, taking into
account the concept of equivalent heat transfer dimensionality. In this method, the density
used to calculate the heat transfer coefficient is affected by the packaging, as it is calculated
from the mass of the food item plus the packaging and the outside dimensions of the
package around the food item, generating results for the heat transfer coefficient for the food
within its packaging.
An important parameter for improved performance of an air blast cooling system is the
apertures and gaps that the packages and pallets must have to allow the circulation of the
cold air through the packed product in order to achieve rapid and uniform heat transfer
between the cooling air and the product (Vigneault et al. 2004a; Zou et al., 2006a, b).
Results obtained by Talbot & Fletcher (1996) and Abrahao (2008) showed the importance of
proper cooling system design, proving that the larger the opening area in the packaging, the
lower the requirement on refrigeration and air circulation systems to obtain a more uniform
cooling rate. Meana et al. (2005) showed that the empty regions between the plastic
containers that are used in the cooling of strawberries by forced air influence significantly
the cooling time of the products. According to Baird et al. (1988), opening areas smaller than
10% of the total area of the box can significantly increase the cost of cooling processes.
Castro et al. (2003) suggest that an opening area of 14% is appropriate for a rapid and
uniform cooling process.
Large opening areas can lead to poorly designed boxes that are not suitable for industrial
processing. The main goal is to get an optimal opening area of the boxes to enable a low
freezing time without, however, affecting the mechanical structure of boxes.
2.7 Convective heat transfer coefficients (h
c
)
Convective heat transfer is related to the amount of energy transferred from the product
surface when it is in contact with the refrigerating fluid (Welty et al, 2000). Dincer (1995a)
determined the experimental heat transfer coefficient with data obtained during forced air
cooling of figs in air blast systems, with results varying from 21.1 to 32.1 Wm
-2
°C
-1
for air
velocities of 1.1 to 2.5 ms
-1
.
Experiments carried out in a forced air room with air velocities in the range of 1 to 2 ms
-1
resulted in h
c
values varying from 28 Wm
-2
°C
-1
up to 52 Wm
-2
°C
-1
for cylindrical products
(cucumber) during cooling (Dincer and Genceli, 1994). Mohsenin (1980) obtained h
c
values
in the range of 20 to 35 Wm
-2
°C
-1
for forced air systems with air velocity from 1.5 to 5.0 ms
-1
.
Dussán Sarria et al. (2006) studied the influence of the air velocity in a cooling tunnel.
According to the authors, air velocities greater than 2.0 ms
-1
did not affect the convective
coefficients (h
c
), as results obtained were not greater than 23.8 Wm
-2o
C
-1.
Considering the complexity of freezing processes and the recent results presented, many
parameters influence the experimental results for heat transfer coefficients, thus varying
according to the flow characteristics of the cooling medium and the products involved.
Accurate descriptions of the boundary conditions are rather difficult for industrial air blast
systems, and software solutions such as CFD will not be effective in solving the momentum
and heat transport equation without precise information (Mohamed, 2008). Regarding the
wide range of convective heat transfer coefficients (h
c
) reported, it is important to calculate
this coefficient in order to understand different operating conditions of distinct cooling
systems and compare to any new systems developed. Several methods for convective heat
Comparison of the Effects of Air Flow and Product Arrangement on Freezing Process
by Convective Heat Transfer Coefficient Measurement
313
transfer measurements are reported. The most common are those involving temperature
measurements in permanent and transient state (Cleland, 1990).
2.7.1 Temperature measurements in steady state
In this method, a constant thermal load is created in the system such as an electrical heating
probe, for example. The coefficient of heat transfer can be calculated using the values of the
surface area of the heating probe, the amount of energy added and the temperatures of the
cooling medium and the probe. However, the temperature and velocity of the cooling
medium should be kept constant, which is not an easy task in experimental conditions,
limiting the use of this method.
2.7.2 Temperature measurements in transient state
Temperature measurement in transient state consists of a metallic test body with a known
high thermal conductivity being used to minimize the temperature gradient during the heat
exchange between the cooling medium and the product (Bi<0.1), allowing the test body to
have an almost uniform temperature during the cooling process. When the internal
resistance of the test body to heat transfer is neglected, an energy balance conducts to the
convective heat transfer coefficient. By Newton's cooling law, the rate of heat transfer in a
given volume of control is given by equation 1.
The variation of energy in a metal body with constant properties is given by the equation:
mpm
dQ dT
Vc
dt dt
ρ
=
(4)
where ρ
m is the density, V is the volume and cpm is the specific heat of the metallic body,
respectively. Combining equations 1 and 4, integrating and adopting the initial boundary
condition T (t = 0) = T
i
, leads to the solution for the temperature variation as a function of time:
hcAt
c
mpmV
b
i
TT
e
TT
ρ
−
∞
∞
−
=
−
(5)
Equation 5 proves that the cooling process has an exponential behaviour, as verified by
several authors for horticultural products (Mohsenin, 1980; Dincer, 1995a).
In practice, this method consists of using a test body made of some material with high
thermal conductivity, so that tests are carried out without phase change and assuming the
constant thermal properties within temperature variation range. Le Blanc et al. (1990a, b),
Resende et al. (2002), Mohamed (2008) and Barbin et al. (2010) reported experiments using
the described method for obtaining convective coefficients from the cooling curves obtained
for a metallic test body, indicating the capability of the present method in handling complex
boundary situation such as encountered in industrial systems. Results for convective heat
transfer coefficients were reported by Barbin et al. (2010), comparing two air flow direction
in the same equipment, concluding that this is a useful method for studying temperature
reduction processes.
According to Resende et al. (2002), some points arise when using this method. If the test body
consists of a metal block, there may be heat transfer through the edges of the material,
affecting the values of h
c
calculated. Furthermore, condensation can occur in experiments with
cooling air, causing changes to the measurements. Thus, the positioning of the test body must
Heat Transfer - Theoretical Analysis, Experimental Investigations and Industrial Systems
314
be carefully chosen in order to prevent any condensation of water during the tests, and the
edges of the body or other parts that may interfere with the temperature measurements during
the process must be perfectly insulated to avoid heat transfer through these regions.
3. Experiments
3.1 Samples for simulation of thermal load
Food model system with 15% (weight / weight of solution) of sucrose and 0.5% (weight /
weight of solution) of carboxyl-methyl cellulose (Carbocel AM, Arinos, SP, Brazil) was
packed in polyethylene bags (0.1 kg) with similar dimensions (0.095 m x 0.07 m x 0.015 m) to
pulp fruit products in the market. The samples were stored in 35 plastic boxes (Figure 1a),
with external dimensions of 0.6 m x 0.4 m x 0.12 m, which were stacked on a commercial
pallet (1.00 m x 1.20 m, Figure 1b) and kept inside the freezing room. The boxes had an
opening area of 21% of the total area, accounting for more than the minimum values
recommended for proper air flow (Castro et al., 2003).
(a) (b)
Fig. 1. (a) Plastic box for freezing products; (b) Commercial pallet
3.2 Product arrangement
Two arranges of samples were tested to determine the influence of opening areas to the
refrigeration process. Using the industrial arrangement of samples, ninety six packages of
sample were allocated in each box, in three layers (top, middle and bottom), with thirty two
packs in each layer, corresponding to about 9.6 kg of product, similar to the amount used in
the industrial process. This assembly is shown in Figure 2 (Arrangement 1). The boxes were
piled in six layers with five boxes per layer, totalling thirty boxes, simulating a commercial
assembly of a pallet used regularly in the process (Figure 3, Arrangement 1).
A second distribution of packages inside the boxes was tested, with larger distance between
the packages inside the boxes in order to improve the circulation of air around the samples.
In this assembly, eighty four packs of sample were allocated in each box, within five layers
three layers with twenty units, and two layers of twelve units, distanced from each other for
air circulation, totaling 8.4 kg of product per box.
Figure 2 (Arrangement 2) shows the new distribution of packaging inside the boxes. The
second arrangement had a smaller amount of samples in each box. Hence, it was added
another layer of boxes in the system in order to have the same amount of product and the
same thermal load for all the tests (Figure 3, Arrangement 2).
Comparison of the Effects of Air Flow and Product Arrangement on Freezing Process
by Convective Heat Transfer Coefficient Measurement
315
Fig. 2. Schematic diagram for sample distribution used for packaging boxes.
Fig. 3. Pallet with boxes and layers that were monitored
3.3 Temperature measurement
Insufflations and exhaustion air tests were run in triplicate. The velocity of the cooling air
was measured for comparison with the convective coefficients. Three layers of boxes had its
temperature monitored until the centre of the samples reached -18ºC. Each of the monitored
layers had four thermocouples in the corners of the layers and one in the middle, as shown
in Figure 4. The thermocouples were inserted inside the samples in the plastic bags to
measure the samples temperatures variation during the freezing process.
The monitoring system used for temperature acquisition is composed by an automatic
channel selector system (Scanner 706, Keithley Instruments Inc.). Samples temperatures
were monitored using T-type thermocouples (copper–constantan). The thermocouples were
calibrated using a controlled temperature bath with a propylene glycol solution and a
standard thermometer as reference. Five different temperature values were chosen (-19
o
C, -
10
o
C, 0
o
C, 10
o
C and 20
o
C). The average temperatures measured in the water bath (10
measurements for each one of the five different chosen values) were plotted against the
corresponding thermocouple (mV) values (ASTM, 1989). The difference for the correlation
coefficient of the curve-fitted line (R
2
) were not lower than 0.99.
Heat Transfer - Theoretical Analysis, Experimental Investigations and Industrial Systems
316
Fig. 4. Samples monitored in the layers of boxes
3.4 Portable forced air system
The forced air system was designed as described in Barbin et al. (2009), with a plastic sheet
cover connected to a flexible duct and a fan that insufflates or exhausts the air inside the
system. The plastic covers the boxes that contain the product, stacked on a commercial
pallet. The portable tunnel fan used has axial airscrews with a tri-phase induction engine
(Weg, Brazil, model 71586, 0.5 hp). The device was placed inside a freezing storage room
(Recrusul, Brazil), with internal dimensions of 3 m x 3 m x 2.3 m (20.7m
3
) and walls made of
0.01 m aluminium panels filled with expanded polystyrene as insulation.
The cooling process consists in circulating the internal air of the storage room through the
boxes open spaces and around the product samples. In the exhaustion process, the system is
connected to the fan suction, and the air flows from the lower part of the system to inside
the boxes and through the fan back to the room. In the insufflations processes, the airflow is
changed, blowing the cooling air from the room directly to the product. The forced air
circulation is vertically oriented in both the exhaustion and the insufflations process. During
exhaustion, it goes from the bottom to the top of the pallet; while in the blowing process, it
goes from top to bottom (Figure 5).
3.5 Air flow measurement
A hot-wire anemometer (Tri-Sense, model EW-37000-00, Cole-Parmer Instrument Company,
IL, USA) was used for measurements of air velocity. The sensor was inserted through
openings in the air diffuser for measuring air velocity in different positions of the area
normal to the air flow. The measurement points were aligned and positioned at regular
distances. The sensor was introduced for measuring the air speed with different depth of
insertion, providing fixed points in the surface area perpendicular to the airflow.
Comparison of the Effects of Air Flow and Product Arrangement on Freezing Process
by Convective Heat Transfer Coefficient Measurement
317
Fig. 5. Portable tunnel with boxes stacked on a commercial transport pallet covered with
plastic, and air flow orientation during the exhaustion and insufflations processes.
Fig. 6. Surface area for air velocity measurements during insufflations and exhaustion
processes.
Heat Transfer - Theoretical Analysis, Experimental Investigations and Industrial Systems
318
Velocities were measured for comparison between the exhaustion and insufflations with the
fan operating at steady state and no obstructions to the air flow. In this study, the area that
the air flows through is a cross-section of the pallet represented by the five boxes. The
greater the number of velocity measurements, the more accurate the result of air flow. Thus
the new equation for calculating the flow in the tunnel is:
11
00
(,)
xy
xy
V v x y dydx=
∫∫
(6)
where x and y represent the coordinates of the cross-section perpendicular to the air flowing
stream, comprising the dimensions of the surface formed by the boxes from the pallet.
Common approach is to measure the air velocities in several points of the flow and obtain
one average result, for a more consistent representation of the profile of the flow and avoid
the high variability of measurements.
3.6 Convective heat transfer measurement
The experiments for determining the convective heat transfer coefficients during freezing
processes were carried out according to procedures described by Le Blanc et al. (1990a, b) and
Resende et al. (2002), using a specimen of high thermal conductivity metal. The method
consisted of measuring the temperature variation of a test body with high thermal
conductivity during cooling. The high conductivity is necessary to minimize the temperature
gradient formed during the heat transfer process between the sample and the cooling medium.
The test body shown in Figure 4a is an aluminium brick with known dimensions (0.10 m x
0.07 m x 0.025 m), with perforations for insertion of thermocouples for temperature
measurement. Empty spaces around the thermocouples were filled with thermal paste to
prevent formation of air pockets within the holes that could affect the measurements.
Aluminium thermo physical properties (as a metallic test body) used for the determination
of the convective heat transfer coefficients at 20
o
C are: density (ρ
Al
=2701.1 kgm
-3
), specific
heat (C
pAl
=938.3 Jkg
-1
o
C
-1
), thermal conductivity( k
Al
=229 Wm
-1 o
C
-1
) (Welty et al., 2000).
(a) (b)
Fig. 7. (a) Aluminium test body insulation and (b) positioning inside the box.
Comparison of the Effects of Air Flow and Product Arrangement on Freezing Process
by Convective Heat Transfer Coefficient Measurement
319
Regarding heat flow analysis, polystyrene was used as insulation around the test body to
keep only one surface exposed in contact with the cooling air. The test body had all of its
edges insulated, except the upper face which was kept exposed to the cold air flow (Figure
4). This procedure was adopted to avoid edge effects and generate a one-dimensional heat
flow. The test bodies were assembled inside the boxes and over the packages of samples, as
shown in Figure 4b.
The fast cooling curve can be described by Equation 7, which is a simplification of Equation 6:
2
()
()
St
i
TT
e
TT
∞
∞
−
=
−
(7)
where T is the average value obtained from three thermocouple temperature measurements
inside the test body during the cooling process, T
i
is the initial temperature of the aluminium
plate and T
∞
is the cooling medium temperature. The S
2
parameter represents the cooling
coefficient, defined as the test body temperature change per time for each temperature degree
difference between the product and the cooling medium, and is expressed in s
-1
.
The values of S
2
were used for the calculation of the heat transfer coefficients for the period
of sensible heat removal of the samples during the cooling process, as Equation 8:
2
mpm
c
Vc
hS
A
ρ
−
=
(8)
Values for the average dimensionless temperature [(T – T1)/ (Ti – T1)] logarithm were
calculated for every test body monitored during chilling period, with values obtained
plotted versus cooling time. The angular coefficients (S
2
) were calculated from these graphs.
Convective heat transfer coefficients were obtained according to Equation 8, using
temperature measurements of the 5 identified (T1 to T5) aluminium test bodies, distributed
in layers 1, 3, 4, 5 and 6, respectively, including both the extreme layers (1 and 7) and the
central layers (3, 4 and 5) (Barbin et al., 2010). With the new arrangement of samples inside
the boxes, one layer of boxes was added to the pallet, namely layer number 7. In this new
arrangement, the layer number 6 was not monitored. All the aluminium test bodies were
positioned over the samples in the centre of the boxes along with the thermocouples
identified with number 5 as last algorism (15, 35, 45, 55 and 75, Figure 3) and in contact with
the cooling air (Figure 4b). Only the second layer in the first arrangement, and both second
and sixth layers in the second arrangement, did not have a test body. The main objective
was to analyze the air circulation in the central layers in comparison to the top and bottom
layers, and to determine the local convection coefficient of heat transfer. After obtaining S
2
values (according to equation 7), the effective heat transfer coefficients were calculated for
the samples in the sensible heat loss phase, as shown in Equation 8.
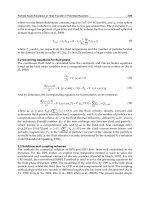
4. Experimental results
4.1 Determination of air flow velocity
The air flow in the region surrounding the product was investigated and results were
previously reported by Barbin et al. (2009). These results are reproduced here for
comparison with the heat transfer coefficients. Flow direction and turbulence intensity are
generally not accurately known in practical situations. Furthermore, impending variation of
heat transfer coefficient value for a product of certain size is primarily dependent on airflow
Heat Transfer - Theoretical Analysis, Experimental Investigations and Industrial Systems
320
(a) (b)
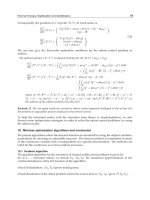
Fig. 8. Results for air flow velocity obtained in the product surface for: (a) insufflation
process, and (b) exhaustion process.
properties such as velocity and turbulence, and less affected by product shape and direction
into the flow. Due to high turbulence of air flow in industrial applications, wind tunnel
experiments are not useful to determine heat transfer values (Kondjoyan, 2006); hence, the
importance in studying the airflow behaviour for the experiments.
The graphs shown in Figure 8 illustrate the results of measurements of air velocity for each
process (Barbin et al., 2009). Figure 8a shows the experimental values for the air velocities
measured during the process of insufflations, while Figure 8b shows the results for the
exhaustion process. The dimensions x (m) and y (m) represent the surface area
perpendicular to the air flow, where velocities were measured. The vertical axis shows the
velocity results (m/s), containing a response surface for visualization of the airflow.
High values for the air velocity were observed in the insufflation process, reaching above 15
m/s in the central region of measurement, while in the edge and corner positions the
velocity results are lower, ranging between 1 and 2 m/s. This difference or lack of
uniformity in this distribution of velocities is not observed in the exhaustion process, as it
can be seen in Figure 5. This phenomenon may be consequence of the fact that the
exhaustion is performed more uniformly, causing the distribution and movement of air to
be more even inside the tunnel. Another reason could be that the air had not enough space
to expand properly along the short region between the duct exit and the uppermost layer of
samples. This makes it a difficult task to overcome because it needs more space for the
system according to the appropriate technique for the design of air blast systems (ASHRAE,
1977). However, given the dimensions of the chamber and set of boxes with the product, the
assembly was done with the maximum extension possible to fit inside the cold room.
Another factor that may cause interference measures in this place of assembly is that the
anemometer does not indicate the direction of air flow during the measurements. Table 1
shows the values obtained and the average velocity of air flow calculated for each flow.
Test Average air velocity
(m/s) Air flow (m
3
/s.kg)
Insufflation - 3.05 ± 0.2 3.7 x 10
-3
Exhaustion 1.88 ± 0.2 2.3 x 10
-3
Table 1. Average values obtained for air velocity and air flow during insufflation and
exhaustion processes.
Comparison of the Effects of Air Flow and Product Arrangement on Freezing Process
by Convective Heat Transfer Coefficient Measurement
321
The negative sign for the value of the inflation rate represents the direction of flow opposite
to the exhaustion, as the z axis of the graph shown in Figure 8, and it did not affect air flow
calculations, since the absolute values of air velocity were used for both cases.
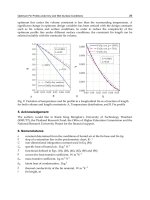
4.2 Freezing time
A freezing process without the portable tunnel was carried out as a reference test to be
compared to the experiments using the tunnel device. This reference freezing process
consisted in leaving the boxes inside the cold room until all of the samples reached the final
freezing temperature.
The average freezing time for the pallet with the industrial sample arrangement was 47
hours, for the reference test, without the use of the portable tunnel. It was also observed the
lack of uniformity of process during the freezing process, where the samples located in the
upper and lower layers reached -18 ° C in about 42 hours, while it took more than 52 hours
for all the samples in the central layer to reach the final freezing temperature.
The top layer of boxes (layer 6) was quickly frozen in the insufflation test, as all the samples
reached -18 ° C after 35 hours. The samples in the bottom and middle layers were frozen
after about 45 hours, showing that the cooling air was not flowing properly in the bottom
part of the pallet.
Fig. 9. Comparison of freezing time between two arrangements of samples for insufflation
and exhaustion processes.
During the exhaustion test it was observed a difference for the freezing time between the
central and peripheral layers of about 1 to 2 hours; however, all samples reached the
temperature of -18o C after 40 hours of processing.
Regarding the new arrangement of samples, the freezing time for the exhaustion process
was 38 hours. It took 43 hours for the samples to be frozen in the insufflation process. The
comparison between the freezing time for industrial and new arrangement can be seen in
Figure 9.
The heat transfer analysis comparing the air distribution performed shows that, although
showing values around 2 m/s for air velocity results, the exhaustion process reduced up to
14% of the freezing time compared to the blowing system, where air velocity were up to
19m/s.
The top layer of the assembly showed an increase in freezing time for the new configuration
of the samples for the testing of inflation (Figure 9). This may have occurred because the
Heat Transfer - Theoretical Analysis, Experimental Investigations and Industrial Systems
322
industrial configuration might block air circulation for the other layers, reducing the
efficiency of heat exchange between air and the other layers of product assembly.
4.3 Convective heat transfer coefficients
The lumped-capacitance method was applied to obtain the heat transfer coefficients for
comparison between two different arrangements of products inside the cold chamber.
Results of Table 2 show that there is an increase in the convective coefficient for the all the
layers of boxes in the pallet, except the test body number 4, located on the second layer from
the top.
In the insufflation process for the industrial arrangement, the results were in the range from
3 to 6 W/m
2o
C for the three lower layers increasing to 15 W/m
2o
C for the test body 4 and
reaching 30 W/m
2o
C the top layer. The values for the new proposed arrangement reached
10 W/m
2o
C for the first two bodies and were greater than 30 W/m
2o
C the top layer.
In the exhaustion process, results were nearly twice as high as the industrial process for the
first two test bodies. The top layer had also higher values compared to the industrial
arrange. For the central layer, results were similar, around 10 W/m
2o
C. Only the test body in
the second layer from the top showed higher results for the industrial arrange. Thus, results
show that enlarging opening space for air flow increases the convective heat transfer, even if
there is more product or layers in the pallet.
Convective coefficient (W/m
2
ºC)
Exhaustion Insufflation
Test body Arrangement 1 Arrangement 2 Arrangement 1 Arrangement 2
T1 lower 5.79 10.74 3.58 9.90
T2 5.25 12.88 6.13 9.92
T3 middle 10.41 10.76 5.77 6.38
T4 14.97 11.06 15.41 13.04
T5 upper 5.92 7.73 29.46 31.72
Table 2. Results for convective coefficient measured between two arrangements of samples
in the boxes and two different air flow orientation
The variability of the heat transfer coefficients with position inside a refrigerated room is a
crucial aspect to be considered as this will directly affect cooling time. Considering that
energy costs are the major expense associated with most refrigerated warehouses, this
becomes critical to the managerial decisions, spanning from the initial investment to the
long term running costs.
5. Conclusion
This study was initiated to resolve deficiencies in temperature reduction processes by
investigating the convective heat transfer coefficient data for food cooling and freezing
processes, endeavouring to assist the food refrigeration industry to improve heat transfer
process efficiency with uncomplicated solutions. A literature examination was conducted to
collect support information and compare with the results obtained.
Results have shown that increasing the cooling air velocity inside the system, or using more
powerful equipments to introduce cooling air with lower temperatures is not the best way
Comparison of the Effects of Air Flow and Product Arrangement on Freezing Process
by Convective Heat Transfer Coefficient Measurement
323
to improve cooling rates. Improved results can be achieved by applying simple changes to
the process, such as rearranging the product or samples to be cooled or frozen and changing
the direction of cooling air to flow around the product can save some time in freezing
processes. On the other hand, the determination of convective heat transfer coefficient can
help to determine how the cooling air is working on some specific region of the system or
samples, leading to more precise ways to improve the cooling process.
The experimental data resulting from this project will be used by designers of cooling and
freezing systems for foods. This information will make possible a more accurate
determination of convective heat transfer coefficients inside these equipments, leading to
more efficient systems and reduction in cooling and freezing times. Such information is
essential in the venture and operation of cooling and freezing facilities and will be of
immediate usefulness to engineers involved in the design and manoeuvre of such systems.
Taking the above into consideration and incorporating these factors to the equipment’s
design will have a significant impact on energy savings.
6. References
Abrahao, R. F.; Correia, E.; Teruel, B. J. (2008). Computational simulation for the
development of packages for bananas [Simulação computacional aplicada ao
desenvolvimento de embalagens para bananas]. Revista Brasileira de Fruticultura,
30 (1). p. 79-87.
Allais, I.; Alvarez, G.; Flick, D. (2006). Modeling cooling kinetics of spheres during mist
chilling.
Journal of Food Engineering. V. 72, p. 197-209.
ASHRAE Handbook.
Fundamentals. (1977) Atlanta, Georgia: American Society of Heating,
Refrigerating and Air Conditioning Engineers, Inc. 1977.
ASHRAE. Refrigeration. (2002). Atlanta, Georgia: American Society of Heating, Refrigerating
and Air Conditioning Engineers, Inc. 2002.
ASTM. (1989).
Manual on the use of thermocouples in temperature measurement. American
society for testing and materials.
Baird, C. D.; Gaffney, J. J.; Talbot, M. T. (1988). Design criteria for efficient and cost effective
forced air cooling systems for fruits and vegetables.
ASHRAE Transactions, Atlanta,
v.94, p.1434-1453.
Barbin, D. F.; Neves Filho, L. C.; SIlveira Junior, V. (2009). Processo de congelamento em
túnel portátil com convecção forçada por exaustão e insuflação para paletes.
[Freezing process evaluation using a portable forced air system with air evacuation
and air blowing in pallets].
Ciencia e Tecnologia de Alimentos, 29, (3), p.1-9.
Barbin, D. F.; Neves Filho, L. C.; Silveira Junior, V. (2010). Convective heat transfer
coefficients evaluation for a portable forced air tunnel.
Applied Thermal Engineering,
30. p.229–233.
Becker, B. R.; Fricke, B. A. (1999). Food thermophysical property models.
International
Communications in Heat and Mass Transfer
, v.26, n.5, p.627-636.
Becker, B. R.; Fricke, B. A. (2004). Heat transfer coefficients for forced-air cooling and
freezing of selected foods.
International Journal of Refrigeration, v. 27, (5). p. 540-551.
Castro, L. R.; Vigneault, C.; Cortez, L. A. B. (2003). Container opening design for
horticultural produce cooling efficiency.
International Journal of Food Agriculture and
Environment
, v.2, n.1, p.135-140.
Heat Transfer - Theoretical Analysis, Experimental Investigations and Industrial Systems
324
Chourot, J. M.; Macchi, H.; Fournaison, L.; Guilpart, J. (2003). Technical and economical
model for the freezing cost comparison of immersion, cryomechanical and air blast
freezing processes.
Energy Conversion and Management, n.44, p.559-571.
Cleland, A. C. (1990).
Food Refrigeration Process. Analysis, Design and Simulation. Elsevier
Applied Science. London and New York. 1990. 284p.
Cortbaoui, P.; Goyette, B.; Gariepy, Y.; Charles, M. T.; Raghavan, V. G. S.; Vigneault, C.
(2006). Forced air cooling system for Zea mays.
Journal of Food Agriculture and
Environment
. V. 4, p. 100-104.
Dincer, I. (1995a). Thermal cooling data for figs exposed to air cooling.
International
Communications Heat Mass Transfer
. v.22, n.4. p.559-566.
Dincer, I. (1995b). Transient heat transfer analysis in air cooling of individual spherical
products
. Journal of Food Engineering, v. 26, p. 453-467.
Dincer, I.; Genceli, F. (1994). Cooling process and heat transfer parameters of cylindrical
products cooled both in water and air. International Journal Heat Transfer, v. 37, n.
4, p. 625-633.
Dussán Sarria, S.; Honório, S.L.; Nogueira, D.H. (2006). Precooling parameters of 'Roxo de
Valinhos' figs (Ficus carica L.) packed in a carton box.
Fruits. v. 61, Issue 6, Nov.
2006, p 401-406.
Fraser, H. (1998). Tunnel Forced-Air Coolers for Fresh Fruits & Vegetables. Ministry of
Agriculture, Food and Rural Affairs, Government of Ontario, Canada, 1998.
Available: <
Heldman, D.R. Food Freezing. In: Heldman, D. R.; Lund, D. B.
Handbook of Food Engineering.
New York: Dekker, 1992. 277-315.
Kondjoyan, A. (2006). A review on surface heat and mass transfer coefficients during air
chilling and storage of food products.
International Journal of Refrigeration, v.29,
p.863–875.
Laguerre, O.; Ben Amara, S.; Flick, D. Heat transfer between wall and packed bed crossed by
low velocity airflow.
Applied Thermal Engineering, v. 26, p. 1951-1960, 2006.
Le Blanc, D. I.; Kok, R.; Timbers, G. E. (1990a). Freezing of a parallelepiped food product.
Part 1: Experimental determination. International Journal of Refrigeration, v.13, p.371-
378.
Le Blanc, D. I.; Kok, R.; Timbers, G. E. (1990b). Freezing of a parallelepiped food product.
Part 2: Comparison of Experimental and Calculated Results.
International Journal of
Refrigeration
, v.13, p.379-392.
Meana, M. B.; Chau, K. V.; Emond, J. P.; Talbot, M. T. Forced-air cooling of strawberries in
reusable plastic containers.
Proceedings of Florida State Horticultural Society. v. 118, p.
379-382, 2005.
Mohamed, I. O. (2008). An inverse lumped capacitance method for determination of heat
transfer coefficients for industrial air blast chillers.
Food Research International, 41.
p.404–410.
Mohsenin, N. N. (1980).
Thermal properties of foods and agricultural materials. New York:
Gordon and Breach. p. 198-224. 1980.
Nunes, M.; Nader, G.; Jesus, F. B. G.; Cardoso, M.; Jabardo, P. J. S.; Pereira, M. T. (2003).
Estudo sobre técnicas de medição de vazão em bocas de insuflamento e de exaustão
de ar. Metrologia-2003 – Metrologia para a Vida Sociedade Brasileira de Metrologia
(SBM) Setembro 01-05, 2003, Recife, Pernambuco - BRASIL
Comparison of the Effects of Air Flow and Product Arrangement on Freezing Process
by Convective Heat Transfer Coefficient Measurement
325
Resende, J. V.; Silveira Jr, V. (2002a). Medidas da Condutividade Térmica Efetiva em
Modelos de Polpas de Frutas no Estado Congelado.
Ciência e Tecnologia de
Alimentos
, v.22, n.2, p.177-183.
Resende, J. V.; Silveira Jr. V. (2002b). Escoamento de ar através de embalagens de polpa de
frutas em caixas comerciais: Efeitos sobre os perfis de velocidade em túneis de
congelamento.
Ciência e Tecnologia de Alimentos, v.22, n.2, p.184-191.
Resende, J. V.; Neves Filho, L. C.; Silveira Jr, V. (2002). Coeficientes de Transferência de
Calor Efetivos no Congelamento com Ar Forçado de Modelos de Polpas de Frutas
em Caixas Comerciais.
Brazilian Journal of Food Technology, v.5, p.33-42.
Salvadori, V. O.; Mascheroni, R. H. (1996). Freezing of strawberry pulp in large containers:
experimental determination and prediction of freezing times.
International Journal of
Refrigeration
, v.19, n.2, p.87-94.
Santos, C. A.; Laurindo, J. B.; Silveira Junior, V.; Hense, H. (2008). Influence of secondary
packing on the freezing time of chiken meat in air blast freezing tunnels [Influência
da embalagem secundária sobre o tempo de congelamento de carne de frango em
túneis de circulação de ar forçada].
Ciencia e Tecnologia de Alimentos, 28 (SUPPL.).
p.252-258.
Scott, E. P.; Beck, J. V.; Heldman, D. R. (1992). Estimation of Time Variable Heat Transfer
Coefficients in Frozen Foods during Storage.
Journal of Food Engineering, v.15, p.99-
121, 1992.
Talbot, M. T.; Chau, K. V. (1998). Precooling Strawberries. Agricultural and Biological
Engineering Department, Florida Cooperative Extension Service, Institute of Food
and Agricultural Sciences, University of Florida, pub.CIR942/AE136, 1998.
Available in: <
Talbot, M. T.; Fletcher, J. H. A (1996). Portable Demonstration Forced-Air Cooler.
Agricultural and Biological Engineering Department, Florida Cooperative
Extension Service, Institute of Food and Agricultural Sciences, University of
Florida, pub.CIR1166/AE096, 1996. Available in:<
Vigneault, C.; Goyette, B.; Markarian, N. R.; Hui, C. K. P.; Cote, S.; Charles, M. T.; Emond, J
P. (2004a). Plastic container opening area for optimum hydrocooling.
Canadian
Biosystems Engineering
, v.46, p.41-44.
Vigneault, C.; De Castro, L. R.; Gautron, G. (2004b). Effect of open handles on packages
during precooling process of horticultural produce.
ASAE Annual International
Meeting.
p. 6901-6908.
Vigneault, C.; De Castro, L. R.; Cortez, L. A. B. (2005). Effect of Gravity on Forced-air
Precooling.
IASME Transactions Vol. 2(3):459-463.
Welty, J. R.; Wicks, C. E.;, Wilson, R. E.; Rorrer, G. (2000). Fundamentals of Momentum, Heat,
and Mass Transfer
. 4
th
Edition, John Wiley & Sons: New York, 2000.
Welty-Chanes, J.; Vergara-Balderas, F.; Bermudez-Aguirre, D. (2005). Transport phenomena
in food engineering: Basic concepts and advances. Journal of Food Engineering V. 67,
(1-2), March 2005, Pages 113-128.
Zaritzky, N. E. (2000). Factors affecting the stability of frozen foods. In: KENNEDY, C. J.
Managing frozend foods. Cambridge: Woodhead Publishing Limited, 2000.
Zou, Q; Opara, L. U.; Mckibbin, R. (2006a). A CFD modeling system for airflow and heat
transfer in ventilated packaging for fresh foods: I. Initial analysis and development
of mathematical models.
Journal of Food Engineering. v. 77, Issue 4, p. 1037-1047.
Heat Transfer - Theoretical Analysis, Experimental Investigations and Industrial Systems
326
Zou, Q; Opara, L. U.; Mckibbin, R. (2006b). A CFD modeling system for airflow and heat
transfer in ventilated packaging for fresh foods: II. Computational solution,
software development, and model testing.
Journal of Food Engineering. v. 77, Issue 4,
p. 1048-1058.
12
Marangoni Condensation Heat Transfer
Yoshio Utaka
Yokohama National University
Japan
1. Introduction
Marangoni condensation phenomena, which show the extremely high heat transfer
coefficient in the dropwise condensation regime, occur due to surface tension instability of
the condensate in the condensation of binary a vapor mixture of a positive system (i.e., one
in which the surface tension of the mixture has a negative gradient with the mass fraction of
the volatile component, such as water - ethanol and water - ammonium mixtures.)
Marangoni dropwise condensation differ from so-called dropwise condensation which
occurs only on the lyophobic surface and easily occurs on the wetting surface. This
phenomenon was first reported by Mirkovich & Missen (1961) for a binary mixture of
organic vapors. Ford & Missen (1968) demonstrated that the criterion for instability of a
condensate liquid film. Fujii et al. (1993) experimentally investigated the condensation of
water - ethanol mixtures in a horizontal tube and found that several different condensation
modes such as dropwise and rivulets occur depending on concentration. Morrison & Deans
(1997) measured the heat transfer characteristics of a water - ammonium vapor mixture and
found that it exhibited enhanced heat transfer.
Utaka & Terachi (1995a, 1995b) measured the condensation characteristic curves and
clarified that surface subcooling is one of the dominant factors in determining the
condensate and heat transfer characteristics of Marangoni condensation although the effect
of concentration of binary mixture was major factor deciding the condensation modes in
most experimental reserches. Moreover, the effects of external conditions such as the vapor
mass fraction (Utaka & Wang, 2004) and the vapor velocity (Utaka & Kobayashi, 2003) were
investigated. Heat transfer was significantly enhanced at low mass fractions of ethanol in a
water - ethanol mixture. Murase et al. (2007) studied Marangoni condensation of steam -
ethanol mixtures using a horizontal condenser tube. Their results showed similar trends as
those of (Utaka & Wang, 2004) for vertical surfaces.
On the other hand, the mechanisms of Marangoni condensation have also been studied.
Hijikata et al. (1996) presented a theoretical drop growth mechanism for Marangoni
dropwise condensation. They found that the Marangoni effect that occurs due to a
difference in the surface tension plays a more important role than the absolute value of
the surface tension in Marangoni condensation. Utaka et al. (1998) investigated the effect
of the initial drop distance, which is the average distance of the initially formed drops
grown from a thin flat condensate film that appears immediately after a drop departs.
They clarified that the initial drop distance is closely related to the heat transfer
Heat Transfer - Theoretical Analysis, Experimental Investigations and Industrial Systems
328
characteristics of Marangoni condensation. Further, Utaka & Nishikawa (2003a, 2003b)
measured the thickness of condensate films on the tracks of departing drops and between
drops by applying the laser extinction method. They found that the condensate film
thickness was approximately 1 μm and that it is closely related to the initial drop distance
and the heat transfer characteristics.
In this paper, the mechanisms and the heat transfer characteristics of Marangoni
condensation phenomena are described on the basis of those researches.
2. General description of mechanisms and characteristics of Marangoni
condensation phenomena
2.1 Outline of mechanisms and characteristics of Marangoni condensation
phenomena
The conditions determining the condensate modes in condensation of binary mixtures
depend upon the phase equilibrium relation between liquid and vapor and the magnitude
relation between surface tension of two liquids. Marangoni condensation appears typically
for the case of so-called positive system, in which the surface tension of more volatile
component σ
L
is lower than that of non-volatile component σ
H
. Such a instability in the
system of liquid evaporation was shown by Hovestreijit (1963) for the first time. The
mechanism of Marangoni condensation was explained by Fujii et al. (1993) from the similar
point of view as shown in Fig. 1. The thicker condensate liquid (point B in Fig. 1) pull the
thinner condensate (point A) due to the surface tension difference occurred by the
distributions of surface temperature and concentration of liquid. As a result, the irregular
condensate thickness augmented and the irregular modes of condensate such as dropwise
appear by the surface instability. The phase equilibrium ralation and the variation of surface
tension against mass fraction for water – ethanol binary mixture, which is major test
material as a positive system in this study, is shown in Fig. 2.
The major dominant parameters in Marangoni condensation are the concentration of vapor
and the surface subcooling of condensing surface. Althoug the concentration of vapor was a
main factor determining the condensation mode, in investigating the heat transfer
characteristics of Marangoni condensation, surface subcooling was found to be the
fundamental factor controlling the condensate modes by Utaka-Terachi (1995a, 1995b). In
other words, the change in heat transfer coefficient showed strong non-linearity with
condensate mode transition because the Marangoni dropwise condensation formed in the
vapor-side appears over the wide range of surface subcooling, in addition to the change in
diffusion resistance, which is inherent in the condensation of binary mixtures. The features
of the condensation characteristic curves are summarized schematically in Fig. 3, in which
the variations of heat flux q and heat transfere coefficient α aginst surface subcooling ∆T are
shown. Table 1 shows the characters in the change in heat transfer codfficient. Alphabetical
symbols in the figure and table denote characteristic points in the condensation
characteristic curves. Points B and D are the steep increase point of heat transfer and the
maximum heat transfer point, respectively. The condensate shows the dropwise mode in a
wide range of surface subcooling, encompassing B and D, and the dropwise mode appears
when approaching point D from B. With further increase of the surface subcooling, the
minimum point of the heat flux and the point of inflection of the heat transfer coefficient (E)
appear as the end point of the transition region.
Marangoni Condensation Heat Transfer
329
Fig. 1. Mechanisms of Marangoni condensation phenomena
0 20 40 60
330
340
350
360
370
380
20
40
60
80
Ethanol mass fraction C %
Temperature K
Surface Tension σ mN/m
Vapor line
Liquid line
Fig. 2. Phase equilibrium relation and surface tension variation for water-ethanol mixtures
0 10 20 30 40 50
0
10
20
30
40
Heat transfer coeff. kW /(m
2
K)
Surface subcooling K
α
ΔT
A
B
C
D
E
Fig. 3. Nature of condensation characteristic curves for Marangoni condensation
Heat Transfer - Theoretical Analysis, Experimental Investigations and Industrial Systems
330
Domain Characteristics
Smaller ∆T than steep increase pt. (B)
(Vapor-side dominant region, A -B)
Small α
Diffusion resistance
dominant
Linear increase of α from
pt. (B) to pt. (C)
(Steep increase region, B -C)
Reduction of diffusion
resistance
Dropwise condensation
Departing from linear increase
Maximum α pt. (D)
Negative gradient region
(Transition region, C -E)
Reduction of α
(Film region (E - )) Film condensation
Table 1. Nature of Marangoni condensation heat transfer
2.2 Marangoni dropwise condensation cycle
There are drop cycles in Marangoni dropwise condensation similar to dropwise
condensation on a lyophobic surface. Since detailed aspects of condensate variation describe
later in the relating sections, only the basic items are discussed here. First, just after
sweeping by a departing drop in a typical condensation process, thin liquid condensate film
remains. Next, the formation of initial drops commences along with the continuous
condensation. Then, the drops grow with condensation and coalescences of drops. At the
final stage of the cycle, some largest drops begin to depart due to the effect of external forces
such as gravity and vapor flow and the new thin liquid film appears. Those cycles are
repeated irregularly.
3. Experimental apparatus and methods common in measurements
Typical experimental apparatus and method common for Marangoni condensation
experiments were shown next. A copper heat transfer block devised specifically for
investigating phenomena with large heat flux and high heat transfer coefficients (Utaka &
Kobayshi, 2003) was shown in Fig. 4. The heat transfer block having a cross-section of
trapezoidal shape with notches was constructed in order to realize uniformity of surface
temperature and large heat flux. The condensing surface had an area of 10 mm×20 mm.
The copper block of one-dimensional rectangular column was also utilized for the cases
realizing moderate heat flux. Oxidized titanium was applied to the condensing surface in
order to achieve a wetting surface. In addition, impinging water jets from a bundle of thin
tubes were used so as to provide high and uniform cooling intensity. A schematic
diagram of the leak-tight experimental apparatus, intended to minimize the effects of non-
condensing gas, is shown in Fig. 6 (Utaka & Wang, 2004). After passing through the
condensing chamber (Fig. 5) in which the heat transfer block is placed, the vapor
generated in the steam generator is condensed almost entirely in the auxiliary condenser.
The condensate is returned to the vapor generator by the plunger pump via the flow
measurement equipment. The vapor flow is in the same direction in which gravity acts,
through a duct. Non-condensing gas is continuously extracted by the vacuum pump near
the outlet of the auxiliary condenser. The inlet of the vacuum pump is cooled by an
Marangoni Condensation Heat Transfer
331
electronic cooler to maintain a constant concentration in the vapor mixture, by
maintaining low vapor pressure. The loop was divided into a high-pressure part and a
low-pressure part bounded by the pressure adjusting valve and the return pump. The
vapor pressure of the high-pressure-side is maintained at approximately 1 kPa above
atmospheric pressure. The concentration of non-condensing gas in the vapor mixture is
measured before and after the experiment. Another heat transfer block shown in Fig. 6 for
the vapor concentration measurement is attached in the condensing chamber located
downstream of the main heat transfer block.
Condensing surface Notch
Cooling surface
10
70
2
3
11
Φ0.5
(The rmocouple junctions)
Condensing surface Notch
Cooling surface
Φ0.5
(The rmocouple junctions)
Fig. 4. Heat transfer block for large heat flux
A
-
A
A
A
290
25
120
50
20
38
20
heat transfer block
Insulator
vapor mixture
observation window
insulator
heat transfer
block
200
water coolant jets
copper block
for concentration
measurement
80
Fig. 5. Condensing chamber
Heat Transfer - Theoretical Analysis, Experimental Investigations and Industrial Systems
332
Plunger pump
P
Vacuum
pump
Electronic
cooler
Flow
meter
Vapor generator
Gas fraction
measurement
Cooling
water
Pressure
adjustment
valve
Auxiliary
condenser
Condensing
chamber
Condensing
block
P
P
Plunger pump
P
Vacuum
pump
Electronic
cooler
Flow
meter
Vapor generator
Gas fraction
measurement
Cooling
water
Pressure
adjustment
valve
Auxiliary
condenser
Condensing
chamber
Condensing
block
P
P
Fig. 6. Schematic diagram of experimental apparatus
After the vapor condition reaches the steady state, the condensation characteristic curves were
measured continuously using a quasi-steady measurement in which the temperature of the
cooling water was changed very slowly for a fixed concentration and fixed velocity of vapor.
The aspect of condensate was observed and recorded through the glass window of the
condensing chamber using a high speed camera to analyze the condensate characteristics.
4. Factors concerning mechanisms of Marangoni condensation
As described in Section 2, the irregurarity of condensate appears due to surface tenstion
instability of the condensation system for binary mixtures of positive system in Marangoni
condensation. Hijikata et al. (1996) performed the instability analyses and gave proof of
Maragoni condensation phenomena theoretically. In this section, the dominant factors
concerning the mecanism of heat transfer in Marangoni condensation is discussed.
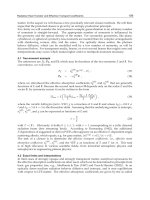
4.1 Relation between initial drop distance and heat transfer
(a) Observation and measurements of drop formation
The observation and measurement of the process of formation and growth of condensate
drops commenced after the sweeping action by the departing drops were carried out for
four ethanol mass fractions of vapor c, i.e., c = 0.07, 0.17, 0.37 and 0.52 under constant vapor
velocity at atmospheric pressure (Utaka, et al. 1998). Figure 7 (a) - (c) shows the photographs
taken by the high speed camera. Figure 8 (a) shows the condensation heat transfer
characteristic curves measured simultaneously with the taking photographs. The local
maximum drops sizes increased with increasing distance from the up-flow side peripherals
of the departing drops, which are shown as the largest drops in the images, because the time
elapsed from the sweep motions by departing drops increased with the distance owing to
the limited velocity of the drop departure. It is also seen that almost no droplets existed at
the relatively thin belt-wise areas just next to the up-flow side peripherals of the departing
drops. The small droplets appeared at the next areas. Hence, the initial drops form from the
Marangoni Condensation Heat Transfer
333
thin liquid film and then grow by condensation and coalescences as reported in the
observation of Hijikata et al. (1996) by making the uniform sweeping over the whole surface.
It could be understood that the drop sizes nearest to the peripherals of the departing drops
varied with the surface subcooling.
The initial drop distance d
i
, which is the distance between adjoining drops forms after the
sweeping, were adopted as parameters determining the characteristics against the variation
of the ethanol concentration and the surface subcooling. Here, the reason for adopting the
initial drop distance to decide the characteristics of drop formation is as follows. It is
difficult to determine the minimum drop size because the unevenness of thin condensate
film and drop shape are not distinguishable each other. On the contrary, since the initial
drop distance does not change until an occurrence of a first coalescence, it can be defined
certainly.
The variations of initial drop distance measured are shown in Fig. 8(b). Since the elapsed
time after the end of sweep changes along the track of the departing drop as described
above, the drop sizes varies along the departure direction. Therefore, the distance between
the neighboring drop centers in the direction of the departing drop peripheral was adopted
(a) ∆T = 15.2 K (b) ∆T = 18.3K (c) ∆T = 29.5 K
Fig. 7. Aspect of condensate (c =0.37)
0.2 m
m
20 40
20
40
0
Surf ace subcool ing Δ K
Heat transf er coef f i ci ent kW/m
2
K
= 0.23 m/s
0.07
0.17
0.37
0.52
T
α
U
C
20 40
0.2
0.4
0
Surf ace subcool ing Δ K
Initial drop distance mm
= 0.23 m/s
0.07
0.17
0.37
0.52
T
d
i
C
U
(a) Heat transfer characteristic curves (b) Variation in initial drop distance
Fig. 8. Relation among aspect of condensation, heat transfer characteristic curve, and initial
drop distance