Heat Transfer Theoretical Analysis Experimental Investigations and Industrial Systems part 13 potx
Bạn đang xem bản rút gọn của tài liệu. Xem và tải ngay bản đầy đủ của tài liệu tại đây (3.46 MB, 40 trang )
Heat Transfer - Theoretical Analysis, Experimental Investigations and Industrial Systems
470
Approximating this equation by a finite differential equation the typical temperature drop
over l
x
≡0.9λ
W
can be determined:
′
′
WW
x
res p res
q0.9
λ
ΔT=
δρcU
, (15)
Where
′′
W
q
is the heat flux at the wall, U
res
is the average liquid velocity in the residual layer,
ρ is the liquid density and c
p
is the specific heat. The remaining ten percent of l
x
correspond
to the length of the wave front. The material properties are taken at inflow temperatures.
From the thermographic pictures as presented in Fig. 7.c.1, the temperature difference in x
and y direction can be evaluated. Thereby a proportionality can be determined.
⋅
zx
ΔT=kΔT . (16)
As for current data the constant of proportionality is in the range between 1 < k < 5. For
further considerations a value of k = 3 was assumed.
zx
ΔT=3ΔT . (17)
Now, substituting expressions (16) and (15) into (11), we obtain:
η
′′
WW
TC
zpres
dσ 1q 0.9λ 1
U=
dT l ρcU 3
(18)
and (18) into (13):
0.9 1
3
η
′
′
WW W
zzpresW
1dσ 1q λ c
=
ldT lρcU λ
. (19)
Solving Eq. (19) for
′
′
W
q :
η
η
′′
22 2
pres pres
WzW 0
W
2
WW
ρcU ρcU
1c l 1f Λ 1
q= =
dσ dσ
0.9
λ
30.9c 43
dT dT
. (20)
According to expression (20) the critical heat flux depends on the liquid properties, the
frequency of large waves and the typical transverse size of regular structures. If the
following dimensionless numbers are used:
ν
⎛⎞
′′
⎜⎟
⎝⎠
ν
2
2
3
W
q
2
dσ
q
dT g
Ma =
λρ
,
ν
Pr =
a
and
()
ν
⎛⎞
⎜⎟
⎜⎟
⎜⎟
⎝⎠
2
W0
Λ
1
3
f Λ
K=
g
. (21)
Equation (21) can be presented in the form:
q
res res
Λ WW
Ma
1U 11 1 U
==
PrK 0.9 c 4 3 10.8 c
. (22)
Heat Transfer Phenomena in Laminar Wavy Falling Films:
Thermal Entry Length, Thermal-Capillary Metastable Structures, Thermal-Capillary Breakdown
471
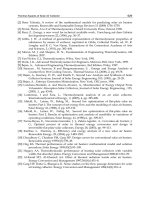
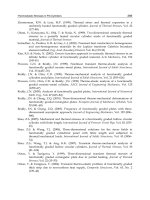
Therefore, in Fig. 13 the experimental data for the dimensionless critical heat flux
(Ma
q
/PrK
Λ
) are presented as a function of the Reynolds number. Only data which were
obtained on excited falling films (with the help of the loud speaker) were used, allowing to
keep the major frequency f
W
at a constant value. As can be seen Eq. (22) depends on the
relation between the mean velocity of the residual layer and the mean velocity of large
waves. In the literature many different analytical and empirical equations can be found for
these velocities as functions of the Reynolds number. For example in (Brauner & Maron,
1983) a physical model for the falling film is presented. In this case the ratio is constant:
res
W
U
= 0.091
c
. (23)
Therefore the combination of dimensionless parameters from (22) is constant, too:
q
-3
Λ
Ma
=8.43×10
PrK
. (24)
Equation (24) is in the same order for the dimensionless critical heat flux as the experimental
data, but the trend of the latter has a different inclination, see Fig. 13.
In (Al-Sibai, 2004) the same silicone oils were used as in the current experiments. Therefore a
better comparability could be given for dependencies from (Al-Sibai, 2004) as for other
correlations from literature. Since the thickness of the residual layer is relatively small the
Nusselt formula for laminar flow can be used:
ν
2
res
res
gδ
U=
3
. (25)
In (Al-Sibai, 2004) an equation for the residual layer thickness can be found:
0.001
0.01
0.1
1
Ma /(Pr K )
Λ
q
DMS-T11
DMS-T20
Re
5610
3
06
2
036
.
Re
.
.
⋅
−
−
⋅
3
8.43 10
⋅
-4 1.44
5.59 10 Re
0 2 4 6 8 10 12 14 16
(1+0.219 Re )
.
Fig. 13. The dependence of dimensionless parameter Ma
q
/(PrK
Λ
) versus Reynolds-number.
Points experimental data (Lel et al., 2007a)
Heat Transfer - Theoretical Analysis, Experimental Investigations and Industrial Systems
472
()
ν
⎛⎞
⎜⎟
⎝⎠
1
2
3
0.6
res
δ = 1 +0.219Re
g
. (26)
Substituting (26) into (25):
()
ν
11
2
0.6
33
res
1
U=g 1+0.219Re
3
(27)
and another equation from (Al-Sibai, 2004) giving the velocity of large waves against the
Reynolds number:
ν
11
0.36
33
W
c = 5.516g Re . (28)
From Eq. (22) the following non-dimensional expression can be derived with substitutions
(27) and (28):
(
)
2
0.6
q
-3
0.36
Λ
1+0.219Re
Ma
=5.6×10
PrK Re
. (29)
The comparison of dependence (29) with experimental data gives a good agreement in the
order of magnitude but a difference in the inclination, see Fig. 13. For a Reynolds number
range Re < 3 the dimensionless parameter (Ma
q
/PrK
Λ
) according to Eq. (29) even decreases,
but the experimental data show another tendency.
This disagreement between experimental data and theory can be ascribed to the uncertainty
of the proportionality factor in Eq. (16) as describes above.
As can be seen from (29):
(
)
q Λ
Ma = f Re,Pr,K . (30)
This approximation found from experimental data analysis is:
-4 1.44
q Λ
Ma = 5.59× 10 Re PrK
. (31)
In order to verify and consolidate this theory the range of Reynolds number should be
increased. An elongating of heat section will allows the observation of further development
of regular structures.
For the experiments without activated loud speaker the wavelength has to be determined by
measuring the oscillations of the film surface and using the major frequency for the
parameter K
Λ
.
A comparison of experimental data with other dependencies from the literature is shown in
the next part.
4.2 Comparing of experimental data with other approachs
In this part different approaches for the determination of the critical dimensionless heat flux
are presented and compared with experimental data.
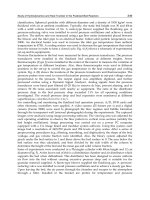
Experimental data for laminar-wavy and turbulent films were described in (Gimbutis, 1988)
by the following empirical dependencies:
Heat Transfer Phenomena in Laminar Wavy Falling Films:
Thermal Entry Length, Thermal-Capillary Metastable Structures, Thermal-Capillary Breakdown
473
⎛⎞
⎛⎞
⎜⎟
⎜⎟
⎜⎟
⎝⎠
⎝⎠
0.5
4.5
0.4
q
Re
Ma = 0.522Re 1+ 0.12
250
for L ≤ 1 m. (32)
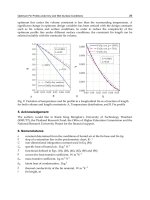
For 100 < Re < 200 in (Gimbutis, 1988) the scattering of data was up to 50 %, for Re < 100 no
experimental data have been recorded. It can be seen in Fig. 14 that this dependence
suggests lower values than the current experimental data. The difference can be explained
by the fact that in (Gimbutis, 1988) the experimental data were obtained only for a water
film flow with a relatively long heated section. In this case evaporation effects and thus a
shift in the thermophysical properties could have appeared.
In (Kabov, 2000) the empirical dependence of the critical Marangoni number on the
Reynolds number for a shorter heated section (6.5 mm length along the flow) for laminar
waveless falling films was obtained:
0.98
q
Ma = 8.14Re . (33)
In this case the length of the heated section is in the same order of magnitude as the thermal
entry length (Kabov, 2000). Therefore this curve indicates higher values than our
experimental data.
Ma
q
Re
DMS-T11
DMS-T20
4 3
0.248Re
⎛ ⎞
⎛ ⎞
1+0.12
⎜ ⎟
⎜ ⎟
⎝ ⎠
⎝ ⎠
0.5
4.5
0.4
Re
0.522Re
250
0.98
8.14 Re
0.1
1
10
100
1000
614121010
246
8
Fig. 14. The dependence of dimensionless parameter Ma
q
versus the Reynolds-number.
Points experimental data (Lel et al., 2007a)
It was shown in (Ito et al., 1995) that for the 2D case the modified critical Marangoni number
is constant:
′′
W
c
2
s
dσ
q
dT
Ma = = 0.23
λρU
. (34)
With the film surface velocity based on Nusselt’s film theory
ν
2
Sm
U=(g2)δ , expression (34)
can be transformed into:
Heat Transfer - Theoretical Analysis, Experimental Investigations and Industrial Systems
474
4/3
q
Ma = 0.248Re . (35)
It can be seen, that only dependence (35) is in the same order of magnitude as our
experimental data.
Other dimensionless parameters for generalisation of experimental data were used in (Bohn
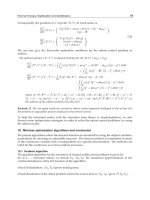
& Davis, 1993) and (Zaitsev et al., 2004). In (Bohn & Davis, 1993) the data for dimensionless
breakdown heat flux is approximated in the form:
W
1/3 5/3 2/3
p
51.43
dσ
dT
=4.78×10 Re
ρ cg
q
η
′′
. (36)
With elementary transformations (36) can be transformed into:
q
51.43
Ma
=4.78×10 Re
Pr
. (37)
Fig. 15 shows that (37) again leads to lower values than our experimental data. Here, as in
case of Eq. (32), evaporation effects could have appeared, because this dependence was
obtained for water and for a 30 % glycerol-water solution at a 2.5 m long test section for
Re > 959.
Re
DMS-T11
DMS-T20
Ma /Pr
q
⋅
5 1.43
4.78 10 Re
0.65
0.155Re
0.0001
0.001
0.01
0.1
1
0246810121416
Fig. 15. The dependence of dimensionless parameter Ma
q
/Pr versus the Reynolds-number.
Points experimental data (Lel et al., 2007a)
A generalisation for water and an aqueous solution of alcohol is presented in (Zaitsev et al.,
2004):
q
0.65
Ma
= 0.155Re
Pr
. (38)
This correlation leads to results which exceed current data by more than one order of
magnitude. This can be partially explained by the fact that dependence (38) was obtained for
Heat Transfer Phenomena in Laminar Wavy Falling Films:
Thermal Entry Length, Thermal-Capillary Metastable Structures, Thermal-Capillary Breakdown
475
stable dry spots, whereas the new data was recorded for the formation of local instable dry
spots.
5. Thermal entry length
In this part experimental data for the thermal entry length with the correlation from the
literature are compared and a new correlation, included dimensionless parameters
incorporated several physical effects, is presented.
A comparison of experimental data for the thermal entry length with correlations for
laminar flow by (Mitrovic, 1988) and (Nakoryakov & Grigorijewa, 1980), is shown in Fig. 16.
Whereas for very low Reynolds numbers (Re
0
< 3) and heat fluxes the experimental data
correlate satisfactorily with these dependencies, at larger Reynolds numbers and heat fluxes
the experimental values lie under the ones obtained through correlations.
L
g
δ
ν
Pr
2
0
1
3
0.1
1
10
DMS-T12 [1]
DMS-T11 [1]
DMS-T11 [2]
(Mitrovic, 1988)
(Nakoryakov & Grigorjeva, 1980)
1
100
10
Re
0
Fig. 16. Experimental data compared with solutions for smooth laminar falling films. [1] –
experimental data by (Lel et al., 2007b); [2] – experimental data by (Lel et al., 2009).
Therefore, the experimental data were used in order to found a empirical dependency which
describes the dimensionless entry length and attempts to incorporate several effects: i) the
effect of nonlinear changing material properties due to temperature changes and the effects
of ii) surface tension and iii) waves:
ν
⎛⎞
⎛⎞
⎜⎟
⎜⎟
⎝⎠
⎝⎠
1
-0.29
2
3
b 0.0606
0
δ 00 0
W
Pr
L=aRePrKa
Pr g
(39)
⎫
⎬
⎭
⎫
⎬
⎭
a = 0.8367
for Re < 8
b = 0.718
a = 0.022
for Re > 8
b = 1.36
Heat Transfer - Theoretical Analysis, Experimental Investigations and Industrial Systems
476
In Fig. 17 the comparison of experimental data with a correlation for 100<Pr
0
<180 and
2<Re
0
<40 is presented.
Here it is significant, that the differences of Eq. (1) and Eq. (39) are the additional terms
involving Pr
0
/Pr
W
and the Kapitza number Ka
0
= (σ
3
ρ/gη
4
).
(Brauer, 1956) found that the Kapitza number has an influence on the development of the
waves at the film surface. He defined the point of instability
1
10
i0
Re =0.72Ka , at which
sinusoidal waves become instable. Therefore, the Kapitza number has also to be
implemented into correlations (39).
The relation Pr
0
/Pr
W
between the Prandtl number at the inflow and at the wall temperature
has to be added into the dependence, in order to take into account the dependency of the
viscosity of the fluid on the temperature.
The effect of the decrease of the thermal entry length flux because of Marangoni convection,
described in (Kabov et al., 1996), is subject to debate. We assume that in this case the
influence of the waves on the thermal entry length play a dominant role. This question stays
unsettled and should be investigated in future.
L
g
W
δ
ν
Pr
Pr
Pr
0
0.29
2
0
Ka
0.0606
0
1
3
1 10010
Re
0
0.1
1
10
DMS-T12 [1]
DMS-T11 [1]
DMS-T11 [2]
Eq. 39
Fig. 17. Comparison of correlation (5) for thermal entry length for laminar wavy films with
the experimental data. [1] – experimental data by (Lel et al., 2007b); [2] – experimental data
by (Lel et al., 2009).
6. Conclusion
The results of the experimental investigation of different physical effects of heat and mass
transfer in falling films were discussed in this chapter.
At first the visualization of quasi-regular metastable structures within the residual layer
between large waves of laminar-wavy falling films were presented. To obtain a relation
between the surface temperature and film thickness fields, infrared thermography and the
chromatic confocal imaging technique were used.
By comparing the temperature and film thickness fields, the assumption of the thermo-
capillary nature (Marangoni effect) of regular structures within the residual layer has been
Heat Transfer Phenomena in Laminar Wavy Falling Films:
Thermal Entry Length, Thermal-Capillary Metastable Structures, Thermal-Capillary Breakdown
477
confirmed. An increase in local surface temperature leads to a decrease in local film
thickness. The evolution of the regular structure’s “head” between two large parabolic
shaped waves over time was presented.
The decrease of the mean film thickness could be explained by a reduction of the viscosity
and a cross flow into the faster moving large waves. Both effects cause a higher film
velocity.
The results obtained are important for the investigation of the dependency between wave
characteristics and local heat transfer, the conditions of “dry spot” appearance and the
development of crisis modes in laminar-wavy falling films.
A model of thermal-capillary breakdown of a liquid film and dry spot formation is
suggested on the basis of a simplified force balance considering thermal-capillary forces in
the residual layer. It is shown that the critical heat flux depends on half the distance between
two hot structures, because the fluid within the residual layer is transferred from hot
structures to the cold areas in between them. It also depends on the main frequency of large
waves, the Prandtl number, the heat conductivity, the liquid density and the change in
surface tension in dependence on temperature. The model is also presented in a
dimensionless form.
The investigations of the thermal entry length of laminar wavy falling films by means of
infrared thermography are shown. Good qualitative agreement with previous works on
laminar and laminar wavy film flow was found at low Reynolds numbers. However, with
increasing Reynolds numbers and heat fluxes, these correlations describe the thermal entry
length inadequately. The correlation established for laminar flow was extended in order to
include the effect of temperature-dependent non-linear material properties as well as for the
effects of surface tension and waves.
7. Acknowledgements
This work was financially supported by the “Deutsche Forschungsgemeinschaft” (DFG
KN 764/3-1). The authors thank the student coworkers and colleagues A. Kellermann, Dr.
H. Stadler, Dr. G. Dietze, M. Baltzer, Dr. F. Al-Sibai, M. Allekotte for the help in the
preparation of this chapter.
8. References
Adomeit, P. & Renz, U. (2000). Hydrodynamics of three-dimensional waves in laminar
falling films,
Int J Mult Flow, Vol. 26, pp. 1183-1208
Alekseenko, S.V.; Nakoryakov, V.E. & Pokusaev, B.G. (1994).
Wave flow of liquid films,
Fukano, T. (Ed.), p. 313, Begell House, Inc., New York
Al-Sibai, F. (2004). Experimentelle Untersuchung der Strömungscharakteristik und der
Wärmeübertragung bei welligen Rieselfilmen.
Thesis of Dr Ing. Degree, Lehrstuhl
für Wärme- und Stoffübertragung, RWTH Aachen
Al-Sibai, F.; Leefken, A.; Lel, V.V. & Renz, U. (2003). Measurement of transport
phenomena in thin wavy film.
Fortschritt-Berichte VDI 817 Verfahrenstechnik Reihe
3,
pp. 1-15
Heat Transfer - Theoretical Analysis, Experimental Investigations and Industrial Systems
478
Bohn, M.S. & Davis, S.H. (1993). Thermo-capillary breakdown of falling liquid film at high
Reynolds number.
Int J Heat Mass Transf, Vol. 7, pp. 1875-1881
Bettray, W. (2002). FTIR measurements of spectral transmissivity for layers of silicone fluids
with different thicknesses,
Technical Report of the Institute for Organic Chemistry at the
RWTH Aachen University
, Germany
Brauer, H. (1956). Strömung und Wärmeübergang bei Rieselfilmen,
VDI Forschungsheft 457
Brauner, N. & Maron, D.M. (1983). Modeling of wavy flow in inclined thin films. Chem Eng
Sci
, Vol 38, No. 5, pp. 775-788
Chinnov, E.A. & Kabov, O.A. (2003). Jet formation in gravitational flow of a heated wavy
liquid film,
J Appl Mech Tech Phys, Vol. 44, No. 5, pp. 708-715
Cohen-Sabban, J.; Crepin, P J. & Gaillard-Groleas, J. (2001). Quasi confocal extended field
surface sensing,
Processing of Optical Metrology for the Semicon, Optical and Data
Storage Industries SPIE’s 46
th
Annual Meeting, San Diego, August 2-3, CA, USA
Ganchev, B.G. (1984). Hydrodynamic and heat transfer processes at downflows of film and
two-phase gas-liquid flows (in Russian),
Thesis of Doctor’s Degree in Phys-Math. Sci.,
Moscow
Gimbutis, G. (1988). Heat transfer at gravitation flow of a liquid film (in Russian), Mokslas,
Vilnius
Ito, A.; Masunaga, N. & Baba, K. (1995). Marangoni effects on wave structure and liquid film
breakdown along a heated vertical tube, In:
Advances in multiphase flow, Serizawa,
A.; Fukano, T.; Bataille, J. (Ed.), pp. 255-265, Elsevier, Amsterdam
Kabov, O.A. (2000). Breakdown of a liquid film flowing over the surface with a local heat
source.
Thermophys Aeromech, Vol. 7, No.4, pp. 513-520
Kabov, O.A. & Chinnov, E.A. (1998). Hydrodynamics and heat transfer in evaporating thin
liquid layer flowing on surface with local heat source. In:
Proceedings of 11
th
international heat transfer conference
, Vol. 2, pp. 273-278, Kyondju, Korea, August 23-
28
Kabov, O.A.; Chinnov, E.A. & Legros, J.C. (2004). Three-dimensional deformations in non-
uniformly heated falling liquid film at small and moderate Reynolds numbers, In:
2
nd
International Berlin Workshop—IBW2 on Transport Phenomena with Moving
Boundaries
, Schindler, F P. (Ed.), pp. 62-80, Düsseldorf: VDI Verlag, VDI Reihe 3,
No. 817, 9-10 October, Germany
Kabov, O.A.; Diatlov A.V. & Marchuk, I.V. (1995). Heat transfer from a vertical heat source
to falling liquid film, In:
G.P. Celata and R.K. Shah, Editors, Proceeding of First Internat.
Symp. on Two-Phase Flow Modeling and Experimentation, Vol.1, pp. 203–210, Rome,
Italy, 1996
Kabov, O.A.; Marchuk, I. V. & Chupin, V.M. (1996). Thermal imaging study of the liquid
film flowing on vertical surface with local heat source.
Russ. J. Eng. Thermophys,
Vol. 6, No. 2, pp. 104-138
Kabov, O.A.; Legros, J.C.; Marchuk IV & Scheid, B. (2001). Deformation of free surface in a
moving locally-heated thin liquid layer.
Fluid Dyn, Vol. 36, No. 3, pp. 521-528
Klein, D.; Hetsroni, G. & Mosyak, A. (2005). Heat transfer characteristics of water and APG
surfactant solution slow in a micro-channel heat sink,
Int J Mult Flow, Vol. 31, No. 4,
pp.393-415
Heat Transfer Phenomena in Laminar Wavy Falling Films:
Thermal Entry Length, Thermal-Capillary Metastable Structures, Thermal-Capillary Breakdown
479
Lel, V.V.; Al-Sibai, F.; Leefken, A. & Renz, U. (2005). Local thickness and wave velocity
measurement of wavy falling liquid films with chromatic confocal imaging method
and a fluorescence intensity technique,
Exp Fluids, Vol. 39, pp. 856-864
Lel, V.V.; Al-Sibai, F. & Kneer, R. (2009). Thermal entry length and heat transfer phenomena
in laminar wavy falling films,
Microgravity Sci. Technol, Vol. 21 (Suppl 1), pp. 215-
220
Lel, V.V.; Dietze, G.F.; Stadler, H.; Al-Sibai, F. & Kneer, R. (2007b). Investigation of the
Thermal Entry Length in Laminar Wavy Falling Films,
Microgravity sci. technol.,
Vol. XIX-3/4, pp. 66-68
Lel, V.V.; Kellermann, A.; Dietze, G.; Kneer, R. & Pavlenko, A.N. (2008). Investigations of the
Marangoni effect on the regular structures in heated wavy liquid films,
Exp Fluids,
Vol.44, pp. 341-354
Lel, V.V.; Stadler, H.; Pavlenko, A. & Kneer, R. (2007a). Evolution of metastable quasi-
regular structures in heated way liquid films,
J Heat Mass Transf, Vol. 43, No. 11, pp.
1121-1132
Ludviksson, V. & Lightfoot, E.N. (1968). Hydrodynamic stability of Marangoni films,
AIChE
J, Vol. 14, No. 4, pp. 620-626
Mayerlen, W. & Tacke, M. (2002). Measurements of spectral reflectance of silicone fluids,
Technical report of FGAN-FOM, Forschungsinstitut für Optronik und
Mustererkennung, Germany
Mitrović, J. (1988). Der Wärmeaustausch am Berieselungskühler.
Brennstoff-Wärme-Kraft,
Vol. 40, No. 6, pp. 243-249
Nakoryakov V.E. & Grigorjeva, N.I. (1980). Calculation of heat and mass transfer in
nonisothermal absorption on the initial portion of downflowing films.
Theoretical
Foundations of Chemical Engineering
, Vol. 14, pp. 305-309
Pavlenko, A.N. & Lel, V.V. (1997). Heat transfer and crisis phenomena in falling films of
cryogenic liquid,
Russ J Eng Thermophys, Vol. 3-4, No. 7, pp. 177-210
Pavlenko, A.N.; Lel, V.V.; Serov, A.F.; Nazarov, A.D. & Matsekh, A.M. (2002). Wave
amplitude growth and heat transfer in falling intensively evaporating liquid film,
J
Eng Thermophys
, Vol. 11, No. 1, pp. 7-43
Ruyer-Quil, C.; Scheid, B.; Kalliadasis, S.; Velarde, M.G. & Zeytounian, R.K. (2005).
Thermocapillary long waves in a liquid film flow. Part 1. Low dimensional
formulation,
J Fluid Mech, Vol. 538, pp. 199-222
Scheid, B.; Ruyer-Quil, C.; Kalliadasis, S.; Velarde, M.G. & Zeytounian, R.K. (2005).
Thermocapillary long waves in a liquid film flow. Part 2. Linear stability and
nonlinear waves,
J Fluid Mech, Vol. 538, pp. 223-244
Scheid, B.; Ruyer-Quil, C. & Manneville, P. (2006). Wave patterns in film flows. Modeling
and three-dimensional waves,
J Fluid Mech, Vol. 562, pp. 183-222
Slattery, J. & Stuckey, E.L.; Trans R Soc Can Sect, Vol. XXVI, pp. 131
Trevelyan, P.M.J. & Kalliadasis, S. (2004). Wave dynamics on a thin liquid film falling down
a heated wall,
J Eng Maths, Vol. 50, pp. 177-208
Yüksel, M.K. & Schlünder, E.U. (1988). Wärme- und Stoffübertragung bei der
Nichtisothermen Rieselfilmabsorption,
Wärme- und Stoffübertragung, Vol. 22, pp.
209-218
Heat Transfer - Theoretical Analysis, Experimental Investigations and Industrial Systems
480
Zaitsev, D.V.; Kabov, O.A.; Cheverda, V.V. & Bufetov, N.S. (2004). The effect of wave
formation and wetting angle on the thermocapillary breakdown of a falling liquid
film.
High Temperature, Vol. 42, No. 3, pp. 450-456
19
Heat Transfer to Fluids at
Supercritical Pressures
Igor Pioro and Sarah Mokry
University of Ontario Institute of Technology
Canada
1. Introduction
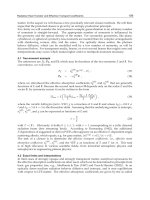
Prior to a general discussion on parametric trends in heat transfer to supercritical fluids, it is
important to define special terms and expressions used at these conditions. Therefore,
general definitions of selected terms and expressions, related to heat transfer to fluids at
critical and supercritical pressures, are listed below. For better understanding of these terms
and expressions a graph is shown in Fig. 1. General definitions of selected terms and
expressions related to critical and supercritical regions are listed in the Chapter
“Thermophysical Properties at Critical and Supercritical Conditions”.
Axial Location, m
0.0 0.5 1.0 1.5 2.0 2.5 3.0 3.5 4.0
Temperature,
o
C
300
350
400
450
600
550
500
Bulk Fluid Enthalpy, kJ/kg
1400 1600 1800 2000 2200 2400 2600 2800
HTC, kW/m
2
K
2
4
8
12
16
20
28
36
Heated length
Bulk fluid temperature
t
in
t
out
Inside wall temperature
Heat transfer coefficient
p
in
=24.0 MPa
G=503 kg/m
2
s
Q=54 kW
q
ave
= 432 kW/m
2
C381.1t
o
pc
=
H
pc
Dittus - Boelter correlation
DHT
Improved HT
Normal HT
Normal HT
Fig. 1. Temperature and heat transfer coefficient profiles along heated length of vertical
circular tube (Kirillov et al., 2003): Water, D=10 mm and L
h
=4 m.
Heat Transfer - Theoretical Analysis, Experimental Investigations and Industrial Systems
482
General definitions of selected terms and expressions related to heat transfer at critical
and supercritical pressures
Deteriorated Heat Transfer (DHT) is characterized with lower values of the wall heat
transfer coefficient compared to those at the normal heat transfer; and hence has higher
values of wall temperature within some part of a test section or within the entire test
section.
Improved Heat Transfer (IHT) is characterized with higher values of the wall heat transfer
coefficient compared to those at the normal heat transfer; and hence lower values of wall
temperature within some part of a test section or within the entire test section. In our
opinion, the improved heat-transfer regime or mode includes peaks or “humps” in the heat
transfer coefficient near the critical or pseudocritical points.
Normal Heat Transfer (NHT) can be characterized in general with wall heat transfer
coefficients similar to those of subcritical convective heat transfer far from the critical or
pseudocritical regions, when are calculated according to the conventional single-phase
Dittus-Boelter-type correlations: Nu = 0.0023 Re
0.8
Pr
0.4
.
Pseudo-boiling is a physical phenomenon similar to subcritical pressure nucleate boiling,
which may appear at supercritical pressures. Due to heating of supercritical fluid with a
bulk-fluid temperature below the pseudocritical temperature (high-density fluid, i.e.,
“liquid”), some layers near a heating surface may attain temperatures above the
pseudocritical temperature (low-density fluid, i.e., “gas”) (for specifics of thermophysical
properties, see Chapter “Thermophysical Properties at Critical and Supercritical
Conditions”). This low-density “gas” leaves the heating surface in the form of variable
density (bubble) volumes. During the pseudo-boiling, the wall heat transfer coefficient
usually increases (improved heat-transfer regime).
Pseudo-film boiling is a physical phenomenon similar to subcritical-pressure film boiling,
which may appear at supercritical pressures. At pseudo-film boiling, a low-density fluid (a
fluid at temperatures above the pseudocritical temperature, i.e., “gas”) prevents a high-
density fluid (a fluid at temperatures below the pseudocritical temperature, i.e., “liquid”)
from contacting (“rewetting”) a heated surface (for specifics of thermophysical properties,
see Chapter “Thermophysical Properties at Critical and Supercritical Conditions”). Pseudo-
film boiling leads to the deteriorated heat-transfer regime.
Water is the most widely used coolant or working fluid at supercritical pressures. The
largest application of supercritical water is in supercritical “steam” generators and
turbines, which are widely used in the power industry worldwide (Pioro and Duffey,
2007). Currently, upper limits of pressures and temperatures used in the power industry
are about 30 – 35 MPa and 600 – 625ºC, respectively. New direction in supercritical-water
application in the power industry is a development of SuperCritical Water-cooled nuclear
Reactor (SCWR) concepts, as part of the Generation-IV International Forum (GIF)
initiative. However, other areas of using supercritical water exist (Pioro and Duffey,
2007).
Supercritical carbon dioxide was mostly used as a modelling fluid instead of water due to
significantly lower critical parameters (for details, see Chapter “Thermophysical Properties
at Critical and Supercritical Conditions”). However, currently new areas of using
supercritical carbon dioxide as a coolant or working fluid have been emerged (Pioro and
Duffey, 2007).
Heat Transfer to Fluids at Supercritical Pressures
483
The third supercritical fluid used in some special technical applications is helium (Pioro and
Duffey, 2007). Supercritical helium is used in cooling coils of superconducting
electromagnets, superconducting electronics and power-transmission equipment.
Also, refrigerant R-134a is being considered as a perspective modelling fluid due to its lower
critical parameters compared to those of water (Pioro and Duffey, 2007).
Experiments at supercritical pressures are very expensive and require sophisticated
equipment and measuring techniques. Therefore, some of these studies (for example, heat
transfer in bundles) are proprietary and hence, were not published in the open literature.
The majority of studies (Pioro and Duffey, 2007) deal with heat transfer and hydraulic
resistance of working fluids, mainly water, carbon dioxide and helium, in circular bare
tubes. In addition to these fluids, forced- and free-convection heat-transfer experiments
were conducted at supercritical pressures, using liquefied gases such as air, argon,
hydrogen; nitrogen, nitrogen tetra-oxide, oxygen and sulphur hexafluoride; alcohols such as
ethanol and methanol; hydrocarbons such as n-heptane, n-hexane, di-iso-propyl-cyclo-
hexane, n-octane, iso-butane, iso-pentane and n-pentane; aromatic hydrocarbons such as
benzene and toluene, and poly-methyl-phenyl-siloxane; hydrocarbon coolants such as
kerosene, TS-1 and RG-1, jet propulsion fuels RT and T-6; and refrigerants.
A limited number of studies were devoted to heat transfer and pressure drop in annuli,
rectangular-shaped channels and bundles.
Accounting that supercritical water and carbon dioxide are the most widely used fluids and
that the majority of experiments were performed in circular tubes, specifics of heat transfer
and pressure drop, including generalized correlations, will be discussed in this chapter
based on these conditions
1
.
Specifics of thermophysical properties at critical and supercritical pressures for these fluids
are discussed in the Chapter “Thermophysical Properties at Critical and Supercritical
Conditions” and Pioro and Duffey (2007).
2. Convective heat transfer to fluids at supercritical pressures: Specifics of
supercritical heat transfer
All
2
primary sources of heat-transfer experimental data for water and carbon dioxide
flowing inside circular tubes at supercritical pressures are listed in Pioro and Duffey (2007).
In general, three major heat-transfer regimes (for their definitions, see above) can be noticed
at critical and supercritical pressures (for details, see Figs. 1 and 2):
1. Normal heat transfer;
2. Improved heat transfer; and
3. Deteriorated heat transfer.
Also, two special phenomena (for their definitions, see above) may appear along a heated
surface:
1. pseudo-boiling;
2. pseudo-film boiling.
1
Specifics of heat transfer and pressure drop at other conditions and/or for other fluids are discussed in
Pioro and Duffey (2007).
2
“All” means all sources found by the authors from a total of 650 references dated mainly from 1950 till
beginning of 2006.
Heat Transfer - Theoretical Analysis, Experimental Investigations and Industrial Systems
484
These heat-transfer regimes and special phenomena appear to be due to significant
variations of thermophysical properties near the critical and pseudocritical points (see Fig.
3) and due to operating conditions.
Axial Location, m
0.0 0.5 1.0 1.5 2.0 2.5 3.0 3.5 4.0
Temperature,
o
C
350
375
400
HTC, kW/m
2
K
20
30
40
50
60
70
80
Bulk Fluid Enthalpy, kJ/kg
1700 1800 1900 2000 2100 2200
Heated length
B
u
l
k
f
l
u
i
d
t
e
m
p
e
r
a
t
u
r
e
I
n
s
i
d
e
w
a
l
l
t
e
m
p
e
r
a
t
u
r
e
H
e
a
t
t
ra
n
s
f
e
r
c
o
e
f
f
i
c
i
e
n
t
p
in
=24.0 MPa, G=1494 kg/m
2
s,
Q=61 kW, q
ave
=489 kW/m
2
H
pc
t
pc
= 381.3
o
C
t
in
t
out
Dittus - Boelter correlation
Normal HT
Improved HT
(a)
Axial Location, m
0.0 0.5 1.0 1.5 2.0 2.5 3.0 3.5 4.0
Temperature,
o
C
325
350
400
375
425
450
300
Bulk Fluid Enthalpy, kJ/kg
1400 1600 1800 2000 2200 2400
HTC, kW/m
2
K
6
8
12
16
20
24
32
40
48
56
Heated length
B
u
lk
f
l
u
id
t
e
m
p
e
r
a
t
u
r
e
t
in
t
out
I
n
s
i
de
wal
l
t
e
m
p
e
r
at
u
r
e
Heat transfer coefficient
p
in
=23.9 MPa, G=997 kg/m
2
s
Q=74 kW, q
ave
= 584 kW/m
2
C380.8t
o
pc
=
H
pc
Dittus - Boelter correlation
DHT
Normal HT
Axial Location, m
0.00.51.01.52.02.53.03.54.0
Temperature,
o
C
300
350
400
450
550
500
Bulk Fluid Enthalpy, kJ/kg
1600 1800 2000 2200 2400 2600 2800
HTC, kW/m
2
K
6
8
12
16
20
28
36
44
56
Heated length
B
u
l
k
f
l
u
i
d
t
e
m
p
e
r
a
t
u
r
e
t
in
t
out
I
n
s
i
d
e
w
a
l
l
t
e
mp
e
r
a
t
u
r
e
Heat transfer coefficient
p
in
=24.0 MPa
G=1000 kg/m
2
s
Q=103 kW
q
ave
= 826 kW/m
2
C381.3t
o
pc
=
H
pc
Dittus - Boelter correlation
DHT
(b) (c)
Fig. 2. Temperature and heat transfer coefficient profiles along heated length of vertical
circular tube (Kirillov et al. 2003): Water, D=10 mm and L
h
=4 m.
Therefore, the following cases can be distinguished at critical and supercritical pressures (for
details, see Figs. 1 and 2):
a. Wall and bulk-fluid temperatures are below a pseudocritical temperature within a part
or the entire heated channel;
b. Wall temperature is above and bulk-fluid temperature is below a pseudocritical
temperature within a part or the entire heated channel;
Heat Transfer to Fluids at Supercritical Pressures
485
c. Wall temperature and bulk fluid temperature is above a pseudocritical temperature
within a part or the entire heated channel;
d. High heat fluxes;
e. Entrance region;
f. Upward and downward flows;
g. Horizontal flows;
h. Effect of gravitational forces at lower mass fluxes; etc.
All these cases can affect the supercritical heat transfer.
Axial length, m
0.0 0.5 1.0 1.5 2.0 2.5 3.0 3.5 4.0
Temperature,
o
C
300
350
400
450
Specific Heat, kJ/kg K
0
10
20
30
40
50
60
70
80
90
100
110
120
130
Prandtl Number
0
2
4
6
8
10
12
14
Viscosity, μPa s
25
30
35
40
45
50
55
60
65
70
75
80
Bulk Fluid Enthapy, kJ/kg
1600 1800 2000 2200 2400 2600 2800
Thermal Conductivity, W/m K
0.10
0.15
0.20
0.25
0.30
0.35
0.40
0.45
0.50
Heated length
C381.3t
o
pc
=
H
pc
Bulk fluid temperature
k
b
μ
b
Pr
b
c
pb
t
in
t
out
p
in
=24.0 MPa, G=1000 kg/m
2
s
Q=103 kW, q
ave
= 826 kW/m
2
Fig. 3. Temperature and thermophysical properties profiles along heated length of vertical
circular tube (operating conditions in this figure correspond to those in Fig. 2c): Water, D=10
mm and L
h
=4 m; thermophysical properties based on bulk-fluid temperature.
3. Parametric trends
3.1 General heat transfer
As it was mentioned above, some researchers suggested that variations in thermophysical
properties near critical and pseudocritical points resulted in the maximum value of Heat
Transfer Coefficient (HTC). Thus, Yamagata et al. (1972) found that for water flowing in
vertical and horizontal tubes, the HTC increases significantly within the pseudocritical
region (Fig. 4). The magnitude of the peak in the HTC decreases with increasing heat flux
and pressure. The maximum HTC values correspond to a bulk-fluid enthalpy, which is
slightly less than the pseudocritical bulk-fluid enthalpy.
Results of Styrikovich et al. (1967) are shown in Fig. 5. Improved and deteriorated heat-
transfer regimes as well as a peak (“hump”) in HTC near the pseudocritical point are clearly
shown in this figure. The deteriorated heat-transfer regime appears within the middle part
of the test section at a heat flux of about 640 kW/m
2
, and it may exist together with the
improved heat-transfer regime at certain conditions (also see Fig. 1). With the further heat-
flux increase, the improved heat-transfer regime is eventually replaced with that of
deteriorated heat transfer.
Heat Transfer - Theoretical Analysis, Experimental Investigations and Industrial Systems
486
p=22.6 MPa
G=1177-1189 kg/m
2
s
D=10 mm
Bulk Fluid Enthalpy, kJ/kg
1000 1500 2000 2500 3000
Heat Transfer Coefficient, kW/m
2
K
0
10
20
30
40
50
60
70
80
Temperature,
o
C
200
300
400
500
q=233 kW/m
2
q=465 kW/m
2
q=698 kW/m
2
q=930 kW/m
2
H
pc
=2103.6 kJ/kg
t
pc
=376.0
o
C
B
u
l
k
F
l
u
i
d
T
e
m
p
e
r
a
t
u
r
e
H
e
a
t
T
r
a
n
s
f
e
r
C
o
e
f
f
i
c
i
e
n
t
s
(a)
p=24.5 MPa
G=1156-1235 kg/m
2
s
D=10 mm
Bulk Fluid Enthalpy, kJ/kg
1000 1500 2000 2500 3000
Heat Transfer Coefficient, kW/m
2
K
0
10
20
30
40
50
60
70
80
Temperature,
o
C
200
300
400
500
q=233 kW/m
2
q=465 kW/m
2
q=698 kW/m
2
q=930 kW/m
2
H
pc
=2148.2 kJ/kg
t
pc
=383.1
o
C
B
u
l
k
f
l
u
i
d
t
e
m
p
e
r
a
t
u
r
e
H
e
a
t
t
r
a
n
s
f
e
r
c
o
e
f
f
i
c
i
e
n
t
s
p=29.4 MPa
G=1114-1126 kg/m
2
s
D=10 mm
Bulk Fluid Enthalpy, kJ/kg
1000 1500 2000 2500 3000
Heat Transfer Coefficient, kW/m
2
K
0
10
20
30
40
50
60
70
80
Temperature,
o
C
200
300
400
500
q=233 kW/m
2
q=465 kW/m
2
q=698 kW/m
2
q=930 kW/m
2
H
pc
=2199.2 kJ/kg
t
pc
=400.0
o
C
B
u
l
k
f
l
u
i
d
t
e
m
p
e
r
a
t
u
r
e
H
e
at
t
r
a
n
s
f
e
r
c
o
ef
f
i
c
i
e
nt
s
(b) (c)
Fig. 4. Heat transfer coefficient vs. bulk-fluid enthalpy in vertical tube with upward flow at
various pressures (Yamagata et al., 1972): Water – (a) p=22.6 MPa; (b) p=24.5 MPa; and (c)
p=29.4 MPa.
Vikhrev et al. (1971, 1967) found that at a mass flux of 495 kg/m
2
s, two types of deteriorated
heat transfer existed (Fig. 6): The first type appeared within the entrance region of the tube L
/ D < 40 – 60; and the second type appeared at any section of the tube, but only within a
certain enthalpy range. In general, the deteriorated heat transfer occurred at high heat
fluxes.
The first type of deteriorated heat transfer observed was due to the flow structure within the
entrance region of the tube. However, this type of deteriorated heat transfer occurred
mainly at low mass fluxes and at high heat fluxes (Fig. 6a,b) and eventually disappeared at
high mass fluxes (Fig. 6c,d).
Heat Transfer to Fluids at Supercritical Pressures
487
Bulk Fluid Enthalpy, kJ/kg
1200 1400 1600 1800 2000 2200 2400 2600
Heat Transfer Coefficient, kW/m
2
K
40
60
80
100
120
140
160
180
200
Temperature,
o
C
270
300
330
360
390
348
523
640
756
872
Heat flux in kW/m
2
p=24.0 MPa
G=700 kg/m
2
s
H
pc
=2138.1 kJ/kg
I
mp
ro
v
e
d
H
e
a
t
T
ra
n
s
f
e
r
D
e
t
e
r
i
o
r
a
t
e
d
H
e
a
t
T
r
a
n
sf
e
r
T
pc
=381.2
o
C
B
u
l
k
F
l
u
i
d
T
e
m
p
e
r
a
tu
r
e
Fig. 5. Variations in heat transfer coefficient values of water flowing in tube (Styrikovich et
al., 1967).
The second type of deteriorated heat transfer occurred when the wall temperature exceeded
the pseudocritical temperature (Fig. 6). According to Vikhrev et al. (1967), the deteriorated
heat transfer appeared when q / G > 0.4 kJ/kg (where q is in kW/m
2
and G is in kg/m
2
s).
This value is close to that suggested by Styrikovich et al. (1967) (q / G > 0.49 kJ/kg).
However, the above-mentioned definitions of two types of deteriorated heat transfer are not
enough for their clear identification.
3.2 Pseudo-boiling and pseudo-film boiling phenomena
Ackerman (1970) investigated heat transfer to water at supercritical pressures flowing in
smooth vertical tubes with and without internal ribs within a wide range of pressures, mass
fluxes, heat fluxes and diameters. He found that pseudo-boiling phenomenon could occur
at supercritical pressures. The pseudo-boiling phenomenon is thought to be due to large
differences in fluid density below the pseudocritical point (high-density fluid, i.e., “liquid”)
and beyond (low-density fluid, i.e., “gas”). This heat-transfer phenomenon was affected
with pressure, bulk-fluid temperature, mass flux, heat flux and tube diameter.
The process of pseudo-film boiling (i.e., low-density fluid prevents high-density fluid from
“rewetting” a heated surface) is similar to film boiling, which occurs at subcritical pressures.
Pseudo-film boiling leads to the deteriorated heat transfer. However, the pseudo-film
boiling phenomenon may not be the only reason for deteriorated heat transfer. Ackerman
noted that unpredictable heat-transfer performance was sometimes observed when the
pseudocritical temperature of the fluid was between the bulk-fluid temperature and the
heated surface temperature.
Kafengaus (1986, 1975), while analyzing data of various fluids (water, ethyl and methyl
alcohols, heptane, etc.), suggested a mechanism for “pseudo-boiling” that accompanies heat
transfer to liquids flowing in small-diameter tubes at supercritical pressures. The onset of
pseudo-boiling was assumed to be associated with the breakdown of a low-density wall
layer that was present at an above-pseudocritical temperature, and with the entrainment of
Heat Transfer - Theoretical Analysis, Experimental Investigations and Industrial Systems
488
individual volumes of the low-density fluid into the cooler (below pseudocritical
temperature) core of the high-density flow, where these low-density volumes collapse with
the generation of pressure pulses. At certain conditions, the frequency of these pulses can
coincide with the frequency of the fluid column in the tube, resulting in resonance and in a
rapid rise in the amplitude of pressure fluctuations. This theory was supported with
experimental results.
Bulk Fluid Enthalpy, kJ/kg
200 400 600 800 1000 1200 1400 1600
Temperature,
o
C
0
100
200
300
400
500
600
q=570 kW/m
2
q=507 kW/m
2
q=454 kW/m
2
q=362 kW/m
2
B
u
l
k
f
l
u
i
d
t
e
m
p
e
r
a
t
u
r
e
I
n
si
d
e
w
a
l
l
t
e
m
p
e
r
a
t
u
r
e
s
Water, p=26.5 MPa, t
pc
=390.2
o
C,
H
pc
=2170 kJ/kg, G=495 kg/m
2
s,
D=20.4 mm, L=6 m
Bulk Fluid Enthalpy, kJ/kg
200 400 600 800 1000 1200 1400 1600
Temperature,
o
C
0
100
200
300
400
HTC, kW/m
2
K
2
3
4
5
6
q=570 kW/m
2
q=507 kW/m
2
q=454 kW/m
2
q=362 kW/m
2
B
u
l
k
f
l
u
i
d
t
e
m
p
e
r
a
t
u
r
e
Water, p=26.5 MPa, G=495 kg/m
2
s,
D=20.4 mm, L=6 m
Heat Transfer Coefficient
(a) (b)
Bulk Fluid Enthalpy, kJ/kg
500 1000 1500 2000 2500
Temperature,
o
C
0
100
200
300
400
500
600
q=1160 kW/m
2
q= 930 kW/m
2
q= 700 kW/m
2
Water, p=26.5 MPa
G=1400 kg/m
2
s
D=20.4 mm, L=6 m
H
pc
=2170 kJ/kg
t
pc
=390.2
o
C
B
u
l
k
f
l
u
i
d
t
e
m
p
e
r
a
t
u
r
e
I
n
s
i
d
e
w
a
l
l
t
e
m
p
e
r
a
t
u
re
s
Bulk Fluid Enthalpy, kJ/kg
500 1000 1500 2000 2500
Temperature,
o
C
0
100
200
300
400
HTC, kW/m
2
K
6
10
14
18
22
26
30
34
38
q=1160 kW/m
2
q= 930 kW/m
2
q= 700 kW/m
2
Water, p=26.5 MPa
G=1400 kg/m
2
s
D=20.4 mm, L=6 m
H
pc
=2170 kJ/kg
t
pc
=390.2
o
C
Bu
l
k
f
l
u
i
d
t
e
m
p
e
ra
t
u
re
Heat transfer coefficient
(c) (d)
Fig. 6. Temperature profiles (a) and (c) and HTC values (b) and (d) along heated length of a
vertical tube (Vikhrev et al., 1967): HTC values were calculated by the authors of the current
chapter using the data from the corresponding figure; several test series were combined in
each curve in figures (c) and (d).
Heat Transfer to Fluids at Supercritical Pressures
489
Bulk Fluid Enthalpy, kJ/kg
1200 1400 1600 1800 2000
Temperature,
o
C
250
300
350
400
450
HTC, kW/m
2
K
4
8
12
16
B
u
l
k
f
l
u
i
d
t
e
m
p
e
r
a
t
u
r
e
I
n
s
i
d
e
wa
l
l
t
e
m
p
e
r
a
t
u
r
e
q=252 kW/m
2
t
pc
=381.6
o
C
Normal heat transfer
Heat transfer coefficient
(a)
q=378 kW/m
2
Enthalpy, kJ/kg
1200 1400 1600 1800 2000
Temperature,
o
C
250
300
350
400
450
HTC, kW/m
2
K
4
8
12
16
20
Pseudocritical temperature
B
u
l
k
f
l
u
i
d
t
e
m
p
e
r
a
t
u
re
I
n
s
i
d
e
w
a
l
l
t
e
m
p
e
r
a
t
u
r
e
Entrance region
Normal heat transfer
Heat transfer coefficient
q=1101 kW/m
2
Bulk Fluid Enthalpy, kJ/kg
1400 1500 1600 1700 1800 1900 2000 2100
Temperature,
o
C
200
300
400
500
600
HTC, kW/m
2
K
4
8
12
16
Inside wall temperature
B
u
l
k
f
l
u
i
d
t
e
m
p
e
r
a
t
u
r
e
Pseudocritical temperature
Entrance region
Heat transfer coefficient
Deteriorated heat transfer
(b) (c)
Fig. 7. Temperature and heat transfer coefficient profiles along 38.1-mm ID smooth vertical
tube at different mass fluxes (Lee and Haller, 1974): Water, p=24.1 MPa, and H
pc
=2140 kJ/kg;
(a) G=542 kg/m
2
s, (b) G=542 kg/m
2
s, and (c) G=1627 kg/m
2
s; HTC values were calculated
by the authors of the current chapter using data from the corresponding figure; several test
series were combined in each curve.
3.3 Horizontal flows
All
3
primary sources of experimental data for heat transfer to water and carbon dioxide
flowing in horizontal test sections are listed in Pioro and Duffey (2007).
3
“All” means all sources found by the authors from a total of 650 references dated mainly from 1950 till
beginning of 2006.
Heat Transfer - Theoretical Analysis, Experimental Investigations and Industrial Systems
490
Krasyakova et al. (1967) found that in a horizontal tube, in addition to the effects of non-
isothermal flow that is relevant to a vertical tube, the effect of gravitational forces is
important. The latter effect leads to the appearance of temperature differences between the
lower and upper parts of the tube. These temperature differences depend on flow enthalpy,
mass flux and heat flux. A temperature difference in a tube cross section was found at G =
300 – 1000 kg/m
2
s and within the investigated range of enthalpies (H
b
= 840 – 2520 kJ/kg).
The temperature difference was directly proportional to increases in heat-flux values. The
effect of mass flux on the temperature difference is the opposite, i.e., with increase in mass
flux the temperature difference decreases. Deteriorated heat transfer was also observed in a
horizontal tube. However, the temperature profile for a horizontal tube at locations of
deteriorated heat transfer differs from that for a vertical tube, being smoother for a
horizontal tube compared to that of a vertical tube with a higher temperature increase on
the upper part of the tube than on the lower part.
3.4 Heat-transfer enhancement
Similar to subcritical pressures, turbulization of flow usually leads to heat-transfer
enhancement at supercritical pressures.
Shiralkar and Griffith (1970) determined both theoretically (for supercritical water) and
experimentally (for supercritical carbon dioxide) the limits for safe operation, in terms of the
maximum heat flux for a particular mass flux. Their experiments with a twisted tape
inserted inside a test section showed that heat transfer was improved by this method. Also,
they found that at high heat fluxes deteriorated heat transfer occurred when the bulk-fluid
temperature was below and the wall temperature was above the pseudocritical temperature.
Findings of Lee and Haller (1974) are shown in Fig. 7. They combined several test series into
one graph. Due to the deteriorated heat-transfer region at the tube exit (one set of data) and
the entrance effect in another set of data, experimental curves discontinue (see Fig. 7b,c). In
general, they found heat flux and tube diameter to be the important parameters affecting
minimum mass-flux limits to prevent pseudo-film boiling. Multi-lead ribbed tubes were
found to be effective in preventing pseudo-film boiling.
3.5 Heat transfer in bundles
SCWRs will be cooled with a light-water coolant at a pressure of about 25 MPa and within a
range of temperatures from 280 – 350°C to 550 – 625°C (inlet and outlet temperatures).
Performing experiments at these conditions and bundle flow geometry is very complicated
and expensive task. Therefore, currently preliminary experiments are performed in
modelling fluids such as carbon dioxide and Freons (Richards et al., 2010). Their
thermophysical properties are well known within a wide range of conditions, including the
supercritical-pressure region (for details, see in Pioro and Duffey (2007) and in Chapter
“Thermophysical Properties at Critical and Supercritical Conditions”).
Experimental data obtained in a bare bundle with 7 circular elements, installed in a
hexagonal flow channel located inside a ceramic insert surrounded by a pressure tube (Fig.
8) and cooled with R-12, are shown in Fig. 9 for reference purposes. The bundle has a 6 + 1
bare-element arrangement with each element being held at the ends to eliminate the use of
spacers. Each of the 7 heating elements has a 9.5-mm outer diameter, and they are spaced
one from another with a pitch of 11.29 mm. The total flow area is 374.0 mm
2
, wetted
perimeter – 318.7 mm, and hydraulic-equivalent diameter – 4.69 mm.
Heat Transfer to Fluids at Supercritical Pressures
491
(a) (b) (c)
Fig. 8. Flow-channel cross sections: (a) with dimensions; (b) with elements numbering, and
(c) with thermocouple layout.
(a) (b)
Fig. 9. Bulk-fluid and sheath-temperature profiles along bundle heated length: (a) normal
heat-transfer regime; and (b) normal and deteriorated heat-transfer regimes.
The main test-section components are cylindrical heated elements installed tightly in the
vertical hexagonal shell (downward flow). The entire internal setup is contained by a
cylindrical 40 × 4 mm pressure tube with welded flanges at the edges that form the upper
(inlet) chamber and lower (outlet) chamber, with a total heated length of 1000 mm. Four
thermocouples installed into the top and bottom chambers were used to measure Freon-12
inlet and outlet temperatures. Basic parameters of the experimental setup are listed in
Table 1.
The experiments showed that at certain operating conditions the deteriorated heat-transfer
regime is possible not only in bare tubes, but also in “bare” bundles. This is the important
statement, because previously deteriorated heat-transfer regimes have not been encountered
in supercritical water-cooled bundles with helical fins (Pioro and Duffey, 2007).
Heat Transfer - Theoretical Analysis, Experimental Investigations and Industrial Systems
492
Pressure Up to 5.0 MPa (equivalent to 25.5 MPa for water)
Temperature of Freon-12
Up to 120°С (400°С heating elements)
Maximum flow rate 20 + 20 m
3
/h
Maximum pump pressure head 1.0 + 1.0 MPa
Experimental test-section power Up to 1 MW
Experimental test-section height Up to 8 m
Data Acquisition System (DAS) Up to 256 channels
Table 1. Main parameters of 7-element bare bundle cooled with R-12.
4. Practical prediction methods for convection heat transfer at supercritical
pressures
4.1 Circular vertical tubes
Unfortunately, satisfactory analytical methods have not yet been developed due to the
difficulty in dealing with steep property variations, especially, in turbulent flows and at
high heat fluxes. Therefore, generalized correlations based on experimental data are used for
HTC calculations at supercritical pressures.
There are a lot of various correlations for convection heat transfer in circular tubes at
supercritical pressures (for details, see in Pioro and Duffey (2007)). However, an analysis of
these correlations showed that they are more or less accurate only within a particular
dataset, which was used to derive the correlation, but show a significant deviation in
predicting other experimental data. Therefore, only selected correlations are listed below.
In general, many of these correlations are based on the conventional Dittus-Boelter-type
correlation (see Eq. (1)) in which the regular specific heat is replaced with the cross-section
averaged specific heat within the range of (T
w
– T
b
);
wb
wb
HH
TT
⎛⎞
−
⎜⎟
−
⎝⎠
, J/kg K (see Fig. 8). Also,
additional terms, such as:
;;
km n
bb b
ww w
k
k
μρ
μρ
⎛⎞⎛ ⎞⎛⎞
⎜⎟⎜ ⎟⎜⎟
⎝⎠⎝ ⎠⎝⎠
; etc., can be added into correlations to
account for significant variations in thermophysical properties within a cross section, due to
a non-uniform temperature profile, i.e., due to heat flux.
It should be noted that usually generalized correlations, which contain fluid properties at
the wall temperature, require iterations to be solved, because there are two unknowns: 1)
HTC and 2) the corresponding wall temperature. Therefore, the initial wall-temperature
value at which fluid properties will be estimated should be “guessed” to start iterations.
The most widely used heat-transfer correlation at subcritical pressures for forced convection
is the Dittus-Boelter (1930) correlation (Pioro and Duffey, 2007). In 1942, McAdams
proposed to use the Dittus-Boelter correlation in the following form, for forced-convective
heat transfer in turbulent flows at subcritical pressures:
0.8 0.4
bbb
Nu 0 0243 Re Pr.=
. (1)
However, it was noted that Eq. (1) might produce unrealistic results within some flow
conditions (see Figs. 1 and 2), especially, near the critical and pseudocritical points, because
it is very sensitive to properties variations.
In general, experimental heat transfer coefficient values show just a moderate increase
within the pseudocritical region. This increase depends on flow conditions and heat flux:
Heat Transfer to Fluids at Supercritical Pressures
493
higher heat flux – less increase. Thus, the bulk-fluid temperature might not be the best
characteristic temperature at which all thermophysical properties should be evaluated.
Therefore, the cross-sectional averaged Prandtl number (see below), which accounts for
thermophysical properties variations within a cross section due to heat flux, was proposed
to be used in many supercritical heat-transfer correlations instead of the regular Prandtl
number. Nevertheless, this classical correlation (Eq. (1)) was used extensively as a basis for
various supercritical heat-transfer correlations.
In 1964, Bishop et al. conducted experiments in supercritical water flowing upward inside
bare tubes and annuli within the following range of operating parameters: P=22.8 – 27.6
MPa, T
b
= 282 – 527ºC, G = 651 – 3662 kg/m
2
s and q = 0.31 – 3.46 MW/m
2
. Their data for heat
transfer in tubes were generalized using the following correlation with a fit of ±15%:
0.43
0.66
0.9
Nu 0.0069Re Pr 1 2.4
w
b
bb
b
D
x
ρ
ρ
⎛⎞
⎛⎞
=+
⎜⎟
⎜⎟
⎝⎠
⎝⎠
. (2)
Equation (2) uses the cross-sectional averaged Prandtl number, and the last term in the
correlation: (1+2.4 D/x), accounts for the entrance-region effect. However, in the present
comparison, the Bishop et al. correlation was used without the entrance-region term as the
other correlations (see Eqs. (1), (3) and (4)).
In 1965, Swenson et al. found that conventional correlations, which use a bulk-fluid
temperature as a basis for calculating the majority of thermophysical properties, were not
always accurate. They have suggested the following correlation in which the majority of
thermophysical properties are based on a wall temperature:
0.231
0.613
0.923
w
ww
Nu 0.00459 Re Pr
w
b
ρ
ρ
⎛⎞
=
⎜⎟
⎝⎠
. (3)
Equation (3) was obtained within the following range: pressure 22.8 − 41.4 MPa, bulk-fluid
temperature 75 − 576ºC, wall temperature 93 − 649ºC and mass flux 542 − 2150 kg/m
2
s; and
predicts experimental data within ±15%.
In 2002, Jackson modified the original correlation of Krasnoshchekov et al. from 1967 for
forced-convective heat transfer in water and carbon dioxide at supercritical pressures, to
employ the Dittus-Boelter-type form for
Nu
0
as the following:
0.3
0.82 0.5
bbb
Nu 0.0183 Re Pr
n
p
w
bpb
c
c
ρ
ρ
⎛⎞
⎛⎞
⎜⎟
=
⎜⎟
⎜⎟
⎝⎠
⎝⎠
, (4)
where the exponent n is defined as following:
n = 0.4 for T
b
< T
w
< T
pc
and for 1.2 T
pc
< T
b
< T
w
;
0.4 0.2 1
w
pc
T
n
T
⎛⎞
⎜⎟
=
+−
⎜⎟
⎝⎠
for T
b
< T
pc
< T
w
; and
0.4 0.2 1 1 5 1
wb
pc pc
TT
n
TT
⎡
⎤
⎛⎞⎛⎞
⎢
⎥
⎜⎟⎜⎟
=+ − − −
⎜⎟⎜⎟
⎢
⎥
⎝⎠⎝⎠
⎣
⎦
for T
pc
< T
b
< 1.2 T
pc
and T
b
< T
w
.