Laser Pulse Phenomena and Applications Part 7 pot
Bạn đang xem bản rút gọn của tài liệu. Xem và tải ngay bản đầy đủ của tài liệu tại đây (5.51 MB, 30 trang )
Laser Pulses Characterization with Pyroelectric Sensors
171
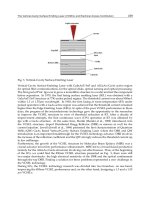
experimental detector pulse time response of 24 μs to a simulated 17 μs rising edge of a
Nd-YAG laser pulse is shown in Figure 7. By a fitting process based on the root mean square
error the model parameters can be retrieved with good accuracy .
Fig. 7. Comparison of pyroelectric sensor normalized voltage response between simulated
model and experimental sensor.
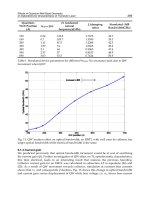
Several single-element detectors were built, which were able to follow laser pulses with rise
time up to 0.003 ms. Figure 8 shows an example of the time response to a CO
2
laser pulse for
the values reported in Table 2.
0 0.005 0.01 0.015 0.02
-0.06
-0.04
-0.02
0
0.02
0.04
0.06
0.08
0.1
0.12
Time (s)
Fig. 8. Pyroelectric signal in response to a pulsed CO
2
laser
___ Experimental
Tsettling (1/e) = 24μs
°°°° Simulation
Tsettling (1/e) = 17μs
Laser Pulse Phenomena and Applications
172
Active area of detector 9 mm
2
Thickness(PVDF)
40 μm
Gold metallisation
0.1 μm
Z
el
Ra= 1 MΩ parallel with Cc= 15 pF
Pulsed laser characteristics
PRF 50 Hz
Duty cycle 22%
Table 2. Parameter values characterising detector and laser source for the measurement
shown in Figure 8
The time response is characterized by a rising time 0.2 ms like that of the laser pulse and the
undershot is characteristic of a rapid cut-off. The recovery time (7 ms at 1/e of Vout max) is
governed by the detector thermal time constant R
T
C
T
.
The settling time to zero value is mainly determined by the undershoot and it is
approximately 15 ms.
This basic example demonstrates the feasibility of the pyrolectric PVDF film sensor
technology for monitoring IR laser pulses (Capineri et. al., 1992). Another technology that
has been demonstrated useful for sensor fabrication availed of a screen printed pyroelectric
paste (Capineri
b
et al., 2004). Both pyroelectric materials have been employed to design and
build array of sensors with different configuration and size, depending on the application
(Capineri et al. 1998)(Capineri et al., 2005)(Mazzoni et al.,2007). Some example of
pyroelectric arrays used to design monitoring devices for CO
2
power laser systems are
described in the following section.
3. Technologies for PVDF pyroelectric sensor arrays
Commercially available pyroelectric arrays mostly employ ferroelectric materials as BST,
PbSe, LiNbO
3
and LiTaO
3
. These sensors are fabricated with technologies which are
compatible with integrated electronics. Their spatial resolution is determined by the pitch
between elements, typically 50 μm wide for arrays in the order of 320x240 pixels. Their
performances in terms of sensitivity and NEP are suitable for thermal imaging applications
and for remote temperature measurements (Muralt, 1996)(Capineri
b
, 2004). The aim of this
section is to describe enabling technologies for the development of low-cost pyroelectric
sensor arrays for the beam characterization of CO
2
power lasers (λ=10.6 μm). A low-cost
pyroelectric material PVDF is commercially available in the form of thin foils that can be
metalized by means of evaporation or sputtering. The polymer foils are mechanically
flexible and necessitates of fabrication technologies suitable for realizing the electrical
contacts; rigid carrier substrates and low temperature conductive epoxy are usually
employed for this aim. In this section, we describe some solutions that exploit printed
circuits boards technology. The array of sensors should sustain relatively high power
densities even if a beam power partitioning system is considered. Experimental
characterization of sensors with PVDF foils with gold metallization in different conditions of
laser pulses (peak power, duty cycle and pulse repetition frequency), showed that an
average power density of 1 W/cm
2
should not be exceeded. An array element pitch of 1 mm
was estimated sufficient to detect most of the significant anomalies of the laser beam
intensity spatial distribution of a CO
2
, 40 W continuos power laser.
Laser Pulses Characterization with Pyroelectric Sensors
173
A fabrication technology that can be adopted for a fast production of small series of sensors
is the laser ablation (Capineri
a
et al. , 2004). In the following we describe the main features of
the laser microfabrication for patterning electrodes on the film, and the line connections
routing strategy. Two examples are shown: a matrix array (8x8 elements, pitch 1.45 mm)
and a linear array (10x1 elements, pitch 1 mm). Preliminary experimental results on laser
microdrilling of the PVDF material will be presented for microvias fabrication aimed to
make individual contacts of each front electrode element. For the packaging we adopted the
bonding of the sensor array to printed circuit boards and standard connectors for the
external contacts to the front-end electronics board.
3.1 Laser microfabrication for ferroelectric polymer (PVDF) sensors
Polymer ferroelectric materials like PVDF are now commercially available from several
manufacturers and are used for fabricating pyroelectric and ultrasonic piezoelectric sensors
(Binnie et al., 2000)(Ritter et al. 2001). The relative merit of polymers respect to ceramics is
their low weigh, mechanical flexibility, non reactivity to chemical agents and relative low
cost with respect to piezoelectric ceramics. On the contrary, they have a limited operating
range (T
MAX
=80°C) and generally a lower figure of merit with respect to other piezoelectric
or pyroelectric materials (De Cicco et al., 1999). In our application the choice of PVDF was
mandatory for the large area required to monitor the position and intensity spatial
distribution of a laser spot of about 1 cm
2
.
Fig. 9. Example of laser ablation of a set of parallel lines at two different separation distances
S on a 40μm thick gold metallized PVDF film: (Left) S
1
=150 μm , (Right) S
2
=100 μm.
Considering the high incident power available, the sensor current responsivity requirements
are not stringent and the transimpedance amplifiers can be designed with feedback
impedances in the range 10MΩ-1GΩ; these values are not so large to be influenced by
parasitic capacitances due to circuit layout or connection lines through the packaging. For
the temporal diagnostics of the CO
2
laser pulses a response time better than 10 μs is needed.
The use of a plastic film as active pyroelectric material requires a suitable technology to
transfer the design of the electrodes pattern on one or both sides of the film. The routing of
electrical lines from the central elements of the matrix array to the external connector pins
asked also for solutions adequate to the element miniaturization which needs line width
negligible respect to the element size. In our approach we used a Nd:YAG laser (λ=1.064μm)
marking tool (mod. Lasit, EL.EN. s.p.a., Italy) to ablate the metallizations of the PVDF film
which are typically made with gold, aluminum, or even conductive silver ink, according to
the optical and electrical requirements. The process has been developed for metallization
Laser Pulse Phenomena and Applications
174
with thickness ranging from 0.1μm to 10μm which are typical of evaporation and screen-
printing respectively. The laser ablation process needs to be optimized by successive
refinements of the laser marking parameters such as the pulse repetition frequency, laser
pumping current, pulse duration and focal distance. The laser setting was tuned according
to the trace width (microfabrication features), the minimum induced mechanical film
damage, the process repeatability and the electrodes design flexibility.
An interesting characteristic of the laser microfabrication is the contemporary ablation of the
metallization on both sides of the film (Capineri
a
et al., 2004). After the ablation of the front
electrodes metallization, the laser beam reaches the bottom side of the PVDF film without
being absorbed by the bulk. This is possible due to the low absorption of the thin PVDF film at
the Nd:YAG emission wavelength. In this way the patterning of the electrodes on both sides is
attained with only one laser ablation run. The replica of the same pattern on both sides of the
PVDF film is useful when differential connections to individual elements of the array are
needed; differential transimpedance amplifiers can be employed for improving the common
mode noise rejection as shown in Figure 6. The laser microfabrication method has been
successfully demonstrated for different PVDF film thickness ranging from 9 μm to 110 μm.
In Figure 9 the results of a spatial resolution test is shown. The minimum distance S between
two lines or two array elements should result higher than about S = 140 μm. In Figure 10,
the zoom over a portion of the linear array reported in Figure 11(A) shows a detail of the
gold metallized areas with rounded ablated corners.
200µm
140µm
Fig. 10. Example of electrodes patterning by laser ablation.
Because of the low capability of this type of film to sustain overheating beyond 80°C, a
study was performed to verify the presence of an eventual damage to the PVDF material. In
particular, we compared the pyroelectric responses of single elements obtained by two
different techniques, i.e. laser ablation and gold metal evaporation. No significant difference
was observed. Some examples of fabricated pyroelectric arrays on 40 μm thick gold
metallized PVDF film are reported in Figure 11 (A) and (B).
In Figure 11(A) the box indicates the active area of a linear array with 10x1 elements of
dimensions 0.9x2mm
2
each, pitch 1 mm and connection lines width 0.2 mm. Four such
Laser Pulses Characterization with Pyroelectric Sensors
175
arrays were mounted at 90° angle on an electronic board in order to monitor the position
and dimensions of a CO
2
laser beam in real-time. In Figure 11 (B) a fine pitch matrix array
for beam spatial intensity distribution measurements is shown; it is provided with 8x8
elements, of area 1.25x1.25mm
2
and pitch 1.45 mm.
11.6mm
B
25.4mm
8mm
A
Fig. 11. A) AUTOCAD drawing for design the electrodes geometry of a linear array (top)
and resulting sensor microfabrication (bottom). The rectangle in red color indicates the array
of 10 active elements. B) matrix array: 8x8 square elements, side 1.25 mm, pitch 1.45mm.
The solution adopted for bonding the PVDF pyroelectric arrays to a rigid substrate utilizes
two PCBs, called here top and bottom Printed Circuit Boards (PCB), called here top and
bottom PCBs. The electrical connections between the film and PCBs are obtained by
conductive epoxy (type EP21TDC/N, MasterBond, USA) and curing at room temperature.
The PCBs have copper pads which overlap the gold pads on the PVDF film. This bonding
technique proven to be reliable having used the sensors over a period of at least two years
with no change in characteristics and performances. The routing from the external pads
towards the active elements is not a problem for the linear array geometry.
On the contrary, the routing of the connection lines of the two-dimensional array poses the
problem of individually contacting the front electrodes exposed to the radiation. Moreover,
the connection line surface acts as a spurious sensor that creates cross-talk effects and ghost
signals at the outputs of the sensor array. At present, our laser microfabrication technology
with a Nd:Yag laser (not specifically devoted to this application) provides an ablated line
width of 140 μm, which is the minimum pitch between matrix elements or conducting lines.
Looking for novel solutions to this problem, we investigated a new structure for assembling
matrix arrays that retains the advantages of the laser microfabrication and the packaging
techniques previously described. We also developed a fabrication process for electrodes
patterning on a PVDF film metallized only on one side. The opposite side was metallized in
a second step by evaporating a single continuos semitransparent gold electrode of thickness
less than 100 nm. This process provides a common front electrode for all elements which is
connected to a top PCB and then to ground. The exposure of this front electrode to the
incident beam occurs through a protection window (ZnSe or Ge) in the top PCB (see Figure
12). The front common electrode is grounded and the 64 single ended transimpedance
amplifiers are connected by a standard PGA 84 pin connector.
The PVDF sensor was then bonded on the 64 central pads of the bottom PCB by using a
programmable robot provided with a dispenser. This step of the fabrication is critical
Laser Pulse Phenomena and Applications
176
because the uniformity and reliability of the bonding process can be easily affected by the
conductive epoxy viscosity variability during the dispensing and curing phases. The
sandwich of the two PCBs and sensor in between is then soldered to the PGA 84 pins
connector. The photo in Figure 13 shows one prototype of the matrix pyroelectric array.
TOP
BOTTOM
Fig. 12. Assembly for the pyroelectric matrix array.
Fig. 13. Packaging for the pyroelectric matrix array.
The 64 elements matrix array have been characterized in terms of voltage responsivity and
response uniformity. A thermal cross-talk ranging from -33dB to -41dB was found in the
frequency range 10Hz-200Hz. The diagram in Figure 14 is an example of measured cross-
talk on one element with side L=2.25 mm. It was obtained with a modulated laser diode at
repetition frequency of 185 Hz and a laser spot diameter 500 μm. The results indicate that
the lateral heat conduction of the front semi-transparent electrode is modest. We also found
that it is slightly dependent on the beam modulation frequency. However, in the perspective
of increasing the number of elements, the modification of the original design of the matrix
array will consist of square elements in the front electrode contacted to a bottom PCB
Laser Pulses Characterization with Pyroelectric Sensors
177
through microvias. A reasonable value for the microvias diameter is in the range 10-50 μm,
according to the minimized pitch of the array. Preliminary results of microdrilling with a
duplicated Nd:YAG source have produced a line of through holes with diameters ranging
from 20μm to 40μm (see Figure 15). The variation of the holes diameter is due to different
settings during the laser process. Similar processing methods have been also explored more
recently from other authors (Rabindra et al., 2008) (Lee et al., 2008).
Fig. 14. Cross-talk measured on a single element at laser beam modulation frequency of
185 Hz.
Fig. 15. Laser microdrilling through a 40 μm thick gold metallized PVDF film. The holes
diameter varies from 20μm to 40μm.
4. Applications of PVDF pyroelectric array of sensors for CO
2
laser
monitoring
In this section we explore the main applications of pyroelctric arrays in a linear and matrix
configuration.
Pyroelectric sensor linear arrays of PVDF were found particularly suitable for the control of
the spot dimensions of high power infrared laser beams. The sensors were tested for
maximum power density in temporal cycles of tenths hours each.
We designed an optoelectronic instrument for the on line measure of the dimensions of the
laser spot emitted by a multikilowatt CO
2
industrial laser. Due to the high power and long
service time the optical components are subjected to thermal stresses which cause variation
of the laser beam characteristics (shape and position).
Laser Pulse Phenomena and Applications
178
In Figure 16 we show the schematic diagram of the experimental apparatus which consists
of the laser source, a beam expander, a beam deflector and a focussing lens. The main beam
of continuos power Pi is sampled after the beam expander by using a diffractive optics
which splits the beam into a reflected beam, of power Pr=98.8% Pi, and a sampled beam of
lower power and equal to 0.5% Pi. This low power beam of about 15 W (for a Pi=3 kW) has
a typical diameter of 25 mm and follows the variations of the main one. We could measure
its dimensions along two perpendicular directions with the linear array configuration
shown in figure 17. The minimum required spatial resolution was 1mm and the variation of
the dimensions were in the range of 20 mm – 30 mm.
We verified the damage threshold of the sensors made of gold metallized PVDF film with
an experimental set-up in which the power density on the sensor was varied by changing
the repetition frequency and duty cycle of an average power equal to 30 W which was
delivered by the CO
2
laser source. A single sensor was irradiated through a metal
diaphragm in cycles lasting tenths of hours each at increasing power density ranging from
0.15 W/cm
2
to 3 W/cm
2
. The voltage response of the sensor was tested during each phase
and the results are shown in Figure 18. The sensor response remained constant for a fixed
value of the power density and it decreased for higher power density values owing to the
increase of the sensor average temperature. At a value of 3.6 W/cm
2
we observed the
destruction of the sensor, hence we safely reduced the power threshold value to 3 W/cm
2
.
In Figure 19, we show an assembled linear array prototype; each of the four arrays is
composed of ten elements with pitch 1 mm. Other measured characteristics of the fabricated
linear array sensors are:
• Thermal cross-talk better than -40 dB at 200 Hz
•
Bandwidth (-3dB): 257 Hz
•
Current responsivity max: 190nA/W
The linear arrays in cross configuration have been experimented for real-time beam
diameter monitoring but their use was extended also to laser power monitoring according to
their useful bandwidth. It has been demonstrated that at fixed pulsed repetition frequency
these sensors provide a reliable estimation of the incident laser power. Moreover, the
fabrication technology explained in the previuos section, allowed the realization of pitches
between elements of about 150 μm. This value is adequate also for real-time imaging of
power laser beams by devising a rotating reflector that scanned the beam section at an
angular velocity adequate for granting an accurate imaging of the laser pulse (Coutouly et
al., 1999)(Akitt et al., 1992)(Mann et al., 2002), (Mazzoni et al., 2007).
4.1 Dual use of pyroelectric arrays for CO
2
and Nd:YAG laser pulses: laser pulse
characterization and beam positioning
Industrial and medical CO
2
laser equipment are controlled for the optimization of the power
emission according to the process. This normally implies two operation modes: continuous
(CW) and pulsed (PW). In both cases it is important to monitor some beam parameters in
real-time for maintaining the quality of the process or for diagnostic purposes (to check the
functional anomalies). For both modes sensors are necessary that can operate at the laser
wavelength (mid-IR) with an electronic instrument suitable for acquiring, processing and
visualizing the beam parameters. The considered parameters were: the beam point stability,
the beam spatial intensity distribution and the laser pulse shape related to the instantaneous
emitted power. The measurements of these parameters are standardized (ISOFDIS
Laser Pulses Characterization with Pyroelectric Sensors
179
11146,11670,11554) and each one requires specific characteristic of the sensor and processing
electronics. The pyroelectric array of sensors described in the previuos sections are suitable
for these applications and represent a good compromise between cost and performances.
Material
under
procecssing
Specchio di
Deflessione
CO
2
laser source
E
L
.E n. C 30 00
M
ain beam
Pi=300 0W
Fascio
Riflesso
Pr
≈
3000W
Beam
expander
Sa m p l e d b ea m
0.5 % P i
m
irr or
Diffractive
Reflected
beam
98.8% Pi
Pr=2964W
Chopper
Mechanical
Pyroe lectric sensor and
Data acquisition board
PC
Fig. 16. Schematic diagram of diagnostic system of laser beam dimensions.
D
max
Dmin
Fig. 17. Configuration of linear arrays for measuring the beam dimensions in the range
Dmin-Dmax.
Laser Pulse Phenomena and Applications
180
0
0,4
0,8
1,2
1,6
2
2,4
2,8
0 20 40 60 80 100 120 140 160 180
TESTING CYCLE TIME [hours]
VOLTAGE RESPONSE [Vcm²/W]
0.15W/cm²
0.4W/cm²
0.7W/cm²
1W/cm²
2W/cm²
2.6W/cm²
3W/cm²
Fig. 18. Voltage response for different incident power densities during life tests.
Fig. 19. Assembled linear array of 10x1 elements.
Laser Pulses Characterization with Pyroelectric Sensors
181
In this section it will be shown that a versatile instrument can be interfaced to different
measuring modules provided with linear or matrix arrays of pyroelectric sensors. The two
measuring modules were: Module “BeamScan64” for the laser spatial intensity
characterization, and Module “PosIRix” for the laser beam point stability and pulse shape
characterization (Capineri et al. 1999)(Capineri et al., 2005). The architecture can be
replicated with other choices of the analog electronic components and with a
microcontroller with upgraded performances.
4.2 Portable electronic instrument architecture
The instrument operates in a stand-alone mode and automatically switches the running
program depending on the connected external module. The analog signals from up to 64
channels are digitally converted by two parallel ADCs on chip of a microcontroller Hitachi
SH7044 and presented on a QVGA LCD with 256 colors. The instrument was tested with
two sensor modules: an 8x8 matrix array for laser beam mapping with 64 high gain (1GΩ)
transimpedance amplifiers, and a large area four-quadrant sensor for the beam point
stability (Capineri et al. ,1999) control and laser pulse monitoring. The complete architecture
of the analog-to-digital mother board is shown in Figure 20 and a photo of the prototype
system is shown in Figure 22. The instrument is interfaced to external modules by a versatile
bus (V-Bus) that includes several I/O digital lines, 64 analog lines, and several auxiliary
lines for power supplies and remote sensing/controls. Inputs for an automatic identification
of the plugged-in modules were also provided.
LCD &
LCD &
Keyboard
Keyboard
Digital
Digital
card:
card:
μ
μ
C, SED,
C, SED,
Memory
Memory
Dimm
Dimm
-168
-168
Flat
Flat
-40
-40
SCSI-100
SCSI-100
SMPS
SMPS
+12 V +5 V -5 V
2 SCI (DB9)
2 SCI (DB9)
Measurement card
Voltage generator
+3.3 V
to
to
PC
PC
RS-232
Voltage generator
[+25 V÷+27 V]
24
Antialiasing filter (f
T
=160 Hz)
BNC
BNC
Schmitt’s trigger
Multiplexer 64:8
Offset generator
8
Laser synchronism
4
3
23
1
Header
Header
-4
-4
Reset generator
64 23
V-BUS
V-BUS
64
8
1
4
64
Fig. 20. Block scheme of the mother board of the electronic instrument
Laser Pulse Phenomena and Applications
182
Display
Display
and keyboard
and keyboard
Module
“PosIRix”
Switching Mode
Power Supply
Motherboard
Motherboard
Digital board
Digital board
Shielded cable
Shielded cable
V-BUS
V-BUS
Fig. 21. Photograph of the components of the electronic instrument for IR laser beam
characterisation
Fig. 22. Electronic board of the module PosIRix. In the bottom side, the DB5 type connector
for the instrument V-Bus connection is sided in a central position; on the left side is shown
the BNC connector for laser pulse monitoring by an oscilloscope. On the top left a 28mm x
28 mm PVDF four quadrant sensor with a circular ZnSe window for spectral filtering the
CO
2
wavelength.
Laser Pulses Characterization with Pyroelectric Sensors
183
5. Module “PosIRix” for laser beam point stability and pulse shape characterization
This module consists of a 28 mm x 28 mm sensor divided in four quadrants by laser ablation
of a gold metallized PVDF ferroelectric film of thickness equal to 40 μm. The pyroelectric
material was bonded to a FR-4 epoxy rigid substrate with thermal conductive glue. The
substrate was also used to make electrical contacts with bottom electrodes. The sensor
fabrication was optimized in order to achieve the maximum sustainable power density
D
PMAX
and the maximum bandwidth of the voltage responsivity BW
MAX
. This choice of the
sensor design parameters (dimensions, substrate, bonding) is an example of good
compromise among cost, bandwidth, sustainable power density and mechanical robustness.
The sensor and front-end electronics were characterised with different powers, duty cycles
and pulse repetition frequencies of a CO
2
laser source. Values of D
PMAX
=2W/cm
2
and
BW
MAX
(-3dB) =18 kHz were found with a 4.4 MΩ transimpedance amplifier. We also
demonstrated the adaptability of this sensor to a specific medical application of the laser by
designing an electronic equalization filter of the amplitude of the frequency response in
order to achieve a flat bandwidth (±1dB) between 10Hz and 18 kHz. In this way the laser
pulse shape was reproduced with high fidelity, even for PRF as low as 10 Hz, in a range
where the responsivity of the sensor is not flat. Two examples are reported in Figure 23 and
24. They show the reconstruction of the pulse shape of a CO
2
laser modulated at a PRF equal
to 30 Hz and 100 Hz, respectively. In the same figures, we showed the response measured
with a large bandwidth (20 MHz), small-size (i.e. 1mm
2
), commercial HgCdTe photovoltaic
sensor for comparison.
0.005 0.01 0.015 0.02 0.025 0.03 0.035 0.04 0.045
-1.5
-1
-0.5
0
0.5
1
TIME (s)
Normalized Amplitude
Sensor HgCdTe
Sensor PVDF
Fig. 23. CO
2
Laser pulse shape at PRF 30 Hz.
Laser Pulse Phenomena and Applications
184
0.0085 0.009 0.0095 0.01 0.0105 0.011 0.0115 0.012
-0.2
0
0.2
0.4
0.6
0.8
1
TIME (s)
Normalized Amplitude
Sensor HgCdTe
Sensor PVDF
Fig. 24. CO
2
Laser pulse shape at PRF 100 Hz.
The same module was also used for monitoring the laser beam point stability by designing a
programmable narrow band filter centered at the PRF of the laser source; this narrowband
signal was digitized and fed to an algorithm that estimates the centroid of the intensity
spatial distribution on the sensor plane (Capineri et al. 1999) with four quadrant signals. The
algorithm is implemented on the microcontroller used in the portable instrument described
in Section 4.2. The complete block scheme of this module is reported in Figure 25.
Σ
4x
A
mplifier
T
ransimpedance
A
R
=4.2 M
Ω
B(-3dB)=28 kHz
4
X
programmable
narrow band filte
r
A
nalog
Equalize
r
Filter
4QUADRANTS PVDF SENSOR:
• 25mm x 25mm
• Au+Pt metallization
• Separation of elements by laser
ablation
V-Bus
“
BeaMeter
”
1
44 4
12
1
Fig. 25. Electronic analog signal processing carried out by module “PosIRix”.
5.1 Signal filtering for limited bandwidth sensors
Two new implementations were developed for the processing and visualization of signals
generated by PVDF pyroelectric sensor arrays with compensation filtering (Capineri et al.
2005) aimed to improve the reconstruction accuracy of CO
2
laser pulses. These
implementations were especially devoted to biomedical applications for which there is a
stringent demand for an accurate reproduction of both the fast and slow components of the
laser pulse for the evaluation of the intensity in these two temporal regimes. The
Laser Pulses Characterization with Pyroelectric Sensors
185
implementations were realised for the module “Posirix” which was described in the
previous section. It was primarily designed for laser beam positioning and allows the
visulization of the laser pulse by an oscilloscope or by a dedicated instrument with real-time
display. For the laser pulse envelope evaluation we used the sum of the signals from the
four pixels to make the first temporal information independent of the beam centroid
position within the sensor matrix array. For this solution, a requirement for achieving an
accurate pulse reconstruction are four elements with the same frequency response.
5.2 Design of the analog filter
For the filter project of the bandwidth limited sensor we used the ideal compensation filter
consisting in the classical inverse filter H
c
(f) defined as:
()
()
C
K
Hf
H
f
= (3)
where K is a gain factor for a flat
frequency response of the summing amplifier, and H(f) is
the sensor voltage frequency response. For the fitting function H
fit
we used a bi-quadratic
form in order to keep its realization simple by means of an analog filter. The fitting program
was developed in Matlab (Mathworks, USA) and calculated the vector of coefficients a
i
of
the biquadratic function
resulting from the minimization of the mean square error (err). This
program required the following input parameters:
•
a vector with the initial values of a
i
;
•
the frequency values fmin and fmax delimiting the range for the fitting of H
fit
(f) with
H
C
(f);
•
the vector with input data H
c
(f) interpolated in the range 1Hz – 50 kHz at 10 Hz steps.
•
the tolerance on the functional value (err) and on the coefficient values a
i
, the maximum
number of iterations and of elaboration on err.
The vector
with the initial a
i
values was found with a trial procedure of few iterations using
the minimization function “fminsearch” which starts from an initial guess of the coefficients
and a rather high tolerance value to grant an uniform error density also in the frequency
region with less data The program progressively decreases the tolerance value to increase
the precision in the determination of the optimal vector of coefficients a
i
.
The values fmin and fmax have been chosen to get a small ripple in the sensor bandwidth,
particularly sensitive to the pole positions. After some trials they were set to 100 Hz and 7
kHz, respectively, so as it was impossible to cover the full range with only one biquadratic
function. We had to use another filter function to complete the filter project.
For obtaining the complete transfer function of the compensation filter, we found the
biquaquadratic coefficients for the following function,
2
1
()
() ()
fit
fit
Hf
Hf H f
=
⋅
(4)
that we multiplied by the “high frequency” filter function H
fit
(f) to find the final filter
function. By using the procedure described above to cover the remaining “low frequency”
regions, the fmin and fmax values were set to 15 Hz and 250 Hz this time, with a
superposition of the minimizing frequencies ranges of the two fitting functions of about 150
Hz. The final fitting function H
filt
(S=j2
π
f) resulted:
Laser Pulse Phenomena and Applications
186
43 72 9
443729 9
1,89 48957 2,16 10 3,06 10 5,04
()
3,82 10 1,79 10 1,89 10 3,25 10
filt
SS S S
HS
SSSS
++⋅+⋅+
=
+⋅ +⋅ +⋅+⋅
. (5)
With H
filt
the compensated filter bandwidth at –3dB extended from 4.4 Hz to 17.8 kHz with a
ripple in band of 0.43 dB.
The function can be factorized into four terms which have a direct
correspondence with the
four building blocks A, B, C, D shown in Figure 26.
The analog design considered components values and tolerances commercially available,
and it was started from a six order function H
cf
with two nearly equal poles and zeroes that
allowed more flexibility and no substantial filtering performance variation as shown in
Figure 27.
5.3 Design of the digital filter
The digital filtering has the advantage of a circuit reduced dimension and uses the same
analytical transfer function found for the analog implementation. Its capability is limited by
the Hitachi SH2 microprocessor implementation on board of the same instrument. With a
128kByte RAM it is possible to use only numerical filter of the type IIR for their reduced
computational request with respect to FIR ones. Furthermore, owing to the precision
limitation to 32 bit of the microprocessor, the implementation of the transfer function
resulting from the bilinear transformation of the sampled H
filt
(f) function at f
sampl
=115.2 kHz
requires an accurate analysis of the zeroes and poles position for the filter stability
determination. We found that this implementation made the low frequency filtering worse
and required the elimination of a zero-pole couple on the unitary circle corresponding to a
frequency of about 10 Hz. We also evaluated the artefacts introduced in the transformation
from the analog to the digital masks consisting in modulus and phase differences between
the implemented and bilinearly transformed functions above 20 kHz as shown in Figure 28.
With a cascade of two filter cells of the second order, the execution time to perform the
complete filtering of one laser pulse was about 7.59 μs, slightly less than the time between
two samples (1/f
sampl
= 8.68 μs). Hence it was possible to perform the filtering in real time,
and successively give a representation of the pulse envelope on a LCD display. Owing to the
reduced dynamic of this monitor, the comparisons with the analog and digital filtering
where performed on a PC, after acquisition of the signals from the sensor with an
oscilloscope. The digital filter was realized with Matlab functions (Filter, qfilt), in this case.
Experimental results obtained with modulated CO
2
laser beams, at pulse repetition rates
from 10 Hz to 1000 Hz and variable duty cycle, proved an accuracy in the laser pulses
reconstruction that is not available in the commercial IR beam positioning sensors.
The analog implementation results much more noisy, but the digital implementation suffer
for the imposed limitations that make the low frequency components reproduction worse.
6. Conclusions
In this chapter we described the capabilities of pyroelectric sensors built by means of low-
cost hybrid technologies based on PVDF films for monitoring pulses of IR lasers. The
technologies presented here can be used to design large area sensors for measuring the
beam characteristics of pulsed CO
2
power lasers. Details and useful references are provided
to build measuring modules both for the beam centroid positioning and the temporal
monitoring of the laser pulses. Criterions for designing analog or digital compensation
Laser Pulses Characterization with Pyroelectric Sensors
187
“A”
H
1
(S)
“B”
H
2
(S)
“C”
H
3
(S)
“D”
H
3
(S)
V
A
V
B
V
C
V
D
V
i
V
o
2° order low-
pass filter
f
τ
=90 kHz G=30
dB
R
B
=27k
Ω
R
C
=18k
Ω
R
D
=6070
Ω
R
I
=5270
Ω
R
A
=132
Ω
Fig. 26. (Top) Analog implementation of the filter function H
filt
with four building blocks A,
B, C, D. (Bottom) The Sallen-Key low-pass filter reduces the high frequency noise.
10
0
10
1
10
2
10
3
10
4
10
5
1
2
3
4
5
6
Frequency (Hz)
Modulus (dB)
Hfilt (4° order)
Hcf (6° order)
10
0
10
1
10
2
10
3
10
4
10
5
-0.2
-0.1
0
0.1
0.2
0.3
Frequency (Hz)
Phase (Rad)
Hfilt (4° order)
Hcf (6° order)
Fig. 27. Comparisons between computed fourth order H
filt
and sixth order H
c
(f )
implementations of the compensation filter function H
c
(f).
Laser Pulse Phenomena and Applications
188
10
0
10
1
10
2
10
3
10
4
10
5
0
2
4
6
frequency (Hz)
Modulus dB
10
0
10
1
10
2
10
3
10
4
10
5
-0.2
0
0.2
0.4
frequency (Hz)
Phase Rad
Fig. 28. Computed H
filt
(continuos line) and numerical H
d
(dashed line) implementations.
filters were provided in order to minimize the effect of the typical bandwidth of the
pyroelectric thermal PVDF sensors. In this perspective the designed sensors can be seen as
an external active probe of an oscilloscope and become an useful instrument for laboratories
and companies where the IR laser sources are employed. The fabrication technology of
PVDF pyroelectric arrays was reported and low-cost assembling and packaging solutions
were presented. Future research for this type of sensors will deal with the analysis of a
closed-loop control in real time of the laser system made now possible thanks to the
computational power and versatility of commercially available microcontrollers.
7. Acknowledgments
The authors wish to acknowledge the support of CNR project MADESS II and Tuscany
Region for having supported this project and the precious scientific and technical
collaboration of Prof Leonardo Masotti (Università di Firenze, Italy), Dr Ing Giovanni
Masotti (El.En. s.p.a.) and of all the master thesis students that made possible the realization
of the projects.
8. References
Akitt D.R et al., (1992), Highperformance automatic alignment and power stabilization
system for a multikilowatt CO
2
laser, Rev. Sci. Instrum., vol. 63, pp.1859–1866, 1992.
Laser Pulses Characterization with Pyroelectric Sensors
189
Binnie T.D. et al., (2000) An integrated 16x16 PVDF pyroelectric sensor array, IEEE
Transactions on UFFC, no. 47, pp 1413 –1420
Capineri L. et al. (1998), A 3x3 matrix of thick-film pyroelectric transducers, Electronics
Letters, Vol. 34, pp 1486-1487
Capineri L. et al. (1999), A beam position sensor for low power infrared laser diodes, Review
of Scientific Instruments, Vol. 70, pp. 1-8
Capineri L. et al., (2000), Pyroelectric PVDF sensor modeling of the temporal voltage
response to arbitrarily modulated radiation, IEEE Transactions on Ultrasonic and
Frequency Control, Vol. 47, pp. 1406-1412
Capineri
a
L. et al., (2004), European patent EP 1380821 “Matrix-type pyroelectric sensor,
method for its fabrication and device for characterizing laser beams comprising
said sensor ”
Capineri
b
L. et al. (2004), Comparison between PZT and PVDF thick films technologies in
the design of low-cost pyroelectric sensors, Review of Scientific Instruments, Vol. 75, ,
pp 4906-4910
Capineri L. et al. (2005), CO
2
laser pulse monitoring instrument based on PVDF pyroelectric
array. IEEE Sensors Journal, Vol. 5, pp 520-529
Coutouly J.F. et al (1999), Simple is best for real-time beam analysis, Opto Laser Europe, n. 58,
pp.34–37
De Cicco G. et al. (1999), Pyroelectricity of PZT-based thick-films, Sensors and Actuators, Vol.
76, pp. 409–415
Giacoletto L.J. & Landee R. W., (1977), Electronics Designers Handbook ed. McGraw-Hill,
0070231494, New York
Hammes P.C.A. & Regtien P.P.L., (1992), An integrated infrared sensor using the
pyroelectric polymer PVDF, Sensors and Actuators A, Vol. 32, pp. 396-402
Kosterev A.A. et al. (2002), Chemical sensing with pulsed QC-DFB lasers operating at 15.6
μm, Appl.Phys. B, Vol. 75, pp.351-357
Lee S. et al. (2008), Femtosecond laser micromachining of polyvinylidene fluoride (PVDF)
based piezo films, Journal of Micromechanics and Microengineering, Vol. 18, doi:
10.1088/0960-1317/18/4/045011
Mann S. et al., (2002), Automated beam monitoring and diagnosis for CO
2
lasers,
Proceedings of SPIE 4629, Laser Resonators and Beam Control V, June 2002, pp.
112–121
Mazzoni M. et al., (2007), A large area PVDF pyroelectric sensor for CO
2
laser beam
alignment, IEEE Sensor Journal, Vol. 7, pp. 1159-1164
Muralt P., (1996), Piezoelectric and pyroelectric microsystems based on ferroelectric thin
films, Proceedings of the Tenth IEEE International Symposium on Applications of
Ferroelectrics, Aug. 1996, pp. 145–151
Rabindra N. D. et al. (2008), Laser processing of materials: a new strategy toward materials
design and fabrication for electronic packaging, Circuit World, Vol. 36 , ISSN: 0305-
6120
Ritter T.A. et al. (2001), Development of high frequency medical ultrasound arrays, 2001
IEEE Ultrasonics Symposium, August 2001, pp 1127 –1133
Laser Pulse Phenomena and Applications
190
Rocchi S. et. al., (1992), A transducer modelling technique for the identification of the
transfer function and driving-point impedance, Sensors and Actuators A, Vol. 32, pp.
361-365
Schopf H. et al., (1989), A 16-element linear pyroelectric array with NaNO2 thin films,
Infrared Physics, Vol. 29, pp. 101-106
Setiadi D. & Regtien P.P.L., (1995), Sensors and Actuators A, Vol 46-47, pp. 408-412
Toci G. et al. (2000), Use of a PVDF pyroelectric sensor for beam mapping and profiling of a
mid-infrared diode laser , Rev. Sci. Instr., Vol. 71, pp. 1635 - 1637
10
Time-gated Single Photon Counting Lock-in
Detection at 1550 nm Wavelength
Liantuan Xiao, Xiaobo Wang, Guofeng Zhang and Suotang Jia
State Key Laboratory of Quantum Optics and Quantum Optics Devices,
College of Physics and Electronics Engineering, Shanxi University,
Taiyuan 030006,
China
1. Introduction
Time-gated single photon counting (TGSPC), which employs a single photon detector as the
detection apparatus (Poultney, 1972; 1977), has received increasing attention because of its
superior spatial resolution and the absence of the so-called classical dead zones (Forrester &
Hulme, 1981). TGSPC is a repetitively pulsed statistical sampling technique that records the
time of arrival of photons and logs this against the time of emission of a laser pulse. TGSPC
have become increasingly important in a number of applications such as time-resolved
photoluminescence (Dixon, 1997; Leskovar & Lo, 1976), optical time-domain reflectometry
(Lacaita et al., 1993; Benaron & Stevenson, 1993; Wegmüller et al., 2004), time-of-flight laser
ranging (Pellegrini et al., 2000; Carmer & Peterson, 1996) and 3D imaging (Moring et al.,
1989; Mäkynen et al., 1994).
Ultrasensitive detection with single photon detection capability requires detectors high
quantum efficiency and low dark noise. Operation in the 1550 nm spectral region enables it
to be worked in fiber, and the eye-safe ranging brings it to be carried out in daylight
conditions. In the 1550 nm wavelength implementations, InGaAs/InP avalanche photodiode
detectors (APDs) are commonly used (Pellegrini, et al., 2006; Hiskett, et al., 2000; Lacaita, et
al., 1996). However, these APDs have low quantum efficiency because the photons may pass
through the very thin depletion layer without being absorbed. In addition, these single-
photon detectors exhibit high afterpulse probability, which can cause significant distortion
for the measurements. In order to reduce this effect these detectors have to be operated in a
time-gated mode. As each photon’s arrival time is an independent measure of range, and
accuracy can be improved by increasing the number of samples. Unfortunately, direct
photon counting will induce the quantum fluctuation (i.e. shot noise).
Time-correlated single-photon counting (TCSPC) is a repetitively pulsed statistical sampling
technique that records the time of arrival of photons reflected from a target and logs this
against the time of emission of a laser pulse (Becker, 2005). Each photon’s arrival time is an
independent measure of flight, and accuracy can be improved by increasing the number of
samples. However, the technique’s main disadvantage is an extended data-acquisition time
being required where the illumination noise is a serious problem.
Weak light detection can be improved by use of the lock-in principle (Stanford Research
Systems, 1999). A lock-in detects a signal at a known modulation frequency in amplitude
Laser Pulse Phenomena and Applications
192
and phase and suppresses noise at other frequencies. The lock-in detection principle can
enhance the signal-to-noise ratio (SNR) by orders of magnitude. The lock-in principle was
first applied to photon-counting detection by Arecchi et al. (Arecchi et al. 1966) and was
used subsequently in many low-light measurements (Murphy et al., 1973; Alfonso &
Ockman, 1968). A dual-phase implementation of the gated photon counting is hampered by
signal pick up from harmonics under nonsinusoidal modulation (Stanford Research
Systems, 1995). To obtain a precise phase signal, photon counts were reconverted to analog
signals that feed into a lock-in amplifier (Braun & Libchaber, 2002). In a previous
publication
we have demonstrated that the wavelength modulation lock-in can improve the
SNR of photon counting for weak fluorescence effectively and eliminate the quantum
fluctuation (Huang et al., 2006).
In this chapter, we present an overview of the principle of single-photon detection at
1550nm. And then we focus on the question of illumination noise, detector dark count noise
and the detection efficiency of single-photon detector, and we show that the novel method
of photon-counting lock-in for TGSPC detection can suppress background noise, and
importantly, enhance the detection efficiency of single photon detector.
2. Single photon detection at 1550nm
2.1 Single photon avalanche diodes
An avalanche photodiode reverse-biased above its breakdown voltage, V
bd
, allows single
photon detection (Ribordy et al., 1998). When such a diode is biased above V
bd
, it remains in
a zero current state for a relatively long period of time, usually in the millisecond range.
During this time, a very high electric field exists within the p-n junction forming the
avalanche multiplication region.
Under these conditions, if a primary carrier enters the multiplication region and triggers an
avalanche process, several hundreds of thousands of secondary electron-hole pairs are
generated by impact ionization, thus causing the diode’s depletion capacitance to be rapidly
discharged (Stucki, 2001). As a result, a sharp current pulse is generated and can be easily
measured. This mode of operation is commonly known as Geiger mode (Ribordy et al.,
2004). Unfortunately, typical photodiodes, as those used in conventional imagers, are not
compatible with this mode of operation since they suffer from a premature breakdown
when the bias voltage approaches V
bd
. Premature breakdown occurs since the peak electric
field is located only in the diode’s periphery rather than in the planar region. A single
photon avalanche diode (SPAD), on the other hand, is a specifically designed photodiode in
which premature breakdown is avoided and a planar multiplication region is formed within
the whole junction area (Hadfield, 2009).
Linear mode avalanche photodiodes, which are biased just below V
bd
, have a finite
multiplication gain. Statistical variations of this finite gain produce an additional noise
contribution known as excess noise (Tilleman & Krishnaswami, 1996; Yano et al., 1990).
SPADs, on the other hand, are not concerned with these gain fluctuations since the optical
gain is virtually infinite (Takesue et al., 2006). Nevertheless, the statistical nature of the
avalanche buildup is translated onto a detection probability. Indeed, the probability of
detecting a photon hitting the SPAD’s surface depends on the diode’s quantum efficiency
and the probability for an electron or for a hole to trigger an avalanche (Legre et al., 2007).
Intensity information is obtained by counting the pulses during a certain period of time or
by measuring the mean time interval between successive pulses. The same mechanism may
Time-gated Single Photon Counting Lock-in Detection at 1550 nm Wavelength
193
be used to evaluate noise. Thermally or tunneling generated carriers within the p-n junction,
which produce dark current in linear mode photodiodes, can trigger avalanche pulses. In
Geiger mode, they are indistinguishable from regular photon-triggered pulses and they
produce spurious pulses at a frequency known as dark count rate (DCR). DCR strongly
depends on temperature and it is an important parameter for a TGSPC since it generates
false measurements (Thew et al., 2007).
The practical detection efficiency, η, is defined as the overall probability of registering a
count if a photon arrives at the detector. In most photon-counting applications a high value
of η is certainly desirable. The higher the value of η, the smaller the signal loss, thus results
more efficient and accurate measurements. DCR and detection efficiency determine the
lowest power that is detectable by the device through the noise equivalent power (NEP)
which is defined as
2/NEP h D
ν
η
= , here h
ν
is the energy of the signal photon, and D is
the DCR (Hiskett, 2001; Gisin et al., 2002).
Another source of spurious counts is represented by after-pulses (Roussev et al., 2004). They
are due to carriers temporarily trapped after a Geiger pulse in the multiplication region that
are released after a short time interval, thus re-triggering a Geiger event. After-pulses
depend on the trap concentration as well as on the number of carriers generated during a
Geiger pulse. The number of carriers depends in turn on the diode’s parasitic capacitance
and on the external circuit, which is usually the circuit used to quench the avalanche.
Typically, the quenching process is achieved by temporarily lowering the bias voltage below
V
bd
. Once the avalanche has been quenched, the SPAD needs to be recharged again above
V
bd
so that it can detect subsequent photons. The time required to quench the avalanche and
recharge the diode up to 90% of its nominal excess bias is defined as the dead time. This
parameter limits the maximal rate of detected photons, thus producing a saturation effect
(Dixon, et al., 2008).
The commercially available InGaAs/InP avalanche photodiode has been the most practical
device for SPADs at 1550nm telecommunication wavelength (Warburton et al., 2009). Since
a photo-excited carrier grows into a macroscopic current output via the carrier avalanche
multiplication in an APD operated in the Geiger mode, a single-photon can be detected
efficiently. However, fractions of the many carriers trapped in the APD are subsequently
emitted, and trigger additional avalanches that cause erroneous events. The InGaAs/InP
SAPD in Geiger mode has a particularly high probability that afterpulses occur. Therefore,
the InGaAs/InP SAPD is usually operated in the gated mode in which the gate duration
(gate-on time) is generally set to a few nanoseconds (Namekata et al., 2006; Yoshizawa et al.,
2004). Then the interval between two consecutive gates is set to more than the lifetime (in
orders of microseconds) of the trapped carriers so that the afterpulse is suppressed. As a
result, the repetition frequency of the gate has been limited to several megahertz, which is
unsuitable for applications such as the high-speed detection (Hadfield et al., 2006).
2.2 The block diagram for single photon detector at 1550nm
Fig. 1 shows a typical block diagram scheme for a commercially single photon detector,
Photon Counting Receiver PGA 600 manufactured by Princeton Lightwave Inc (Princeton
Light Wave, 2006). The receiver has four major functional elements. These are the InGaAs
SPAD, analog signal processing circuitry, a discriminator circuitry, and triggering, biasing
and blanking circuitry.
Laser Pulse Phenomena and Applications
194
Fig. 1. The typical block diagram scheme for 1550nm single photon detector.
The SAPD is operated at ~ 218 K to reduce the probability of DCR. When the detector is
triggered, the APD bias voltage is raised above its reverse V
bd
to operate in Geiger mode. A
short time later the bias is reduced below V
bd
again to prevent false events.
The analog signal processing circuitry eliminates the transient noise created when a short
bias pulse is applied to the SPAD, and isolates the charge pulse that results when a photon
trigger an avalanche event.
The discriminator circuitry generates a digital logic pulse when the pulse-height of an
analog charge signal exceeds a threshold level set to reject electronic noise. In a typical
photon counting system, the SPAD output exhibits fluctuations in the pulse height and
these pulses are amplified and directed into the discriminator. The discriminator compares
the input pulses with the preset reference threshold voltage, where the lower pulses are
eliminated. The higher pulses output at a constant level, usually as transistor-transistor logic
(TTL) level from 0V to 5 V, allowing counting the discriminated pulses. To increase the
detection efficiency, it is advantageous to set the level discrimination at a lower position, but
this is also accompanied by a noise increase thus increasing dark count and the NEP.
The triggering circuitry initiates bias pulse generation when a trigger pulse reaches a set
threshold level.
The delay between triggering and bias pulse generation can be adjusted so that the bias
pulses accurately coincide with the expected arrival times of the photons. By using short
bias pulses, the probability of dark counts can be significantly reduced, improving the
detector’s SNR performance.
When the detector is triggered, the SPAD bias voltage is raised above its reverse breakdown
voltage to operate in Geiger mode. This feature is useful to suppress afterpulsing of the
SPAD. The detector has both of digital and analog output. The discriminator circuitry
generates a digital logic pulse when the pulse-height of an analog charge signal exceeds a
threshold level set to reject electronic noise. The threshold is set as the cross-over voltage at
which background noise and the single photon make equal contributions to the pulse height
distribution. With the certain threshold, the receiver provides 20% detection efficiency and
10
-5
dark count probability per 1 ns gating pulse.
2.3 Quantum fluctuations and SNR of photon counting
The SPAD records the incident photons in the sampling time τ. Suppose the average photon
count is α, the quantum fluctuations of the photon counting distribution can be expressed as
(Lee et al., 2006)
2
()( )
sn
n
IPnn
α
=−
∑
, (1)
Time-gated Single Photon Counting Lock-in Detection at 1550 nm Wavelength
195
where
n is the actual photon numbers measured during the experiment.
For the coherent light field, the photon counting distribution obeys Poisson distribution
() !
n
c
Pn e n
α
α
−
=
. (2)
The quantum fluctuations of coherent light field should be
c
sn
I
α
= . (3)
The SNR of photon counting can be expressed as
()()
SNR
BD BD
ατ α
τ
αα
==
++ ++
. (4)
Where
B is the photon count rate caused by illumination noise light. When the background
stray light and the dark counts of detector, working in low-temperature environment, can be
ignored compared to signal counts, the maximum value
12
()
ατ
of spectral SNR can be
obtained. Increasing
τ
could get a higher SNR, but the temporal resolution should be
decreased in this way.
2.4 The principle of photon counting lock-in
Fig. 2. Implementation of the photon-counting lock-in.
Lock-in amplifier is a synchronous coherent detector using principle of cross-correlation,
extracting useful signals from noise because the reference signal frequency related to the
input signal frequency but not related to noise frequency. It is equivalent to a very narrow
bandwidth band-pass filter, and it is necessary to compress the filter bandwidth as much as
possible in order to suppress noise.
When the incident photons were intensity modulated by the sine-wave of frequency f
s
, the
instantaneous photon counts at time t is expressed as r
0
+mcos(2πf
s
t), where r
0
is average
photon counts, m is depth of modulation. Then within the sampling time τ the effective
photon counts can be expressed as (Huang et al., 2006)
0
sin( )
( ) cos(2 )
s
tss
s
f
rrm ftf
f
πτ
τ
ππτ
πτ
⎡⎤
=+ +
⎢⎥
⎣⎦
. (5)