Model Predictive Control Part 11 docx
Bạn đang xem bản rút gọn của tài liệu. Xem và tải ngay bản đầy đủ của tài liệu tại đây (676.69 KB, 20 trang )
Model Predictive Trajectory Control for High-Speed Rack Feeders 193
Using this simple discretisation method, the computational effort for the MPC-algorithm can
be kept acceptable. By the way, no significant improvement could be obtained for the given
system with the Heun discretisation method because of the small sampling time t
s
= 3 ms.
Only in the case of large sampling times, e.g. t
s
> 20 ms, the increased computational effort
caused by a sophisticated time discretisation method is advantageous. Then, the smaller dis-
cretisation error allows for less time integration steps for a specified prediction horizon, i.e. a
smaller number M. As a result, the smaller number of time steps can overcompensate the
larger effort necessary for a single time step.
The ideal input u
d
(t) can be obtained in continous time as function of the output variable
y
K
(t) = c
T
y
x
y
(t) =
1
1
2
κ
2
(
3 − κ
)
0 0
x
y
(t) , (43)
and a certain number of its time derivatives. For this purpose the corresponding transfer
function of the system under consideration is employed
Y
K
(
s
)
U
d
(
s
)
=
c
T
y
sI
− A
y
−1
b
y
=
b
0
+ b
1
· s + b
2
· s
2
N
(
s
)
. (44)
Obviously, the numerator of the control transfer function contains a second degree polynomial
in s, leading to two transfer zeros. This shows that the considered output y
K
(t) represents a
non-flat output variable that makes computing of the feedforward term more difficult. A pos-
sible way for calculating the desired input variable is given by a modification of the numerator
of the control transfer function by introducing a polynomial ansatz for the feedforward action
according to
U
d
(
s
)
=
k
V0
+ k
V1
· s + . . . + k
V4
· s
4
Y
Kd
(
s
)
. (45)
For its realisation the desired trajectory y
Kd
(t) as well as the first four time derivatives are
available from a trajectory planning module. The feedforward gains can be computed from
a comparison of the corresponding coefficients in the numerator as well as the denominator
polynomials of
Y
K
(
s
)
Y
Kd
(
s
)
=
b
0
+ . . . + b
2
· s
2
k
V0
+ . . . + k
V4
· s
4
N
(
s
)
=
b
V0
k
Vj
+ b
V1
k
Vj
· s + . . . + b
V6
k
Vj
· s
6
a
0
+ a
1
· s + . . . + s
4
(46)
according to
a
i
= b
Vi
k
Vj
, i
= 0, . . . , n = 4 . (47)
This leads to parameter-dependent feedforward gains k
Vj
= k
Vj
(κ). It is obvious that due
the higher numerator degree in the modified control transfer function a remaining dynamics
must be accepted. Lastly, the desired input variable in the time domain is represented by
u
d
(t) = u
d
˙
y
Kd
(t),
¨
y
Kd
(t),
y
Kd
(t), y
(4)
Kd
(t), κ
. (48)
To obtain the desired system states as function of the output trajectory the output equation
0 5 10 15
0
0.2
0.4
0.6
0.8
t in s
y
K
in m
0 5 10 15
−2
−1
0
1
2
t in s
y
Kpd
in m/s
0 5 10 15
0
0.2
0.4
0.6
0.8
t in s
x
K
in m
0 5 10 15
−1.5
−1
−0.5
0
0.5
1
1.5
t in s
x
Kpd
in m/s
y
Kd
y
K
x
Kd
x
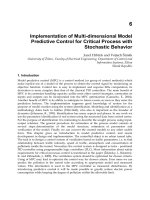
K
Fig. 4. Desired trajectories for the cage motion: desired and actual position in horizontal
direction (upper left corner), desired and actual position in vertical direction (upper right
corner), actual velocity in horizontal direction (lower left corner) and actual velocity in vertical
direction (lower right corner).
and its first three time derivatives are considered. Including the equations of motion (12)
yields the following set of equations
y
Kd
(t) = y
S
(t) +
1
2
κ
2
(
3 − κ
)
·
v
1
(t), (49)
˙
y
Kd
(t) =
˙
y
S
(t) +
1
2
κ
2
(
3 − κ
)
·
˙
v
1
(t), (50)
¨
y
Kd
(t) =
¨
y
S
(t) +
1
2
κ
2
(
3 − κ
)
·
¨
v
1
(t) =
¨
y
K
(
v
1
(t),
˙
y
S
(t),
˙
v
1
(t), u
d
(t), κ
)
, (51)
y
Kd
(t) =
y
K
(
v
1
(t),
˙
y
S
(t),
˙
v
1
(t), u
d
(t),
˙
u
d
(t), κ
)
. (52)
Solving equation (49) to (52) for the system states results in the desired state vector
x
d
(t) =
y
Sd
(
y
Kd
(t),
˙
y
Kd
(t),
¨
y
Kd
(t),
y
Kd
(t), u
d
(t),
˙
u
d
(t), κ
)
v
1d
(
˙
y
Kd
(t),
¨
y
Kd
(t),
y
Kd
(t), u
d
(t),
˙
u
d
(t), κ
)
˙
y
Sd
(
˙
y
Kd
(t),
¨
y
Kd
(t),
y
Kd
(t), u
d
(t),
˙
u
d
(t), κ
)
˙
v
1d
(
˙
y
Kd
(t),
¨
y
Kd
(t),
y
Kd
(t), u
d
(t),
˙
u
d
(t), κ
)
. (53)
This equation still contains the inverse dynamics u
d
(t) and its time derivative
˙
u
d
. Substituting
u
d
for equation (48) and
˙
u
d
(t) for the time derivative of (48), which can be calculated analyti-
Model Predictive Control194
cally, finally leads to
x
d
(t) =
y
Sd
y
Kd
(t),
˙
y
Kd
(t),
¨
y
Kd
(t),
y
Kd
(t), y
(4)
Kd
(t), y
(5)
Kd
(t), κ
v
1d
y
Kd
(t),
˙
y
Kd
(t),
¨
y
Kd
(t),
y
Kd
(t), y
(4)
Kd
(t), y
(5)
Kd
(t), κ
˙
y
Sd
y
Kd
(t),
˙
y
Kd
(t),
¨
y
Kd
(t),
y
Kd
(t), y
(4)
Kd
(t), y
(5)
Kd
(t), κ
˙
v
1d
y
Kd
(t),
˙
y
Kd
(t),
¨
y
Kd
(t),
y
Kd
(t), y
(4)
Kd
(t), y
(5)
Kd
(t), κ
. (54)
0 5 10 15
−4
−2
0
2
4
6
8
x 10
−3
t in s
e
y
in m
Fig. 5. Tracking error e
y
(
t
)
for the cage motion in horizontal direction.
0 5 10 15
−4
−3
−2
−1
0
1
2
3
4
5
x 10
−3
t in s
e
x
in m
Fig. 6. Tracking error e
x
(
t
)
for the cage motion in vertical direction.
5. Experimental validation on the test rig
The benefits and the efficiency of the proposed control measures shall be pointed out by exper-
imental results obtained from the test set-up available at the Chair of Mechatronics, University
of Rostock. For this purpose, a synchronous four times continuously differentiable desired
trajectory is considered for the position of the cage in both x- and y-direction. The desired
trajectory is given by polynomial functions that comply with specified kinematic constraints,
which is achieved by taking advantage of time scaling techniques. The desired trajectory
shown in Figure 4 comprises a sequence of reciprocating motions with maximum velocities of
2 m/s in horizontal direction and 1.5 m/s in vertical direction. The resulting tracking errors
e
y
(
t
)
=
y
Kd
(
t
)
−
y
K
(
t
)
(55)
and
e
x
(
t
)
=
x
Kd
(
t
)
−
x
K
(
t
)
(56)
are depicted in Figure 5 and Figure 6. As can be seen, the maximum position error in y-
direction during the movements is about 6 mm and the steady-state position error is smaller
than 0.2 mm, whereas the maximum position error in x -direction is approx. 4 mm. Figure 7
0 5 10 15
−0.015
−0.01
−0.005
0
0.005
0.01
0.015
t in s
v
1
in m
v
1d
v
1
Fig. 7. Comparison of the desired values v
1d
(
t
)
and the actual values v
1
(
t
)
for the bending
deflection.
shows the comparison of the bending deflection measured by strain gauges attached to the
flexible beam with desired values. During the acceleration as well as the deceleration inter-
vals, physically unavoidable bending deflections could be noticed. The achieved benefit is
given by the fact the remaining oscillatons are negligible when the rack feeder arrives at its
target position. This underlines both the high model accuracy and the quality of the active
damping of the first bending mode. Figure 8 depicts the disturbance rejection properties due
to an external excitation by hand. At the beginning, the control structure is deactivated, and
the excited bending oscillations decay only due to the very weak material damping. After
approx. 2.8 seconds, the control structure is activated and, hence, the first bending mode is
actively damped. The remaining oscillations are characterised by higher bending modes that
decay with material damping. In future work, the number of Ritz ansatz functions shall be
Model Predictive Trajectory Control for High-Speed Rack Feeders 195
cally, finally leads to
x
d
(t) =
y
Sd
y
Kd
(t),
˙
y
Kd
(t),
¨
y
Kd
(t),
y
Kd
(t), y
(4)
Kd
(t), y
(5)
Kd
(t), κ
v
1d
y
Kd
(t),
˙
y
Kd
(t),
¨
y
Kd
(t),
y
Kd
(t), y
(4)
Kd
(t), y
(5)
Kd
(t), κ
˙
y
Sd
y
Kd
(t),
˙
y
Kd
(t),
¨
y
Kd
(t),
y
Kd
(t), y
(4)
Kd
(t), y
(5)
Kd
(t), κ
˙
v
1d
y
Kd
(t),
˙
y
Kd
(t),
¨
y
Kd
(t),
y
Kd
(t), y
(4)
Kd
(t), y
(5)
Kd
(t), κ
. (54)
0 5 10 15
−4
−2
0
2
4
6
8
x 10
−3
t in s
e
y
in m
Fig. 5. Tracking error e
y
(
t
)
for the cage motion in horizontal direction.
0 5 10 15
−4
−3
−2
−1
0
1
2
3
4
5
x 10
−3
t in s
e
x
in m
Fig. 6. Tracking error e
x
(
t
)
for the cage motion in vertical direction.
5. Experimental validation on the test rig
The benefits and the efficiency of the proposed control measures shall be pointed out by exper-
imental results obtained from the test set-up available at the Chair of Mechatronics, University
of Rostock. For this purpose, a synchronous four times continuously differentiable desired
trajectory is considered for the position of the cage in both x- and y-direction. The desired
trajectory is given by polynomial functions that comply with specified kinematic constraints,
which is achieved by taking advantage of time scaling techniques. The desired trajectory
shown in Figure 4 comprises a sequence of reciprocating motions with maximum velocities of
2 m/s in horizontal direction and 1.5 m/s in vertical direction. The resulting tracking errors
e
y
(
t
)
=
y
Kd
(
t
)
−
y
K
(
t
)
(55)
and
e
x
(
t
)
=
x
Kd
(
t
)
−
x
K
(
t
)
(56)
are depicted in Figure 5 and Figure 6. As can be seen, the maximum position error in y-
direction during the movements is about 6 mm and the steady-state position error is smaller
than 0.2 mm, whereas the maximum position error in x -direction is approx. 4 mm. Figure 7
0 5 10 15
−0.015
−0.01
−0.005
0
0.005
0.01
0.015
t in s
v
1
in m
v
1d
v
1
Fig. 7. Comparison of the desired values v
1d
(
t
)
and the actual values v
1
(
t
)
for the bending
deflection.
shows the comparison of the bending deflection measured by strain gauges attached to the
flexible beam with desired values. During the acceleration as well as the deceleration inter-
vals, physically unavoidable bending deflections could be noticed. The achieved benefit is
given by the fact the remaining oscillatons are negligible when the rack feeder arrives at its
target position. This underlines both the high model accuracy and the quality of the active
damping of the first bending mode. Figure 8 depicts the disturbance rejection properties due
to an external excitation by hand. At the beginning, the control structure is deactivated, and
the excited bending oscillations decay only due to the very weak material damping. After
approx. 2.8 seconds, the control structure is activated and, hence, the first bending mode is
actively damped. The remaining oscillations are characterised by higher bending modes that
decay with material damping. In future work, the number of Ritz ansatz functions shall be
Model Predictive Control196
0 1 2 3 4 5
−0.03
−0.02
−0.01
0
0.01
0.02
0.03
t in s
v
1
in m
Control activated
Manual
excitation
Fig. 8. Transient response after a manual excitation of the bending deflection: at first without
feedback control, after approx. 2.8 seconds with active control.
increased to include the higher bending modes as well in the active damping. The correspond-
ing elastic coordinates and their time derivatives can be determined by observer techniques.
6. Conclusions
In this paper, a gain-scheduled fast model predictive control strategy for high-speed rack feed-
ers is presented. The control design is based on a control-oriented elastic multibody system.
The suggested control algorithm aims at reducing the future tracking error at the end of the
prediction horizon. Beneath an active oscillation damping of the first bending mode, an accu-
rate trajectory tracking for the cage position in x- and y-direction is achieved. Experimental
results from a prototypic test set-up point out the benefits of the proposed control structure.
Experimental results show maximum tracking errors of approx. 6 mm in transient phases,
whereas the steady-state tracking error is approx. 0.2 mm. Future work will address an active
oscillation damping of higher bending modes as well as an additional gain-scheduling with
respect to the varying payload.
7. References
Aschemann, H. & Ritzke, J. (2009). Adaptive aktive Schwingungsdämpfung und Trajektorien-
folgeregelung für hochdynamische Regalbediengeräte (in German), Schwingungen in
Antrieben, Vorträge der 6. VDI-Fachtagung in Leonberg, Germany. (in German).
Aschemann, H. & Ritzke, J. (2010). Gain-scheduled tracking control for high-speed rack feed-
ers, Proc. of the first joint international conference on multibody system dynamics (IMSD),
2010, Lappeenranta, Finland .
Bachmayer, M., Rudolph, J. & Ulbrich, H. (2008). Flatness based feed forward control for a
horizontally moving beam with a point mass, European Conference on Structural Con-
trol, St. Petersburg pp. 74–81.
Fliess, M., Levine, J., Martin, P. & Rouchon, P. (1995). Flatness and defect of nonlinear systems:
Introductory theory and examples, Int. J. Control 61: 1327–1361.
Jung, S. & Wen, J. (2004). Nonlinear model predictive control for the swing-up of a rotary in-
verted pendulum, ASME J. of Dynamic Systems, Measurement and Control 126(3): 666–
673.
Kostin, G. V. & Saurin, V. V. (2006). The Optimization of the Motion of an Elastic Rod by
the Method of Integro-Differential Relations, Journal of computer and Systems Sciences
International, Vol. 45, Pleiades Publishing, Inc., pp. 217–225.
Lizarralde, F., Wen, J. & Hsu, L. (1999). A new model predictive control strategy for affine
nonlinear control systems, Proc of the American Control Conference (ACC ’99), San Diego
pp. 4263 – 4267.
M. Bachmayer, J. R. & Ulbrich, H. (2008). Acceleration of linearly actuated elastic robots avoid-
ing residual vibrations, Proceedings of the 9th International Conference on Motion and
Vibration Control, Munich, Germany.
Magni, L. & Scattolini, R. (2004). Model predictive control of continuous-time nonlin-
ear systems with piecewise constant control, IEEE Transactions on automatic control
49(6): 900–906.
Schindele, D. & Aschemann, H. (2008). Nonlinear model predictive control of a high-speed lin-
ear axis driven by pneumatic muscles, Proc. of the American Control Conference (ACC),
2008, Seattle, USA pp. 3017–3022.
Shabana, A. A. (2005). Dynamics of multibody systems, Cambridge University Press, Cambridge.
Staudecker, M., Schlacher, K. & Hansl, R. (2008). Passivity based control and time optimal tra-
jectory planning of a single mast stacker crane, Proc. of the 17th IFAC World Congress,
Seoul, Korea pp. 875–880.
Wang, Y. & Boyd, S. (2010). Fast model predictive control using online optimization, IEEE
Transactions on control systems technology 18(2): 267–278.
Weidemann, D., Scherm, N. & Heimann, B. (2004). Discrete-time control by nonlinear online
optimization on multiple shrinking horizons for underactuated manipulators, Pro-
ceedings of the 15th CISM-IFToMM Symposium on Robot Design, Dynamics and Control,
Montreal .
Model Predictive Trajectory Control for High-Speed Rack Feeders 197
0 1 2 3 4 5
−0.03
−0.02
−0.01
0
0.01
0.02
0.03
t in s
v
1
in m
Control activated
Manual
excitation
Fig. 8. Transient response after a manual excitation of the bending deflection: at first without
feedback control, after approx. 2.8 seconds with active control.
increased to include the higher bending modes as well in the active damping. The correspond-
ing elastic coordinates and their time derivatives can be determined by observer techniques.
6. Conclusions
In this paper, a gain-scheduled fast model predictive control strategy for high-speed rack feed-
ers is presented. The control design is based on a control-oriented elastic multibody system.
The suggested control algorithm aims at reducing the future tracking error at the end of the
prediction horizon. Beneath an active oscillation damping of the first bending mode, an accu-
rate trajectory tracking for the cage position in x- and y-direction is achieved. Experimental
results from a prototypic test set-up point out the benefits of the proposed control structure.
Experimental results show maximum tracking errors of approx. 6 mm in transient phases,
whereas the steady-state tracking error is approx. 0.2 mm. Future work will address an active
oscillation damping of higher bending modes as well as an additional gain-scheduling with
respect to the varying payload.
7. References
Aschemann, H. & Ritzke, J. (2009). Adaptive aktive Schwingungsdämpfung und Trajektorien-
folgeregelung für hochdynamische Regalbediengeräte (in German), Schwingungen in
Antrieben, Vorträge der 6. VDI-Fachtagung in Leonberg, Germany. (in German).
Aschemann, H. & Ritzke, J. (2010). Gain-scheduled tracking control for high-speed rack feed-
ers, Proc. of the first joint international conference on multibody system dynamics (IMSD),
2010, Lappeenranta, Finland .
Bachmayer, M., Rudolph, J. & Ulbrich, H. (2008). Flatness based feed forward control for a
horizontally moving beam with a point mass, European Conference on Structural Con-
trol, St. Petersburg pp. 74–81.
Fliess, M., Levine, J., Martin, P. & Rouchon, P. (1995). Flatness and defect of nonlinear systems:
Introductory theory and examples, Int. J. Control 61: 1327–1361.
Jung, S. & Wen, J. (2004). Nonlinear model predictive control for the swing-up of a rotary in-
verted pendulum, ASME J. of Dynamic Systems, Measurement and Control 126(3): 666–
673.
Kostin, G. V. & Saurin, V. V. (2006). The Optimization of the Motion of an Elastic Rod by
the Method of Integro-Differential Relations, Journal of computer and Systems Sciences
International, Vol. 45, Pleiades Publishing, Inc., pp. 217–225.
Lizarralde, F., Wen, J. & Hsu, L. (1999). A new model predictive control strategy for affine
nonlinear control systems, Proc of the American Control Conference (ACC ’99), San Diego
pp. 4263 – 4267.
M. Bachmayer, J. R. & Ulbrich, H. (2008). Acceleration of linearly actuated elastic robots avoid-
ing residual vibrations, Proceedings of the 9th International Conference on Motion and
Vibration Control, Munich, Germany.
Magni, L. & Scattolini, R. (2004). Model predictive control of continuous-time nonlin-
ear systems with piecewise constant control, IEEE Transactions on automatic control
49(6): 900–906.
Schindele, D. & Aschemann, H. (2008). Nonlinear model predictive control of a high-speed lin-
ear axis driven by pneumatic muscles, Proc. of the American Control Conference (ACC),
2008, Seattle, USA pp. 3017–3022.
Shabana, A. A. (2005). Dynamics of multibody systems, Cambridge University Press, Cambridge.
Staudecker, M., Schlacher, K. & Hansl, R. (2008). Passivity based control and time optimal tra-
jectory planning of a single mast stacker crane, Proc. of the 17th IFAC World Congress,
Seoul, Korea pp. 875–880.
Wang, Y. & Boyd, S. (2010). Fast model predictive control using online optimization, IEEE
Transactions on control systems technology 18(2): 267–278.
Weidemann, D., Scherm, N. & Heimann, B. (2004). Discrete-time control by nonlinear online
optimization on multiple shrinking horizons for underactuated manipulators, Pro-
ceedings of the 15th CISM-IFToMM Symposium on Robot Design, Dynamics and Control,
Montreal .
Model Predictive Control198
Plasma stabilization system design on the base of model predictive control 199
Plasma stabilization system design on the base of model predictive
control
Evgeny Veremey and Margarita Sotnikova
0
Plasma stabilization system design
on the base of model predictive control
Evgeny Veremey and Margarita Sotnikova
Saint-Petersburg State University,
Faculty of Applied Mathematics and Control Processes
Russia
1. Introduction
Tokamaks, as future nuclear power plants, currently present exceptionally significant re-
search area. The basic problems are electromagnetic control of the plasma current, shape
and position. High-performance plasma control in a modern tokamak is the complex prob-
lem (Belyakov et al., 1999). This is mainly connected with the design requirements imposed
on magnetic control system and power supply physical constraints. Besides that, plasma is
an extremely complicated dynamical object from the modeling point of view and usually con-
trol system design is based on simplified linear system, representing plasma dynamics in the
vicinity of the operating point (Ovsyannikov et al., 2005). This chapter is focused on the con-
trol systems design on the base of Model Predictive Control (MPC) (Camacho & Bordons,
1999; Morari et al., 1994). Such systems provide high-performance control in the case when
accurate mathematical model of the plant to be controlled is unknown. In addition, these
systems allow to take into account constraints, imposed both on the controlled and manip-
ulated variables (Maciejowski, 2002). Furthermore, MPC algorithms can base on both linear
and nonlinear mathematical models of the plant. So MPC control scheme is quite suitable for
plasma stabilization problems.
In this chapter two different approaches to the plasma stabilization system design on the base
of model predictive control are considered. First of them is based on the traditional MPC
scheme. The most significant drawback of this variant is that it does not guarantee stability
of the closed-loop control circuit. In order to eliminate this problem, a new control algorithm
is proposed. This algorithm allows to stabilize control plant in neighborhood of the plasma
equilibrium position. Proposed approach is based on the ideas of MPC and modal paramet-
ric optimization. Within the suggested framework linear closed-loop system eigenvalues are
placed in the specific desired areas on the complex plane for each sample instant. Such areas
are located inside the unit circle and reflect specific requirements and constraints imposed on
closed-loop system stability and oscillations.
It is well known that the MPC algorithms are very time-consuming, since they require the
repeated on-line solution of the optimization problem at each sampling instant. In order to re-
duce computational load, algorithms parameters tuning are performed and a special method
is proposed in the case of modal parametric optimization based MPC algorithms.
9
Model Predictive Control200
The working capacity and effectiveness of the MPC algorithms is demonstrated by the exam-
ple of ITER-FEAT plasma vertical stabilization problem. The comparison of the approaches is
done.
2. Control Problem Formulation
2.1 Mathematical model of the plasma vertical stabilization process in ITER-FEAT tokamak
The dynamics of plasma control process can be commonly described by the system of ordinary
differential equations (Misenov, 2000; Ovsyannikov et al., 2006)
dΨ
dt
+ RI = V, (1)
where Ψ is the poloidal flux vector, R is a diagonal resistance matrix, I is a vector of active and
passive currents, V is a vector of voltages applied to coils. The vector Ψ is given by nonlinear
relation
Ψ
= Ψ (I, I
p
), (2)
where I
p
is the plasma current. The vector of output variables is given by
y
= y (I, I
p
). (3)
Linearizing equations (1)–(3) in the vicinity of the operating point, we obtain a linear model of
the process in the state space form. In particular, the linear model describing plasma vertical
control in ITER-FEAT tokamak is presented below.
ITER-FEAT tokamak (Gribov et al., 2000) has a separate fast feedback loop for plasma vertical
stabilization. The Vertical Stabilization (VS) converter is applied in this loop. Its voltage is
evaluated in the feedback controller, which uses the vertical velocity of plasma current cen-
troid as an input. So the linear model can be written as follows
˙
x
= A x + bu,
y
= c x + du,
(4)
where x
∈ E
58
is a state space vector, u ∈ E
1
is the voltage of the VS converter, y ∈ E
1
is the
vertical velocity of the plasma current centroid.
Since the order of this linear model is very high, an order reduction is desirable to simplify
the controller synthesis problem. The standard Matlab function schmr was used to perform
model reduction from 58th to 3rd order. As a result, we obtain a transfer function of the
reduced SISO model (from input u to output y)
P
(s) =
1.732 · 10
−6
(s − 121.1)(s + 158.2)(s + 9.641)
(s + 29.21)(s + 8.348)(s − 12.21)
. (5)
This transfer function has poles which dominate the dynamics of the initial plant. The un-
stable pole corresponds to vertical instability. It is natural to assume that two other poles
are determined by the virtual circuit dynamic related to the most significant elements in the
tokamak vessel construction. The quality of the model reduction can be illustrated by the
comparison of the Bode diagram for both initial and reduced models. Fig. 1 shows the Bode
diagrams for initial and reduced 3
rd
order models on the left and for initial and reduced 2
nd
order model on the right. It is easy to see that the curves for initial model and reduced 3
rd
order model are actually indistinguishable, contrary to the 2
nd
order model.
−120
−110
−100
−90
−80
−70
Magnitude (dB)
10
0
10
2
10
4
−5
0
5
10
15
20
Phase (deg)
Bode Diagram
Frequency (rad/sec)
−120
−110
−100
−90
−80
−70
Magnitude (dB)
10
0
10
2
10
4
−5
0
5
10
15
20
Phase (deg)
Bode Diagram
Frequency (rad/sec)
Fig. 1. Bode diagrams for initial (solid lines) and reduced (dotted lines) models.
In addition to plant model (5), we must take into account the following limits that are imposed
on the power supply system
V
VS
max
= 0.6kV, I
VS
max
= 20.7kA, (6)
where V
VS
max
is the maximum voltage, I
VS
max
is the maximum current in the VS converter. So,
the linear model (5) together with constraints (6) is considered in the following as the basis for
controller synthesis.
2.2 Optimal control problem formulation
The desired controller must stabilize vertical velocity of the plasma current centroid. One of
the approaches to control synthesis is based on the optimal control theory. In this framework,
plasma vertical stabilization problem can be stated as follows. One needs to find a feedback
control algorithm u
= u (t, y) that provides a minimum of the quadratic cost functional
J
= J(u) =
∞
0
(y
2
(t) + λu
2
(t))dt, (7)
subject to plant model (5) and constraints (6), and guarantees closed-loop stability. Here λ is a
constant multiplier setting the trade-off between controller’s performance and control energy
costs.
Specifically, in order to find an optimal controller, LQG-synthesis can be performed. Such a
controller has high stabilization performance in the unconstrained case. However, it is per-
haps not the best choice in the presence of constraints.
Contrary to this, the MPC synthesis allows to take into account constraints. Its basic scheme
implies on-line optimization of the cost functional (7) over a finite horizon subject to plant
model (5) and imposed constraints (6).
Plasma stabilization system design on the base of model predictive control 201
The working capacity and effectiveness of the MPC algorithms is demonstrated by the exam-
ple of ITER-FEAT plasma vertical stabilization problem. The comparison of the approaches is
done.
2. Control Problem Formulation
2.1 Mathematical model of the plasma vertical stabilization process in ITER-FEAT tokamak
The dynamics of plasma control process can be commonly described by the system of ordinary
differential equations (Misenov, 2000; Ovsyannikov et al., 2006)
dΨ
dt
+ RI = V, (1)
where Ψ is the poloidal flux vector, R is a diagonal resistance matrix, I is a vector of active and
passive currents, V is a vector of voltages applied to coils. The vector Ψ is given by nonlinear
relation
Ψ
= Ψ (I, I
p
), (2)
where I
p
is the plasma current. The vector of output variables is given by
y
= y (I, I
p
). (3)
Linearizing equations (1)–(3) in the vicinity of the operating point, we obtain a linear model of
the process in the state space form. In particular, the linear model describing plasma vertical
control in ITER-FEAT tokamak is presented below.
ITER-FEAT tokamak (Gribov et al., 2000) has a separate fast feedback loop for plasma vertical
stabilization. The Vertical Stabilization (VS) converter is applied in this loop. Its voltage is
evaluated in the feedback controller, which uses the vertical velocity of plasma current cen-
troid as an input. So the linear model can be written as follows
˙
x
= A x + bu,
y
= c x + du,
(4)
where x
∈ E
58
is a state space vector, u ∈ E
1
is the voltage of the VS converter, y ∈ E
1
is the
vertical velocity of the plasma current centroid.
Since the order of this linear model is very high, an order reduction is desirable to simplify
the controller synthesis problem. The standard Matlab function schmr was used to perform
model reduction from 58th to 3rd order. As a result, we obtain a transfer function of the
reduced SISO model (from input u to output y)
P
(s) =
1.732 · 10
−6
(s − 121.1)(s + 158.2)(s + 9.641)
(
s + 29.21)(s + 8.348)(s − 12.21)
. (5)
This transfer function has poles which dominate the dynamics of the initial plant. The un-
stable pole corresponds to vertical instability. It is natural to assume that two other poles
are determined by the virtual circuit dynamic related to the most significant elements in the
tokamak vessel construction. The quality of the model reduction can be illustrated by the
comparison of the Bode diagram for both initial and reduced models. Fig. 1 shows the Bode
diagrams for initial and reduced 3
rd
order models on the left and for initial and reduced 2
nd
order model on the right. It is easy to see that the curves for initial model and reduced 3
rd
order model are actually indistinguishable, contrary to the 2
nd
order model.
−120
−110
−100
−90
−80
−70
Magnitude (dB)
10
0
10
2
10
4
−5
0
5
10
15
20
Phase (deg)
Bode Diagram
Frequency (rad/sec)
−120
−110
−100
−90
−80
−70
Magnitude (dB)
10
0
10
2
10
4
−5
0
5
10
15
20
Phase (deg)
Bode Diagram
Frequency (rad/sec)
Fig. 1. Bode diagrams for initial (solid lines) and reduced (dotted lines) models.
In addition to plant model (5), we must take into account the following limits that are imposed
on the power supply system
V
VS
max
= 0.6kV, I
VS
max
= 20.7kA, (6)
where V
VS
max
is the maximum voltage, I
VS
max
is the maximum current in the VS converter. So,
the linear model (5) together with constraints (6) is considered in the following as the basis for
controller synthesis.
2.2 Optimal control problem formulation
The desired controller must stabilize vertical velocity of the plasma current centroid. One of
the approaches to control synthesis is based on the optimal control theory. In this framework,
plasma vertical stabilization problem can be stated as follows. One needs to find a feedback
control algorithm u
= u (t, y) that provides a minimum of the quadratic cost functional
J
= J(u) =
∞
0
(y
2
(t) + λu
2
(t))dt, (7)
subject to plant model (5) and constraints (6), and guarantees closed-loop stability. Here λ is a
constant multiplier setting the trade-off between controller’s performance and control energy
costs.
Specifically, in order to find an optimal controller, LQG-synthesis can be performed. Such a
controller has high stabilization performance in the unconstrained case. However, it is per-
haps not the best choice in the presence of constraints.
Contrary to this, the MPC synthesis allows to take into account constraints. Its basic scheme
implies on-line optimization of the cost functional (7) over a finite horizon subject to plant
model (5) and imposed constraints (6).
Model Predictive Control202
3. Model Predictive Control Algorithms
3.1 MPC Basic Principles
Suppose we have a mathematical model, which approximately describes control process dy-
namics
˙
˜
x
(τ) = f(τ,
˜
x(τ),
˜
u(τ)),
˜
x
|
τ=t
= x (t). (8)
Here
˜
x
(τ) ∈ E
n
is a state vector,
˜
u(τ) ∈ E
m
is a control vector, τ ∈ [t, ∞), x(t) is the actual
state of the plant at the instant t or its estimation based on measurement output.
This model is used to predict future outputs of the process given the programmed control
˜
u
(τ) over a finite time interval τ ∈ [t, t + T
p
]. Such a model is called prediction model and
the parameter T
p
is named prediction horizon. Integrating system (8) we obtain
˜
x(τ) =
˜
x
(τ, x(t),
˜
u(τ))—predicted process evolution over time interval τ ∈ [t, t + T
p
].
The programmed control
˜
u
(τ) is chosen in order to minimize quadratic cost functional over
the prediction horizon
J
= J(x(t),
˜
u(·), T
p
) =
t+T
p
t
((
˜
x
− r
x
)
R(
˜
x
)(
˜
x
− r
x
) + (
˜
u
− r
u
)
Q(
˜
x
)(
˜
u
− r
u
))dτ, (9)
where R
(
˜
x
)
, Q
(
˜
x
)
are positive definite symmetric weight matrices, r
x
, r
u
are state and con-
trol input reference signals. In addition, the programmed control
˜
u
(τ) should satisfy all of the
constraints imposed on the state and control variables. Therefore, the programmed control
˜
u
(τ) over prediction horizon is chosen to provide minimum of the following optimization
problem
J
(x
(
t
)
,
˜
u
(
·
)
, T
p
) → min
˜
u
(
·
)
∈
Ω
u
, (10)
where Ω
u
is the admissible set given by
Ω
u
=
˜
u
(·) ∈ K
0
n
[t, t + T
p
] :
˜
u(τ) ∈ U,
˜
x(τ, x(t ),
˜
u(τ)) ∈ X, ∀τ ∈ [t, t + T
p
]
. (11)
Here, K
0
n
[t, t + T
p
] is the set of piecewise continuous vector functions over the interval
[t, t + T
p
], U ⊂ E
m
is the set of feasible input values, X ⊂ E
n
is the set of feasible state values.
Denote by
˜
u
∗
(τ) the solution of the optimization problem (10), (11). In order to implement
feedback loop, the obtained optimal programmed control
˜
u
∗
(τ) is used as the input only on
the time interval
[t, t + δ], where δ << T
p
. So, only a small part of
˜
u
∗
(τ) is implemented. At
time t
+ δ the whole procedure—prediction and optimization—is repeated again to find new
optimal programmed control over time interval
[t + δ, t + δ + T
p
]. Summarizing, the basic
MPC scheme works as follows:
1. Obtain the state estimation
ˆ
x on the base of measurements y.
2. Solve the optimization problem (10), (11) subject to prediction model (8) with initial
conditions
˜
x
|
τ=t
=
ˆ
x
(t) and cost functional (9).
3. Implement obtained optimal control
˜
u
∗
(τ) over time interval [t, t + δ].
4. Repeat the whole procedure 1–3 at time t
+ δ.
From the previous discussion, the most significant MPC features can be noted:
• Both linear and nonlinear model of the plant can be used as a prediction model.
• MPC allows taking into account constraints imposed both on the input and output vari-
ables.
• MPC is the feedback control with the discrete entering of the measurement information
at each sampling instant 0, δ, 2δ, . .
• MPC control algorithms imply the repeated (at each sampling instant with interval δ)
on-line solution of the optimization problems. It is especially important from the real-
time implementation point of view, because fast calculations are needed.
3.2 MPC real-time implementation
In order for real-time implementation, piece-wise constant functions are used as a pro-
grammed control over the prediction horizon. That is, the programmed control
˜
u
(τ) is pre-
sented by the sequence
{
˜
u
k
,
˜
u
k+1
, ,
˜
u
k+P−1
}, where
˜
u
i
∈ E
m
is the control input at the time
interval
[
iδ, (i + 1)δ
]
, δ is the sampling interval. Note that, P is a number of sampling intervals
over the prediction horizon, that is T
p
= Pδ. Likewise, general MPC formulation presented
above consider nonlinear prediction model in the discrete form
˜
x
i+1
= f (
˜
x
i
,
˜
u
i
), i = k + j, j = 0, 1, 2, ,
˜
x
k
= x
k
,
˜y
i
= C
˜
x
i
.
(12)
Here ˜y
i
∈ E
r
is the vector of output variables, x
k
∈ E
n
is the actual state of the plant at time
instant k or its estimation on the base of measurement output. We shall say that the sequence
of vectors
{
˜y
k+1
, ˜y
k+2
, , ˜y
k+P
} represents the prediction of future plant behavior.
Similar to the cost functional (9), consider also its discrete analog given by
J
k
= J
k
( ¯y,
¯
u) =
∑
P
j
=1
( ˜y
k+j
− r
y
k
+j
)
T
R
k+j
( ˜y
k+j
− r
y
k
+j
)
+ (
˜
u
k+j−1
− r
u
k
+j−1
)
T
Q
k+j
(
˜
u
k+j−1
− r
u
k
+j−1
)
,
(13)
where R
k+j
and Q
k+j
are the weight matrices as in the functional (9), r
y
i
and r
u
i
are the output
and input reference signals,
¯y
=
˜y
k+1
˜y
k+2
˜y
k+P
T
∈ E
rP
,
¯
u
=
˜
u
k
˜
u
k+1
˜
u
k+P−1
T
∈ E
mP
are the auxiliary vectors.
The optimization problem (10), (11) can now be stated as follows
J
k
(x
k
,
˜
u
k
,
˜
u
k+1
,
˜
u
k+P−1
) → min
{
˜
u
k
,
˜
u
k+1
, ,
˜
u
k+P−1
}∈Ω∈E
mP
, (14)
where Ω
=
¯
u
∈ E
mP
:
˜
u
k+j−1
∈ U,
˜
x
k+j
∈ X, j = 1, 2, , P
is the admissible set.
Generally, the function J
(x
k
,
˜
u
k
,
˜
u
k+1
,
˜
u
k+P−1
) is a nonlinear function of mP variables and Ω
is a non-convex set. Therefore, the optimization task (14) is a nonlinear programming prob-
lem.
Now real-time MPC algorithm can be presented as follows:
1. Obtain the state estimation
ˆ
x
k
based on measurements y
k
using the observer.
2. Solve the nonlinear programming problem (14) subject to prediction model (12) with
initial conditions
˜
x
k
=
ˆ
x
k
and cost functional (13). It should be noted, that the value
of the function J
k
(x
k
,
˜
u
k
,
˜
u
k+1
,
˜
u
k+P−1
) is obtained by numerically integrating the pre-
diction model (12) and then substituting the predicted behavior
¯
x
∈ E
nP
into the cost
function (13) given the programmed control
{
˜
u
k
,
˜
u
k+1
, ,
˜
u
k+P−1
} over the prediction
horizon and initial conditions
ˆ
x
k
.
Plasma stabilization system design on the base of model predictive control 203
3. Model Predictive Control Algorithms
3.1 MPC Basic Principles
Suppose we have a mathematical model, which approximately describes control process dy-
namics
˙
˜
x
(τ) = f(τ,
˜
x(τ),
˜
u(τ)),
˜
x
|
τ=t
= x (t). (8)
Here
˜
x
(τ) ∈ E
n
is a state vector,
˜
u(τ) ∈ E
m
is a control vector, τ ∈ [t, ∞), x(t) is the actual
state of the plant at the instant t or its estimation based on measurement output.
This model is used to predict future outputs of the process given the programmed control
˜
u
(τ) over a finite time interval τ ∈ [t, t + T
p
]. Such a model is called prediction model and
the parameter T
p
is named prediction horizon. Integrating system (8) we obtain
˜
x(τ) =
˜
x
(τ, x(t),
˜
u(τ))—predicted process evolution over time interval τ ∈ [t, t + T
p
].
The programmed control
˜
u
(τ) is chosen in order to minimize quadratic cost functional over
the prediction horizon
J
= J(x(t),
˜
u(·), T
p
) =
t+T
p
t
((
˜
x
− r
x
)
R(
˜
x
)(
˜
x
− r
x
) + (
˜
u
− r
u
)
Q(
˜
x
)(
˜
u
− r
u
))dτ, (9)
where R
(
˜
x
)
, Q
(
˜
x
)
are positive definite symmetric weight matrices, r
x
, r
u
are state and con-
trol input reference signals. In addition, the programmed control
˜
u
(τ) should satisfy all of the
constraints imposed on the state and control variables. Therefore, the programmed control
˜
u
(τ) over prediction horizon is chosen to provide minimum of the following optimization
problem
J
(x
(
t
)
,
˜
u
(
·
)
, T
p
) → min
˜
u
(
·
)
∈
Ω
u
, (10)
where Ω
u
is the admissible set given by
Ω
u
=
˜
u
(·) ∈ K
0
n
[t, t + T
p
] :
˜
u(τ) ∈ U,
˜
x(τ, x(t ),
˜
u(τ)) ∈ X, ∀τ ∈ [t, t + T
p
]
. (11)
Here, K
0
n
[t, t + T
p
] is the set of piecewise continuous vector functions over the interval
[t, t + T
p
], U ⊂ E
m
is the set of feasible input values, X ⊂ E
n
is the set of feasible state values.
Denote by
˜
u
∗
(τ) the solution of the optimization problem (10), (11). In order to implement
feedback loop, the obtained optimal programmed control
˜
u
∗
(τ) is used as the input only on
the time interval
[t, t + δ], where δ << T
p
. So, only a small part of
˜
u
∗
(τ) is implemented. At
time t
+ δ the whole procedure—prediction and optimization—is repeated again to find new
optimal programmed control over time interval
[t + δ, t + δ + T
p
]. Summarizing, the basic
MPC scheme works as follows:
1. Obtain the state estimation
ˆ
x on the base of measurements y.
2. Solve the optimization problem (10), (11) subject to prediction model (8) with initial
conditions
˜
x
|
τ=t
=
ˆ
x
(t) and cost functional (9).
3. Implement obtained optimal control
˜
u
∗
(τ) over time interval [t, t + δ].
4. Repeat the whole procedure 1–3 at time t
+ δ.
From the previous discussion, the most significant MPC features can be noted:
• Both linear and nonlinear model of the plant can be used as a prediction model.
• MPC allows taking into account constraints imposed both on the input and output vari-
ables.
• MPC is the feedback control with the discrete entering of the measurement information
at each sampling instant 0, δ, 2δ, . .
• MPC control algorithms imply the repeated (at each sampling instant with interval δ)
on-line solution of the optimization problems. It is especially important from the real-
time implementation point of view, because fast calculations are needed.
3.2 MPC real-time implementation
In order for real-time implementation, piece-wise constant functions are used as a pro-
grammed control over the prediction horizon. That is, the programmed control
˜
u
(τ) is pre-
sented by the sequence
{
˜
u
k
,
˜
u
k+1
, ,
˜
u
k+P−1
}, where
˜
u
i
∈ E
m
is the control input at the time
interval
[
iδ, (i + 1)δ
]
, δ is the sampling interval. Note that, P is a number of sampling intervals
over the prediction horizon, that is T
p
= Pδ. Likewise, general MPC formulation presented
above consider nonlinear prediction model in the discrete form
˜
x
i+1
= f (
˜
x
i
,
˜
u
i
), i = k + j, j = 0, 1, 2, ,
˜
x
k
= x
k
,
˜y
i
= C
˜
x
i
.
(12)
Here ˜y
i
∈ E
r
is the vector of output variables, x
k
∈ E
n
is the actual state of the plant at time
instant k or its estimation on the base of measurement output. We shall say that the sequence
of vectors
{
˜y
k+1
, ˜y
k+2
, , ˜y
k+P
} represents the prediction of future plant behavior.
Similar to the cost functional (9), consider also its discrete analog given by
J
k
= J
k
( ¯y,
¯
u) =
∑
P
j
=1
( ˜y
k+j
− r
y
k
+j
)
T
R
k+j
( ˜y
k+j
− r
y
k
+j
)
+ (
˜
u
k+j−1
− r
u
k
+j−1
)
T
Q
k+j
(
˜
u
k+j−1
− r
u
k
+j−1
)
,
(13)
where R
k+j
and Q
k+j
are the weight matrices as in the functional (9), r
y
i
and r
u
i
are the output
and input reference signals,
¯y
=
˜y
k+1
˜y
k+2
˜y
k+P
T
∈ E
rP
,
¯
u
=
˜
u
k
˜
u
k+1
˜
u
k+P−1
T
∈ E
mP
are the auxiliary vectors.
The optimization problem (10), (11) can now be stated as follows
J
k
(x
k
,
˜
u
k
,
˜
u
k+1
,
˜
u
k+P−1
) → min
{
˜
u
k
,
˜
u
k+1
, ,
˜
u
k+P−1
}∈Ω∈E
mP
, (14)
where Ω
=
¯
u
∈ E
mP
:
˜
u
k+j−1
∈ U,
˜
x
k+j
∈ X, j = 1, 2, , P
is the admissible set.
Generally, the function J
(x
k
,
˜
u
k
,
˜
u
k+1
,
˜
u
k+P−1
) is a nonlinear function of mP variables and Ω
is a non-convex set. Therefore, the optimization task (14) is a nonlinear programming prob-
lem.
Now real-time MPC algorithm can be presented as follows:
1. Obtain the state estimation
ˆ
x
k
based on measurements y
k
using the observer.
2. Solve the nonlinear programming problem (14) subject to prediction model (12) with
initial conditions
˜
x
k
=
ˆ
x
k
and cost functional (13). It should be noted, that the value
of the function J
k
(x
k
,
˜
u
k
,
˜
u
k+1
,
˜
u
k+P−1
) is obtained by numerically integrating the pre-
diction model (12) and then substituting the predicted behavior
¯
x
∈ E
nP
into the cost
function (13) given the programmed control
{
˜
u
k
,
˜
u
k+1
, ,
˜
u
k+P−1
} over the prediction
horizon and initial conditions
ˆ
x
k
.
Model Predictive Control204
3. Let
{
˜
u
∗
k
,
˜
u
∗
k+1
, ,
˜
u
∗
k+P−1
} be the solution of the problem (14). Implement only the first
component
˜
u
∗
k
of the obtained optimal sequence over time interval [kδ, (k + 1)δ].
4. Repeat the whole procedure 1–3 at next time instant
(k + 1)δ.
Note, that the algorithm stated above implies real-time solution of the nonlinear programming
problem at each sampling instant. The complexity of such a problem is determined by the
number of sampling intervals P.
The simplest way to reduce the optimization problem order is to decrease the prediction hori-
zon. But, it is necessary to keep in mind that the performance of the closed-loop system
depends strongly on the number P of samples. The quality of the processes is decreased if
the prediction horizon is reduced. Moreover, the system can lose stability if the quantity P is
sufficiently small.
So, the following approaches to reduce computational load can be proposed:
1. Using the control horizon. The positive integer number M
< P is called the control
horizon if the following condition hold:
˜
u
k+M−1
=
˜
u
k+M
= =
˜
u
k+P−1
.
Thus, the number of independent variables is decreased from mP to mM. This approach
allows to essentially reduce the optimization problem order. However, if the control
horizon M is too small, the closed-loop stability can be compromised and the quality of
the processes can decrease.
2. Increasing the sampling interval δ and reducing the number P of samples over the pre-
diction horizon. This also allows to decrease the optimization problem order while
preserving the value of the prediction horizon.
3. The computational consumption also depends on the prediction model used. So, one
needs to use as simple models as possible. But the prediction model should adequately
reflect the dynamics of the plant considered. The simplest case is using the linear pre-
diction model.
3.3 Linear MPC
In this particular case, MPC is based on the linear prediction model. These algorithms are
computationally efficient which is especially important from the real-time implementation
point of view.
Generally, linear prediction model is presented by
˜
x
i+1
= A
˜
x
i
+ B
˜
u
i
, i = k + j, j = 0, 1, 2, ,
˜
x
k
= x
k
,
˜y
i
= C
˜
x
i
.
(15)
Suppose
¯
u
=
˜
u
k
˜
u
k+1
˜
u
k+P−1
T
is the programmed control over the prediction
horizon. Then, integrating (15) we obtain future outputs of the plant in the form
¯y
= L x
k
+ M
¯
u, (16)
where
L
=
CA
CA
2
.
.
.
CA
P
, M
=
CB 0 . . . 0
CAB
.
.
.
.
.
.
.
.
.
CA
P−1
B . . . CAB CB
.
Substituting (16) into (13) we get
J
k
= J
k
(x
k
,
¯
u) =
¯
u
T
H
¯
u + 2f
T
¯
u
+ g. (17)
Here we assumed that all weight matrices are equal, that is
R
k+1
= R
k+2
= = R
k+P
= R,
Q
k+1
= Q
k+2
= = Q
k+P
= Q.
The matrix H and vector f in (17) are as follows
H
= M
RM + Q, f = M
RLx
k
. (18)
It can easily be shown that in this case the optimization problem (14) is reduced to the
quadratic programming problem of the form
J
k
(x
k
,
˜
u
k
,
˜
u
k+1
, ,
˜
u
k+P−1
) =
¯
u
T
H
¯
u + 2f
T
¯
u
+ g → min
¯
u
∈Ω⊂E
mP
. (19)
Here H is a positive definite matrix and Ω is a convex set defined by the system of linear con-
straints. On-line solution of the optimization problem (19) at each sampling instant generally
leads to nonlinear feedback control law.
Note that the optimization problem (19) can be solved analytically for the unconstrained case.
The result is the linear controller
˜
u
k
= K
˜
x
k
, (20)
which converges to the LQR-optimal one as P is increased. This convergence is obvious, be-
cause the discrete LQR controller minimizes the functional (13) with infinity prediction hori-
zon for linear model (15).
4. Model Predictive Control on the base of modal parametrical optimization
In this section a new approach to MPC control algorithm synthesis is considered. The key
feature of corresponding algorithms is that they guarantee linear closed-loop system stability
at each sampling period. It is necessary to remark that in the case of traditional MPC algorithm
implementation, described above, closed-loop system stability can be provided only for the
simplest case when we have a linear prediction model, quadratic cost functional and without
constraints.
Let us assume that the mathematical model of the plant to be controlled is described by the
following system of difference equations
ˆ
x
k+1
= F (
ˆ
x
k
,
ˆ
u
k
,
ˆ
ϕ
k
),
ˆy
k
= C
ˆ
x
k
.
(21)
Here ˆy
k
∈ E
s
is the vector of output variables,
ˆ
x
k
∈ E
n
is the state space vector,
ˆ
u
k
∈ E
m
is the
vector of controls,
ˆ
ϕ
k
∈ E
l
is the vector of external disturbances.
Equations (21) can be used as a basis for nonlinear prediction model construction. Suppose
that obtained prediction model is given by
˜
x
i+1
= f (
˜
x
i
,
˜
u
i
), i = k + j, j = 0, 1, 2, ,
˜
x
k
= x
k
,
˜y
i
= C
˜
x
i
.
(22)
Plasma stabilization system design on the base of model predictive control 205
3. Let
{
˜
u
∗
k
,
˜
u
∗
k+1
, ,
˜
u
∗
k+P−1
} be the solution of the problem (14). Implement only the first
component
˜
u
∗
k
of the obtained optimal sequence over time interval [kδ, (k + 1)δ].
4. Repeat the whole procedure 1–3 at next time instant
(k + 1)δ.
Note, that the algorithm stated above implies real-time solution of the nonlinear programming
problem at each sampling instant. The complexity of such a problem is determined by the
number of sampling intervals P.
The simplest way to reduce the optimization problem order is to decrease the prediction hori-
zon. But, it is necessary to keep in mind that the performance of the closed-loop system
depends strongly on the number P of samples. The quality of the processes is decreased if
the prediction horizon is reduced. Moreover, the system can lose stability if the quantity P is
sufficiently small.
So, the following approaches to reduce computational load can be proposed:
1. Using the control horizon. The positive integer number M
< P is called the control
horizon if the following condition hold:
˜
u
k+M−1
=
˜
u
k+M
= =
˜
u
k+P−1
.
Thus, the number of independent variables is decreased from mP to mM. This approach
allows to essentially reduce the optimization problem order. However, if the control
horizon M is too small, the closed-loop stability can be compromised and the quality of
the processes can decrease.
2. Increasing the sampling interval δ and reducing the number P of samples over the pre-
diction horizon. This also allows to decrease the optimization problem order while
preserving the value of the prediction horizon.
3. The computational consumption also depends on the prediction model used. So, one
needs to use as simple models as possible. But the prediction model should adequately
reflect the dynamics of the plant considered. The simplest case is using the linear pre-
diction model.
3.3 Linear MPC
In this particular case, MPC is based on the linear prediction model. These algorithms are
computationally efficient which is especially important from the real-time implementation
point of view.
Generally, linear prediction model is presented by
˜
x
i+1
= A
˜
x
i
+ B
˜
u
i
, i = k + j, j = 0, 1, 2, ,
˜
x
k
= x
k
,
˜y
i
= C
˜
x
i
.
(15)
Suppose
¯
u
=
˜
u
k
˜
u
k+1
˜
u
k+P−1
T
is the programmed control over the prediction
horizon. Then, integrating (15) we obtain future outputs of the plant in the form
¯y
= L x
k
+ M
¯
u, (16)
where
L
=
CA
CA
2
.
.
.
CA
P
, M
=
CB 0 . . . 0
CAB
.
.
.
.
.
.
.
.
.
CA
P−1
B . . . CAB CB
.
Substituting (16) into (13) we get
J
k
= J
k
(x
k
,
¯
u) =
¯
u
T
H
¯
u + 2f
T
¯
u
+ g. (17)
Here we assumed that all weight matrices are equal, that is
R
k+1
= R
k+2
= = R
k+P
= R,
Q
k+1
= Q
k+2
= = Q
k+P
= Q.
The matrix H and vector f in (17) are as follows
H
= M
RM + Q, f = M
RLx
k
. (18)
It can easily be shown that in this case the optimization problem (14) is reduced to the
quadratic programming problem of the form
J
k
(x
k
,
˜
u
k
,
˜
u
k+1
, ,
˜
u
k+P−1
) =
¯
u
T
H
¯
u + 2f
T
¯
u
+ g → min
¯
u
∈Ω⊂E
mP
. (19)
Here H is a positive definite matrix and Ω is a convex set defined by the system of linear con-
straints. On-line solution of the optimization problem (19) at each sampling instant generally
leads to nonlinear feedback control law.
Note that the optimization problem (19) can be solved analytically for the unconstrained case.
The result is the linear controller
˜
u
k
= K
˜
x
k
, (20)
which converges to the LQR-optimal one as P is increased. This convergence is obvious, be-
cause the discrete LQR controller minimizes the functional (13) with infinity prediction hori-
zon for linear model (15).
4. Model Predictive Control on the base of modal parametrical optimization
In this section a new approach to MPC control algorithm synthesis is considered. The key
feature of corresponding algorithms is that they guarantee linear closed-loop system stability
at each sampling period. It is necessary to remark that in the case of traditional MPC algorithm
implementation, described above, closed-loop system stability can be provided only for the
simplest case when we have a linear prediction model, quadratic cost functional and without
constraints.
Let us assume that the mathematical model of the plant to be controlled is described by the
following system of difference equations
ˆ
x
k+1
= F (
ˆ
x
k
,
ˆ
u
k
,
ˆ
ϕ
k
),
ˆy
k
= C
ˆ
x
k
.
(21)
Here ˆy
k
∈ E
s
is the vector of output variables,
ˆ
x
k
∈ E
n
is the state space vector,
ˆ
u
k
∈ E
m
is the
vector of controls,
ˆ
ϕ
k
∈ E
l
is the vector of external disturbances.
Equations (21) can be used as a basis for nonlinear prediction model construction. Suppose
that obtained prediction model is given by
˜
x
i+1
= f (
˜
x
i
,
˜
u
i
), i = k + j, j = 0, 1, 2, ,
˜
x
k
= x
k
,
˜y
i
= C
˜
x
i
.
(22)
Model Predictive Control206
Here x
k
∈ E
n
is the actual state of the plant at time instant k or its estimation on the base of
measurement output.
Let desired object dynamics is presented by the given vector sequences
{r
x
k
} and {r
u
k
}, k =
0,1,2, . The linear mathematical model of the plant, describing its behavior in the neighbour-
hood of the desired trajectory, can be obtained by performing the equations (21) linearization.
As a result of this action, we get the linear system of difference equations
¯
x
k+1
= A
¯
x
k
+ B
¯
u
k
+ H
¯
ϕ
k
,
¯y
k
= C
¯
x
k
,
(23)
where
¯
x
k
∈ E
n
,
¯
u
k
∈ E
m
, ¯y
k
∈ E
s
,
¯
ϕ
k
∈ E
l
are the vectors of the state, control input, measure-
ments and external disturbances respectively. These vectors represent the deviations from the
desired trajectory. Next we shall consider only such situations when all matrices in equations
(23) have constant elements. In the framework of proposed approach, the control input over
the prediction horizon is generated by the controller of the form
¯
u
k
= W (q, h)¯y
k
. (24)
Here q is the shift operator, W
(q, h) is the controller transfer function with the fixed structure
(that is the degrees of the polynomials in the numerator and denominator of all its components
are given and fixed), h
∈ E
r
is the vector of tuned parameters, which must be chosen on the
stage of control design.
The prediction model equations (22), closed by the feedback (24), can be presented as follows
˜
x
i+1
= f (
˜
x
i
,
˜
u
i
), i = k + j, j = 0, 1, 2, ,
˜
x
k
= x
k
,
˜
u
i
= r
u
i
+ W(q, h)C(
˜
x
i
− r
x
i
).
(25)
Let us assume that parameters vector h is chosen and fixed. Then we can solve system of
difference equations (25) with a given initial conditions for the instants i
= k, k + 1, , k + P −
1. As a result we obtain vectors sequence {
˜
x
i
}, (i = k + 1, , k + P), which represents the
prediction of future plant behavior over the prediction horizon P. It must be noted, that the
control sequence
˜
u
k
,
˜
u
k+1
,
˜
u
k+P−1
over this horizon is determined uniquely by the choice
of parameter vector h. So, in this case the problem of control is reduced to the problem of
parameters vector h tuning.
The controlled processes quality over the prediction horizon P can be presented by the fol-
lowing cost functional
J
k
= J
k
({
˜
x
i
}, {
˜
u
i
}) = J
k
(W(q, h)) = J
k
(h) ≥ 0, (26)
where
{
˜
x
i
}, i = k + 1, , k + P, {
˜
u
i
}, i = k, , k + P − 1 are the state and control vectors
sequences correspondently, which satisfies the system of equations (25). It is easy to see, that
the cost functional (26) is reduced to the function of parameter vector h.
Let us consider the following optimization problem
J
k
= J
k
(h) → inf
h∈Ω
H
, (27)
where Ω
H
is a set of parameter vectors providing that the eigenvalues of the closed-loop
system (23), (24) are placed in the desired area C
∆
inside a unit circle.
It is necessary to remark that the problem (27) is a nonlinear programming problem with an
extremely complicated definition of the cost function, which, in generall, has no analytical
representation and is given only algorithmically. Besides that, the specific character of the
problem (27) is also defined by the complicated constraints imposed, which determines the
admissible areas of eigenvalues displacement. It must be noted, that the dimension of the
optimization problem (27) is defined only by the dimension of parameter vector h and it does
not depend on the prediction horizon P value.
Definition 1. We shall say that the controller (24) has a full structure if the degrees of polyno-
mials in the numerators and denominators of the matrix W
(q, h) components and the struc-
ture of parameter vector h are such that it is possible to assign any given roots for closed-loop
system (23),(24) characteristic polynomial ∆
(z, h) by appropriate selection of parameter vector
h.
In order to get another form of the presented definition, consider the equations of the closed-
loop system (23),(24). They can be represented in the normal form as follows
¯
x
k+1
= A
¯
x
k
+ B
¯
u
k
+ H
¯
ϕ
k
,
¯y
k
= C
¯
x
k
,
ξ
k+1
= A
c
(h)ξ
k
+ B
c
(h) ¯y
k
,
¯
u
k
= C
c
(h)ξ
k
+ D
c
(h) ¯y
k
,
(28)
where ξ
k
∈ E
ν
is a controller (24) state vector. After applying Z-transformation to the system
of equations (28) with zero initial conditions, obtain
(E
n
z − A)
¯
x
= B
¯
u + H
¯
ϕ,
(E
ν
z − A
c
(h))ξ = B
c
(h)C
¯
x,
¯
u
= C
c
(h)ξ + D
c
(h)C
¯
x,
¯y
= C
¯
x,
or
E
n
z − A − BD
c
(h)C −BC
c
(h)
−
B
c
(h)C E
ν
z − A
c
(h)
¯
x
ξ
=
H
0
¯
ϕ.
Therefore, the closed-loop system characteristic polynomial ∆
(z, h) is given by
∆
(z, h) = det
E
n
z − A − BD
c
(h)C −BC
c
(h)
−
B
c
(h)C E
ν
z − A
c
(h)
.
Let us denote the degree of the polinomial ∆
(z, h) by n
d
.
Let find parameter vector h, which provide a given roots for the system (28) characteristic
polynomial. In other words, it is nesessary to find such parameter vector h that provide the
following identity
∆
(z, h) ≡
˜
∆
(z),
where
˜
∆
(z) is a given polynomial with degree n
d
, having desired roots. In order to find vector
h, equate the correspondent coefficients for the same degrees of z-variable. As a result obtain
the system of
(n
d
+ 1) nonlinear equations with r unknown components of vector h in the
form
L
(h) = γ. (29)
It is evident that the controller (24) has a full structure if and only if the system of equations
(33) has a solution for any vector γ.
Plasma stabilization system design on the base of model predictive control 207
Here x
k
∈ E
n
is the actual state of the plant at time instant k or its estimation on the base of
measurement output.
Let desired object dynamics is presented by the given vector sequences
{r
x
k
} and {r
u
k
}, k =
0,1,2, . The linear mathematical model of the plant, describing its behavior in the neighbour-
hood of the desired trajectory, can be obtained by performing the equations (21) linearization.
As a result of this action, we get the linear system of difference equations
¯
x
k+1
= A
¯
x
k
+ B
¯
u
k
+ H
¯
ϕ
k
,
¯y
k
= C
¯
x
k
,
(23)
where
¯
x
k
∈ E
n
,
¯
u
k
∈ E
m
, ¯y
k
∈ E
s
,
¯
ϕ
k
∈ E
l
are the vectors of the state, control input, measure-
ments and external disturbances respectively. These vectors represent the deviations from the
desired trajectory. Next we shall consider only such situations when all matrices in equations
(23) have constant elements. In the framework of proposed approach, the control input over
the prediction horizon is generated by the controller of the form
¯
u
k
= W (q, h)¯y
k
. (24)
Here q is the shift operator, W
(q, h) is the controller transfer function with the fixed structure
(that is the degrees of the polynomials in the numerator and denominator of all its components
are given and fixed), h
∈ E
r
is the vector of tuned parameters, which must be chosen on the
stage of control design.
The prediction model equations (22), closed by the feedback (24), can be presented as follows
˜
x
i+1
= f (
˜
x
i
,
˜
u
i
), i = k + j, j = 0, 1, 2, ,
˜
x
k
= x
k
,
˜
u
i
= r
u
i
+ W(q, h)C(
˜
x
i
− r
x
i
).
(25)
Let us assume that parameters vector h is chosen and fixed. Then we can solve system of
difference equations (25) with a given initial conditions for the instants i
= k, k + 1, , k + P −
1. As a result we obtain vectors sequence {
˜
x
i
}, (i = k + 1, , k + P), which represents the
prediction of future plant behavior over the prediction horizon P. It must be noted, that the
control sequence
˜
u
k
,
˜
u
k+1
,
˜
u
k+P−1
over this horizon is determined uniquely by the choice
of parameter vector h. So, in this case the problem of control is reduced to the problem of
parameters vector h tuning.
The controlled processes quality over the prediction horizon P can be presented by the fol-
lowing cost functional
J
k
= J
k
({
˜
x
i
}, {
˜
u
i
}) = J
k
(W(q, h)) = J
k
(h) ≥ 0, (26)
where
{
˜
x
i
}, i = k + 1, , k + P, {
˜
u
i
}, i = k, , k + P − 1 are the state and control vectors
sequences correspondently, which satisfies the system of equations (25). It is easy to see, that
the cost functional (26) is reduced to the function of parameter vector h.
Let us consider the following optimization problem
J
k
= J
k
(h) → inf
h∈Ω
H
, (27)
where Ω
H
is a set of parameter vectors providing that the eigenvalues of the closed-loop
system (23), (24) are placed in the desired area C
∆
inside a unit circle.
It is necessary to remark that the problem (27) is a nonlinear programming problem with an
extremely complicated definition of the cost function, which, in generall, has no analytical
representation and is given only algorithmically. Besides that, the specific character of the
problem (27) is also defined by the complicated constraints imposed, which determines the
admissible areas of eigenvalues displacement. It must be noted, that the dimension of the
optimization problem (27) is defined only by the dimension of parameter vector h and it does
not depend on the prediction horizon P value.
Definition 1. We shall say that the controller (24) has a full structure if the degrees of polyno-
mials in the numerators and denominators of the matrix W
(q, h) components and the struc-
ture of parameter vector h are such that it is possible to assign any given roots for closed-loop
system (23),(24) characteristic polynomial ∆
(z, h) by appropriate selection of parameter vector
h.
In order to get another form of the presented definition, consider the equations of the closed-
loop system (23),(24). They can be represented in the normal form as follows
¯
x
k+1
= A
¯
x
k
+ B
¯
u
k
+ H
¯
ϕ
k
,
¯y
k
= C
¯
x
k
,
ξ
k+1
= A
c
(h)ξ
k
+ B
c
(h) ¯y
k
,
¯
u
k
= C
c
(h)ξ
k
+ D
c
(h) ¯y
k
,
(28)
where ξ
k
∈ E
ν
is a controller (24) state vector. After applying Z-transformation to the system
of equations (28) with zero initial conditions, obtain
(E
n
z − A)
¯
x
= B
¯
u + H
¯
ϕ,
(E
ν
z − A
c
(h))ξ = B
c
(h)C
¯
x,
¯
u
= C
c
(h)ξ + D
c
(h)C
¯
x,
¯y
= C
¯
x,
or
E
n
z − A − BD
c
(h)C −BC
c
(h)
−
B
c
(h)C E
ν
z − A
c
(h)
¯
x
ξ
=
H
0
¯
ϕ.
Therefore, the closed-loop system characteristic polynomial ∆
(z, h) is given by
∆
(z, h) = det
E
n
z − A − BD
c
(h)C −BC
c
(h)
−
B
c
(h)C E
ν
z − A
c
(h)
.
Let us denote the degree of the polinomial ∆
(z, h) by n
d
.
Let find parameter vector h, which provide a given roots for the system (28) characteristic
polynomial. In other words, it is nesessary to find such parameter vector h that provide the
following identity
∆
(z, h) ≡
˜
∆
(z),
where
˜
∆
(z) is a given polynomial with degree n
d
, having desired roots. In order to find vector
h, equate the correspondent coefficients for the same degrees of z-variable. As a result obtain
the system of
(n
d
+ 1) nonlinear equations with r unknown components of vector h in the
form
L
(h) = γ. (29)
It is evident that the controller (24) has a full structure if and only if the system of equations
(33) has a solution for any vector γ.
Model Predictive Control208
It can be easy shown that if the parameter vector h consists of the coefficients of numerator
and denominator polynomials of matrix W
(q, h), then the system (29) reduced to the linear
system of the form
Lh
= γ, (30)
where L is a constant matrix. Note that for any case, the controller (24) has a full structure
only if the system (23) is fully controllable and observable.
Let us now refine the optimization problem (27) statement in suppose that the controller (23)
has a full structure and that the following set Ω
H
is determined as admissible set of the form
Ω
H
= { h ∈ E
r
: δ
i
(h) ∈ C
∆
, i = 1, 2, , n
d
}. (31)
Here δ
i
is the roots of the characteristic polynomial ∆(z, h), n
d
= d eg∆(z, h).
Let consider two different variants of the desired areas C
∆
, depicted in Fig. 2. This areas are
located inside a unit circle, i. e. r
< 1.
(a) area C
∆1
(b) area C
∆2
Fig. 2. The areas C
∆1
and C
∆2
of the desired root displacement
The formalized description for the desired areas C
∆
are as follows:
C
∆
= C
∆1
= { z ∈ C
1
: | z| ≤ r}, where r ∈ (0, 1) is a given real number;
C
∆
= C
∆2
= {z ∈ C
1
: z = ρexp(±iϕ), 0 ≤ ρ ≤ r, 0 ≤ ϕ ≤ ψ(ρ)}, where r ∈ (0, 1) is a
given real number, ψ
(ξ) is a real function of variable ξ ∈ (0, r], which takes the values on the
interval
[0, π] and ψ(r) = 0.
The reasons of these areas introduction is obvious. The first area C
∆1
determines the lower
bound for the closed-loop system stability margin and, therefore, the settling time for transient
processes. Second area C
∆2
determines stability bound and, in addition, constraints on the
closed-loop system oscillations.
In order to form the algorithm for the problem (27) solution on the admissible set (31), let us
firstly perform the parametrization of the considered areas C
∆
with the n-dimensional real
vectors on the base of the following statement.
Theorem 1. For any real vector γ
∈ E
n
d
the roots of the polynomial ∆
∗
(z, γ), given by the formulas
presented below, are located inside the area C
∆1
or on its bound. And reversly, if the roots of the some
polynomial ∆(z) are located inside the area C
∆1
and, in addition, all its real roots are positive, then it
can be found such a vector γ
∈ E
n
d
that the following identity holds ∆(z) ≡ ∆
∗
(z, γ). Here
∆
∗
(z, γ) =
d
∏
i=1
(z
2
+ a
1
i
(γ, r)z + a
0
i
(γ, r)), (32)
if n
d
is even, d = n
d
/2;
∆
∗
(z, γ) = (z − a
d+1
(γ, r))
d
∏
i=1
(z
2
+ a
1
i
(γ, r)z + a
0
i
(γ, r)), (33)
if n
d
is odd, d = [n
d
/2];
a
1
i
(γ, r) = −r
exp
−
γ
2
i1
2
+
γ
4
i1
4
− γ
2
i2
+ exp
−
γ
2
i1
2
−
γ
4
i1
4
− γ
2
i2
,
a
0
i
(γ, r) = r
2
exp
−γ
2
i1
, i
= 1, , d, a
d+1
(γ, r) = r exp
−γ
2
d0
,
(34)
γ
= { γ
11
, γ
12
, γ
21
, γ
22
, , γ
d1
, γ
d2
, γ
d0
}. (35)
Proof If the n
d
is even, then the proof of the direct and reverse propositions arises from the
elementary properties of the quadratic trinomials in the formula (32). Really, for any given
pair of the real numbers γ
i1
, γ
i2
the roots of the trinomial ∆
∗
i
(z) in (32) are presented by the
expression
z
i
1,2
= r · exp
−
γ
2
i1
2
±
γ
4
i1
4
− γ
2
i2
.
From this expression it follows that
|z
i
1,2
| ≤ r and, therefore, the roots z
i
1,2
of the trinomial are
located inside the area C
∆1
or on its bound, and this proves the direct proposition.
In order to prove reverse one, let consider some quadratic trinomial of the form ∆
i
(z) =
z
2
+ β
1
z + β
0
. By the conditions of the reverse proposition, the roots z
1,2
of this trinomial are
located inside the area C
∆1
and, if the roots are real numbers, then they are positive. In order
to locate the roots z
1,2
inside the area C
∆1
, it is necessary and sufficient that the following
relations holds
1
−
β
1
r
+
β
0
r
2
≥ 0, 1 −
β
0
r
2
≥ 0, 1 +
β
1
r
+
β
0
r
2
≥ 0. (36)
Besides that, the roots product z
1
z
2
is positive in anycase if they are being complex conjugated
pair or positive real numbers. Therefore, the following inequality is true
β
0
> 0. (37)
Let find such numbers γ
i1
and γ
i2
that the identity ∆
∗
i
(z) ≡ ∆
i
(z) is satisfied. By equating the
correspondent coefficients for the same degrees of z-variable, obtain
−r
exp
−
γ
2
i1
2
+
γ
4
i1
4
− γ
2
i2
+ exp
−
γ
2
i1
2
−
γ
4
i1
4
− γ
2
i2
= β
1
,
r
2
exp( −γ
2
i1
) = β
0
,
Plasma stabilization system design on the base of model predictive control 209
It can be easy shown that if the parameter vector h consists of the coefficients of numerator
and denominator polynomials of matrix W
(q, h), then the system (29) reduced to the linear
system of the form
Lh
= γ, (30)
where L is a constant matrix. Note that for any case, the controller (24) has a full structure
only if the system (23) is fully controllable and observable.
Let us now refine the optimization problem (27) statement in suppose that the controller (23)
has a full structure and that the following set Ω
H
is determined as admissible set of the form
Ω
H
= { h ∈ E
r
: δ
i
(h) ∈ C
∆
, i = 1, 2, , n
d
}. (31)
Here δ
i
is the roots of the characteristic polynomial ∆(z, h), n
d
= d eg∆(z, h).
Let consider two different variants of the desired areas C
∆
, depicted in Fig. 2. This areas are
located inside a unit circle, i. e. r
< 1.
(a) area C
∆1
(b) area C
∆2
Fig. 2. The areas C
∆1
and C
∆2
of the desired root displacement
The formalized description for the desired areas C
∆
are as follows:
C
∆
= C
∆1
= { z ∈ C
1
: | z| ≤ r}, where r ∈ (0, 1) is a given real number;
C
∆
= C
∆2
= {z ∈ C
1
: z = ρexp(±iϕ), 0 ≤ ρ ≤ r, 0 ≤ ϕ ≤ ψ(ρ)}, where r ∈ (0, 1) is a
given real number, ψ
(ξ) is a real function of variable ξ ∈ (0, r], which takes the values on the
interval
[0, π] and ψ(r) = 0.
The reasons of these areas introduction is obvious. The first area C
∆1
determines the lower
bound for the closed-loop system stability margin and, therefore, the settling time for transient
processes. Second area C
∆2
determines stability bound and, in addition, constraints on the
closed-loop system oscillations.
In order to form the algorithm for the problem (27) solution on the admissible set (31), let us
firstly perform the parametrization of the considered areas C
∆
with the n-dimensional real
vectors on the base of the following statement.
Theorem 1. For any real vector γ
∈ E
n
d
the roots of the polynomial ∆
∗
(z, γ), given by the formulas
presented below, are located inside the area C
∆1
or on its bound. And reversly, if the roots of the some
polynomial ∆(z) are located inside the area C
∆1
and, in addition, all its real roots are positive, then it
can be found such a vector γ
∈ E
n
d
that the following identity holds ∆(z) ≡ ∆
∗
(z, γ). Here
∆
∗
(z, γ) =
d
∏
i=1
(z
2
+ a
1
i
(γ, r)z + a
0
i
(γ, r)), (32)
if n
d
is even, d = n
d
/2;
∆
∗
(z, γ) = (z − a
d+1
(γ, r))
d
∏
i=1
(z
2
+ a
1
i
(γ, r)z + a
0
i
(γ, r)), (33)
if n
d
is odd, d = [n
d
/2];
a
1
i
(γ, r) = −r
exp
−
γ
2
i1
2
+
γ
4
i1
4
− γ
2
i2
+ exp
−
γ
2
i1
2
−
γ
4
i1
4
− γ
2
i2
,
a
0
i
(γ, r) = r
2
exp
−γ
2
i1
, i
= 1, , d, a
d+1
(γ, r) = r exp
−γ
2
d0
,
(34)
γ
= { γ
11
, γ
12
, γ
21
, γ
22
, , γ
d1
, γ
d2
, γ
d0
}. (35)
Proof If the n
d
is even, then the proof of the direct and reverse propositions arises from the
elementary properties of the quadratic trinomials in the formula (32). Really, for any given
pair of the real numbers γ
i1
, γ
i2
the roots of the trinomial ∆
∗
i
(z) in (32) are presented by the
expression
z
i
1,2
= r · exp
−
γ
2
i1
2
±
γ
4
i1
4
− γ
2
i2
.
From this expression it follows that
|z
i
1,2
| ≤ r and, therefore, the roots z
i
1,2
of the trinomial are
located inside the area C
∆1
or on its bound, and this proves the direct proposition.
In order to prove reverse one, let consider some quadratic trinomial of the form ∆
i
(z) =
z
2
+ β
1
z + β
0
. By the conditions of the reverse proposition, the roots z
1,2
of this trinomial are
located inside the area C
∆1
and, if the roots are real numbers, then they are positive. In order
to locate the roots z
1,2
inside the area C
∆1
, it is necessary and sufficient that the following
relations holds
1
−
β
1
r
+
β
0
r
2
≥ 0, 1 −
β
0
r
2
≥ 0, 1 +
β
1
r
+
β
0
r
2
≥ 0. (36)
Besides that, the roots product z
1
z
2
is positive in anycase if they are being complex conjugated
pair or positive real numbers. Therefore, the following inequality is true
β
0
> 0. (37)
Let find such numbers γ
i1
and γ
i2
that the identity ∆
∗
i
(z) ≡ ∆
i
(z) is satisfied. By equating the
correspondent coefficients for the same degrees of z-variable, obtain
−r
exp
−
γ
2
i1
2
+
γ
4
i1
4
− γ
2
i2
+ exp
−
γ
2
i1
2
−
γ
4
i1
4
− γ
2
i2
= β
1
,
r
2
exp( −γ
2
i1
) = β
0
,
Model Predictive Control210
and consequently
γ
i1
=
−ln
(
β
0
/r
2
)
,
γ
i2
=
−
1
4
ln
w
r
2
β
0
ln
w
β
0
r
2
, where w
=
β
2
1
2β
0
− 1 +
β
2
1
2β
0
− 1
2
− 1.
(38)
Now let verify that the γ
i1
and γ
i2
, given by the formulas (38), are the real numbers.
Really, from the inequalities (36), (37) it follows that 0
< β
0
/r
2
≤ 1, therefore −ln
β
0
/r
2
≥ 0
and γ
i1
is a real number.
Let show that the expression under radical in the formula for γ
i2
is nonnegative. For the
first, consider the case when the trinomial ∆
i
(z) has two real positive roots z
1,2
. Then his
coefficients must satisfies to the condition β
2
1
− 4β
0
≥ 0, whence it follows that w ≥ 1 – is a
real number. As a result, taking into account (36), we obtain
ln
w
· r
2
/β
0
≥ 0. (39)
It could be noted that the inequalities (36) implies also the satisfaction of the inequality
β
2
1
− 2β
0
≤ r
2
+ β
0
/r
2
. Hence, we have
wβ
0
≤ r
2
, and − ln
wβ
0
/r
2
≥ 0. (40)
Thus from the inequalities (39) and (40) it is easy to see that the expression under radical in
the formula for γ
i2
is nonnegative and γ
i2
is a real number.
Consider now a case, when the trinomial ∆
i
(z) has a pair of complex-conjugate roots z
1,2
.
Then the following inequality is hold β
2
1
− 4β
0
< 0, and therefore w is a complex number,
which can be presented in the form w
= β
2
1
/2β
0
− 1 + i
1 −
β
2
1
/2β
0
− 1
2
. It is not difficult
to see that
|w| = 1, hence, the expression under the radical for γ
i2
has a form
γ
i2
=
−
1
4
ln
r
2
β
0
+ i · argw
ln
β
0
r
2
+ i · argw
=
1
4
ln
2
r
2
β
0
+ arg
2
w
,
i.e. it is nonnegative and γ
i2
is a real number.
If the n
d
is odd, the polynomial ∆
∗
has, in according to (33), an additional linear binomial, for
which the propositions of the theorem are evident.
Now consider more difficult second variant of the admissible set C
∆
. Let us prove the analo-
gous theorem, which allows to perform parametrization of this area.
Theorem 2. For any real vector γ
∈ E
n
d
the roots of the polynomial ∆
∗
(z, γ) (32),(33) are located
inside the area C
∆2
, and reversly, if the roots of the some polynomial ∆ (z) are located inside the area
C
∆2
and, in addition, all its real roots are positive, then it can be found such a vector γ ∈ E
n
d
that the
following identity holds ∆
(z) ≡ ∆
∗
(z, γ). Here
a
1
i
(γ, r) = −r
exp
−γ
2
i1
+ ν
i
+ exp
−γ
2
i1
− ν
i
,
a
0
i
(γ, r) = r
2
exp
−2γ
2
i1
, i
= 1, , d, a
d+1
(γ, r) = r · exp(−γ
2
d0
),
(41)
where ν
i
=
γ
4
i1
− f
(
γ
i2
)
ψ
2
r
· exp
−γ
2
i1
+ γ
4
i1
, i
= 1, 2, , d; γ =
{
γ
11
, γ
12
, γ
21
, γ
22
, , γ
d1
, γ
d2
, γ
d0
}.
The function f is such that f
(·) : ( −∞ , +∞) → (0, 1) and its inverse function exists in the whole
region of the definition; the function ψ
(ξ) is a real function from the variable ξ ∈ (0, r], which takes
the values in the interval
[0, π] and ψ(r) = 0.
Proof Similar to theorem 1, consider the properties of the quadratic trinomials in (32). Firstly,
let prove a direct proposition.
For any given pair of the real numbers γ
i1
, γ
i2
the roots of the trinomial ∆
∗
i
(z) in (32) is given
by the expression z
i
1,2
= r · exp(−γ
2
i1
± ν
i
). Here two different variants are possible. If ν
i
is a
real number, then the roots z
i
1,2
are also real. Besides that, taking into account the properties
of the function f , the following inequality holds γ
4
i1
− f (γ
i2
)
ψ
2
r
· exp(−γ
2
i1
)
+ γ
4
i1
≤ γ
4
i1
.
Hence the roots are positive and
|z
i
1,2
| ≤ r, that is z
i
1,2
∈ C
∆2
.
If ν
i
is a complex number, then z
i
1,2
is the pair of complex-conjugated roots and
|z
i
1,2
| = ρ = r · exp(−γ
2
i1
) ≤ r. Taking into account the properties of the function f , the
following inequality is valid
ϕ
=
f
(γ
i2
)
ψ
2
r
· exp(−γ
2
i1
)
+ γ
4
i1
− γ
4
i1
≤
ψ
2
r
· exp(−γ
2
i1
)
= ψ (ρ). (42)
Since the arg z
i
1,2
= ±ϕ and, accordingly to (42), 0 ≤ ϕ ≤ ψ(ρ), then the roots z
i
1,2
are located
inside the area C
∆2
, so the direct proposition is proven.
Let consider the reverse proposition. The roots z
1,2
of some trinomial ∆
i
(z) = z
2
+ β
1
z +
β
0
are located inside the area C
∆2
in accordance with the reverse proposition if these roots
are positive real numbers. Notice that the coefficients of this trinomial must satisfy to the
inequalities (36),(37), because
|z
1,2
| ≤ r and the roots product z
1
z
2
is positive in any way.
Let find such numbers γ
i1
, γ
i2
that the identity ∆
∗
i
(z) ≡ ∆
i
(z) holds. By equating the corre-
spondent coefficients for the same degrees of z-variable, obtain
−r
exp
−γ
2
i1
+ ν
i
+ exp
−γ
2
i1
− ν
i
= β
i
, r
2
exp( −2γ
2
i1
) = β
0
,
hence
γ
i1
=
−0.5 · ln(β
0
/r
2
),
f
(γ
i2
) =
1
4
ψ
2
r
· exp(−γ
2
i1
)
+ γ
4
i1
ln
2
β
0
r
2
− ln
2
β
2
1
2β
0
− 1 +
β
2
1
2β
0
− 1
2
− 1
.
Let us show that the γ
i2
is a real number. For γ
i1
the proof is equivalent to the such one in the
first theorem.
It is evident that the equation with respect to γ
i2
has a solution, if the expression in the right
part of it takes the values inside the interval (0,1). Let denote this expression by h. Notice that
the denominator for h is equal to zero only if z
1
= z
2
= r, but in this case γ
i2
can be chosen
as any real number. In general case, taking into account the proof of the theorem 1, it is not
difficult to see that h
> 0. Besides that the following inequality holds
h
< 1 − ln
2
β
2
1
/2β
0
− 1 +
β
2
1
/2β
0
− 1
2
− 1
/ln
2
β
0
/r
2
,
hence the real number γ
i2
exists and this one is determined as a solution of the equation
f
(γ
i2
) = h.
If the n
d
is odd, the polynomial ∆
∗
has, in accordance with (33), an additional linear binomial,
for which the propositions of the theorem are evident.
Plasma stabilization system design on the base of model predictive control 211
and consequently
γ
i1
=
−ln
(
β
0
/r
2
)
,
γ
i2
=
−
1
4
ln
w
r
2
β
0
ln
w
β
0
r
2
, where w
=
β
2
1
2β
0
− 1 +
β
2
1
2β
0
− 1
2
− 1.
(38)
Now let verify that the γ
i1
and γ
i2
, given by the formulas (38), are the real numbers.
Really, from the inequalities (36), (37) it follows that 0
< β
0
/r
2
≤ 1, therefore −ln
β
0
/r
2
≥ 0
and γ
i1
is a real number.
Let show that the expression under radical in the formula for γ
i2
is nonnegative. For the
first, consider the case when the trinomial ∆
i
(z) has two real positive roots z
1,2
. Then his
coefficients must satisfies to the condition β
2
1
− 4β
0
≥ 0, whence it follows that w ≥ 1 – is a
real number. As a result, taking into account (36), we obtain
ln
w
· r
2
/β
0
≥ 0. (39)
It could be noted that the inequalities (36) implies also the satisfaction of the inequality
β
2
1
− 2β
0
≤ r
2
+ β
0
/r
2
. Hence, we have
wβ
0
≤ r
2
, and − ln
wβ
0
/r
2
≥ 0. (40)
Thus from the inequalities (39) and (40) it is easy to see that the expression under radical in
the formula for γ
i2
is nonnegative and γ
i2
is a real number.
Consider now a case, when the trinomial ∆
i
(z) has a pair of complex-conjugate roots z
1,2
.
Then the following inequality is hold β
2
1
− 4β
0
< 0, and therefore w is a complex number,
which can be presented in the form w
= β
2
1
/2β
0
− 1 + i
1
−
β
2
1
/2β
0
− 1
2
. It is not difficult
to see that
|w| = 1, hence, the expression under the radical for γ
i2
has a form
γ
i2
=
−
1
4
ln
r
2
β
0
+ i · argw
ln
β
0
r
2
+ i · argw
=
1
4
ln
2
r
2
β
0
+ arg
2
w
,
i.e. it is nonnegative and γ
i2
is a real number.
If the n
d
is odd, the polynomial ∆
∗
has, in according to (33), an additional linear binomial, for
which the propositions of the theorem are evident.
Now consider more difficult second variant of the admissible set C
∆
. Let us prove the analo-
gous theorem, which allows to perform parametrization of this area.
Theorem 2. For any real vector γ
∈ E
n
d
the roots of the polynomial ∆
∗
(z, γ) (32),(33) are located
inside the area C
∆2
, and reversly, if the roots of the some polynomial ∆ (z) are located inside the area
C
∆2
and, in addition, all its real roots are positive, then it can be found such a vector γ ∈ E
n
d
that the
following identity holds ∆
(z) ≡ ∆
∗
(z, γ). Here
a
1
i
(γ, r) = −r
exp
−γ
2
i1
+ ν
i
+ exp
−γ
2
i1
− ν
i
,
a
0
i
(γ, r) = r
2
exp
−2γ
2
i1
, i
= 1, , d, a
d+1
(γ, r) = r · exp(−γ
2
d0
),
(41)
where ν
i
=
γ
4
i1
− f
(
γ
i2
)
ψ
2
r
· exp
−γ
2
i1
+ γ
4
i1
, i
= 1, 2, , d; γ =
{
γ
11
, γ
12
, γ
21
, γ
22
, , γ
d1
, γ
d2
, γ
d0
}.
The function f is such that f
(·) : ( −∞ , +∞) → (0, 1) and its inverse function exists in the whole
region of the definition; the function ψ
(ξ) is a real function from the variable ξ ∈ (0, r], which takes
the values in the interval
[0, π] and ψ(r) = 0.
Proof Similar to theorem 1, consider the properties of the quadratic trinomials in (32). Firstly,
let prove a direct proposition.
For any given pair of the real numbers γ
i1
, γ
i2
the roots of the trinomial ∆
∗
i
(z) in (32) is given
by the expression z
i
1,2
= r · exp(−γ
2
i1
± ν
i
). Here two different variants are possible. If ν
i
is a
real number, then the roots z
i
1,2
are also real. Besides that, taking into account the properties
of the function f , the following inequality holds γ
4
i1
− f (γ
i2
)
ψ
2
r
· exp(−γ
2
i1
)
+ γ
4
i1
≤ γ
4
i1
.
Hence the roots are positive and
|z
i
1,2
| ≤ r, that is z
i
1,2
∈ C
∆2
.
If ν
i
is a complex number, then z
i
1,2
is the pair of complex-conjugated roots and
|z
i
1,2
| = ρ = r · exp(−γ
2
i1
) ≤ r. Taking into account the properties of the function f , the
following inequality is valid
ϕ
=
f (γ
i2
)
ψ
2
r
· exp(−γ
2
i1
)
+ γ
4
i1
− γ
4
i1
≤
ψ
2
r
· exp(−γ
2
i1
)
= ψ (ρ). (42)
Since the arg z
i
1,2
= ±ϕ and, accordingly to (42), 0 ≤ ϕ ≤ ψ(ρ), then the roots z
i
1,2
are located
inside the area C
∆2
, so the direct proposition is proven.
Let consider the reverse proposition. The roots z
1,2
of some trinomial ∆
i
(z) = z
2
+ β
1
z +
β
0
are located inside the area C
∆2
in accordance with the reverse proposition if these roots
are positive real numbers. Notice that the coefficients of this trinomial must satisfy to the
inequalities (36),(37), because
|z
1,2
| ≤ r and the roots product z
1
z
2
is positive in any way.
Let find such numbers γ
i1
, γ
i2
that the identity ∆
∗
i
(z) ≡ ∆
i
(z) holds. By equating the corre-
spondent coefficients for the same degrees of z-variable, obtain
−r
exp
−γ
2
i1
+ ν
i
+ exp
−γ
2
i1
− ν
i
= β
i
, r
2
exp( −2γ
2
i1
) = β
0
,
hence
γ
i1
=
−0.5 · ln(β
0
/r
2
),
f
(γ
i2
) =
1
4
ψ
2
r
· exp(−γ
2
i1
)
+ γ
4
i1
ln
2
β
0
r
2
− ln
2
β
2
1
2β
0
− 1 +
β
2
1
2β
0
− 1
2
− 1
.
Let us show that the γ
i2
is a real number. For γ
i1
the proof is equivalent to the such one in the
first theorem.
It is evident that the equation with respect to γ
i2
has a solution, if the expression in the right
part of it takes the values inside the interval (0,1). Let denote this expression by h. Notice that
the denominator for h is equal to zero only if z
1
= z
2
= r, but in this case γ
i2
can be chosen
as any real number. In general case, taking into account the proof of the theorem 1, it is not
difficult to see that h
> 0. Besides that the following inequality holds
h
< 1 − ln
2
β
2
1
/2β
0
− 1 +
β
2
1
/2β
0
− 1
2
− 1
/ln
2
β
0
/r
2
,
hence the real number γ
i2
exists and this one is determined as a solution of the equation
f
(γ
i2
) = h.
If the n
d
is odd, the polynomial ∆
∗
has, in accordance with (33), an additional linear binomial,
for which the propositions of the theorem are evident.
Model Predictive Control212
Now let us show how introced areas C
∆1
and C
∆2
are related to the standart areas on the
complex plane, which are commonly used in the analysis and synthesis of the continuos time
systems.
Primarily, it may be noticed that the eigenvalues of the continues linear model and the discrete
linear model are connected by the following rule (Hendricks et al., 2008): if s is the eigenvalue
of the continuos time system matrix, then z
= e
sT
is the correspondent eigenvalue of the
discrete time system matrix, where T is the sampling period. Taking into account this relation,
let consider the examples of the mapping of some standart areas for continuous systems to the
areas for discrete systems.
Example 1 Let we have given area C
= {s = x ± yj ∈ C
1
: x ≤ −α}, depicted in Fig. 3. It is
evident that the points of the line x
= −α are mapped to the points of the circle |z| = e
−αT
.
The area C itself is mapped on the disc
|z| ≤ e
−αT
, as shown in Fig.3. This disc corresponds to
the area C
∆1
, which defines the degree of stability for discrete system.
Fig. 3. The correspondence of the areas for continuous and discrete system
Example 2 Consider the area
C
= { s = x ± yj ∈ C
1
: x ≤ −α, 0 ≤ y ≤ (−x − α)tgβ},
depicted in Fig. 4, where 0
≤ β <
π
2
and α > 0 is a given real numbers.
Let perform the mapping of the area C on the z-plane. It is evident that the vertex of the angle
(−α, 0) is mapped to the point with polar coordinates r = e
−αT
, ϕ = 0 on the plane z. Let now
map each segment from the set
L
γ
= { s = x ± yj ∈ C
1
: x = γ, γ ≤ −α, 0 ≤ y ≤ (−γ − α)tgβ}
to the z-plane. Each point s = γ ± yj of the segment L
γ
is mapped to the point z = e
sT
=
e
γT±jyT
on the plane z. Therefore, the points of the segment L
γ
are mapped to the arc of the
circle with radius e
γT
if the following condition holds −α − π/(Ttgβ) < γ ≤ −α, and to the
whole circle if γ
≤ −α − π/(Ttgβ). Therefore, the maximum radius of the circle, which is
fullfilled by the points of the segment, is equal to r
= e
−αT−π/tgβ
, corresponding with the
equality γ
0
= −α − π/(Ttgβ). Notice that the rays, which constitutes the angle, mapped to
the logarithmic spirals. Moreover, the bound of the area on the plane z is formed by the arcs
of these spirals in accordace with the x varying from
−α to γ
0
.
Fig. 4. The correspondence of the areas for continuous and discrete time systems
Let introduce the notation ρ
= e
xT
, and define the function ψ (ρ), which represents the con-
straints on the argument values while the radius ρ of the circle is fixed:
ψ
(ρ) =
(−lnρ − αT)tgβ, i f ρ ∈ [r
, r],
π, i f ρ
∈ [0, r
].
The result of the mapping is shown on the Fig. 4. It can be noted that the obtained area reflects
the desired degree of the discrete time system stability and oscillations.
Let us use the results of the theorem 2 in order to formulate the computational algoritm for the
optimization problem (27) solution on the admissible set Ω
H
taking into account the condition
C
∆
= C
∆2
. It is evident that the first case, where C
∆
= C
∆2
, is a particular case of the second
one.
Consider a real vector γ
∈ E
n
d
and form the polynomial ∆
∗
(z, γ) with the help of formulas
(32),(33),(41). Let require that the tuned parameters of the controller (24), defined by the vector
h
∈ E
r
, provides the identity
∆
(z, h) ≡ ∆
∗
(z, γ), (43)
where ∆
(z, h) is the characteristic polynomial of the closed-loop system with the degree n
d
.
By equating the correspondent coefficients for the same degrees of z-variable, we obtain the
following system of nonlinear equations
L
(h) = χ(γ) (44)
with respect to unknown components of the parameters vector h. The last system has a solu-
tion for any given γ
∈ E
n
d
due to the controller (24) has a full structure. Let consider that, in
general case, the system (44) has a nonunique solution. Then the vector h can be presented as
a set of two vectors h
= {
¯
h, h
c
}, where h
c
∈ E
n
c
is a free component,
¯
h is the vector that is
uniquely defined by the solution of the system (44) for the given vector h
c
.
Let introduce the following notation for the general solution of the system (44)
h
= h
∗
= {
¯
h
∗
(h
c
, γ), h
c
} = h
∗
(γ, h
c
) = h
∗
(),
where
= { γ, h
c
} is a vector of the independent parameters with the dimension λ given by
λ
= dim = dim γ + dim h
c
= n
d
+ n
c
.