Model Predictive Control Part 14 pot
Bạn đang xem bản rút gọn của tài liệu. Xem và tải ngay bản đầy đủ của tài liệu tại đây (838.12 KB, 20 trang )
MPC in urban trafc management 253
sought to solve online the MPC problem. The classical scheme for adaptive road traffic
management structure is usually based on control center which processes and computes all
signal control for the network. Another method for the control system architecture is the
decentralized and distributed control scheme. This approach has numerous economical and
technological advantages. Distributed traffic control is developed using iterative solution.
The so-called Jacobi iteration algorithm is an efficient method to solve constrained and
nonlinear programming problem which the original problem can be transformed for. An
additional feature of the developed strategy is the ability to manage priority. If a preferred
vehicle arrives to any junction of the network it will be automatically indicated. Its stage will
be handled with priority getting maximum green time as possible in every cycle until the
vehicle will not leave the intersection. It means practically that the cost function is
dynamically modified by the system weights depending of presence of any preferred
vehicles. Finally we would like to introduce the robust MPC problem in traffic management
as our future work. The robustness of the traffic management means that even with the
presence of some disturbances the system is able to find optimal control solution. We
discuss the modification of the traffic model introduced in third section since the chosen
method requires a special model structure.
2. Brief historical summary of adaptive road traffic control
In case the distance is relatively short between several intersections with traffic lights it is
advisable to co-ordinate the operation of the intersection controller devices. The
coordination may include public transport devices and pedestrian traffic besides vehicles.
Where several intersections are near to each other in smaller or bigger networks, primarily
in cities, the coordination is especially emphasized.
In the 1970's a new control strategy appears in the road traffic management. Beside the
already extant fixed-time and traffic-actuated strategies the traffic-adaptive control is
invented. A traffic control system that continuously optimizes the signal plan according to
the actual traffic load is called an adaptive traffic control system. The essence of the
functioning is that the changes to the active signal plan parameters are automatically
implemented in response to the current traffic demand as measured by a vehicle detection
system. Such system can be used as local or network-wide control.
The appearance of the adaptivity induces new developments of traffic control methods. The
first adaptive systems like SCOOT (Hunt et al., 1982) or SCATS (Lowrie, 1982) are based on
heuristic optimization algorithms. In the 1980's new optimization methods are introduced
based on rolling horizon optimization using dynamic programming. Some examples are
OPAC (Gartner, 1983), PRODYN (Farges et al. 1983), and RHODES (Sen & Head, 1997).
In the middle of the 1990's the first control method is introduced which adopts results of the
modern control theory. The TUC system (Diakaki et al., 1999) applies a multivariable
regulator approach to calculate in real time the network splits, while cycle time and offsets
are calculated by other parallel algorithms. The basic methodology employed for split
control by TUC is the formulation of the urban traffic control problem as a linear-quadratic
(LQ) optimal control problem. The advantage of LQ control is the simplicity of the required
real-time calculations which is an important aspect in network-wide signal control.
However the algorithm has a main disadvantage. LQ control is not able to manage
constraints on the control input (its importance is discussed in the next section). Therefore a
posteriori application is needed to force the constraints which may lead to suboptimal
solution.
In the early 2000's the first results are published in the subject of MPC based traffic control.
However these publications (e.g. Bellemans et al., 2002; Hegyi et al., 2003) are related to
ramp metering and variable speed limit control of the freeway traffic management. MPC
based urban traffic control approach is published by Tettamanti et al. (2008). The paper
consists theory, realization and a real-word example. The main result is the possibility to
overcome the disadvantage of the LQ problem mentioned above as the MPC method can
take the constraints into consideration. These results constitute the basis of the chapter. The
paper of Aboudolas et al. (2009) is published investigating large-scale traffic control problem
and introducing the open-loop quadratic-programming control (QPC) as a possible method
for optimal traffic management. The paper concludes that for the application of the QPC
methodology in real time, the corresponding algorithms may be embedded in a rolling-
horizon (model-predictive) scheme which constitutes the part of future works.
In 2010 as a development result of Tettamanti et al. (2008) the paper of Tettamanti & Varga
(2010) is published which introduces a distributed realization of an MPC based traffic
control system. The publication's results will be also enlightened in detail in the chapter.
3. Urban traffic modeling
Modeling and control are coherent notions in control theory as the model highly determines
the applicable methods for control. In the previous chapter various control approaches were
presented. All of them use an appropriate traffic modeling technique for functioning.
Apparently, the modern control theory based traffic management strategies apply the state
space approach. The state space modeling is derived from the so called Store-and-forward
model (Gazis & Potts, 1963) which introduces a model simplification that enables the
mathematical description of the traffic flow process. This modeling technique opens the way
to the application of a number of highly efficient optimization methods such as LQ control,
MPC, or robust LMI based control. Before to begin to investigate the MPC based traffic
control the properties of the model have to be discussed in detail.
3.1 From Store-and-forward traffic modeling to state space representation
The following derivation of the state space model reflects the results of the paper of Diakaki
et al. (1999).
M
N
q
z
h
z
s
z
r
z
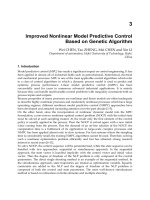
Fig. 1. The Store-and-forward traffic model
The two basic parts of an urban road traffic network are intersection and link. The
combination of these elements constitutes the traffic network with link
Z
z
and junction
Model Predictive Control254
Jj
which are defined geometrically exactly. Each signalized junction
j
has its own sets
of incoming
j
I and outgoing
j
O links. Figure 1. shows the coherence (link
z
) of two
neighboring intersections (
M
, N ) in the transportation network where
M
Oz and
N
Iz .
The dynamic of link
z
is described by the conservation equation:
kskrkhkqTkxkx
zzzzzz
=1
(1)
where
kx
z
measures the number of vehicles within link
z
, practically the length of queue,
at time kT .
kq
z
and
kh
z
are the inflow and outflow,
kr
z
and
ks
z
are the demand
and the exit flow during the sample period
TkkT 1, .
T
is the control interval and
0,1 =k
is the discrete time index. For simplicity we assume henceforth that the cycle times
are equal for each junction
Jj , namely
cjc
TT =
,
. Moreover T is also equal to
c
T .
kr
z
and
ks
z
represent typically the fluctuation between a parking lot and link
z
or the effects
of any non-controlled intersection between
M
and N . These disturbing flows can be
considered as known perturbations if they can be well measured or estimated. In case of
unknown disturbances robust control system is needed.
Equation (1) is linear scalar equation for the portrayal of vehicles movement of a given link.
But if we wish to define a whole traffic network each link has to be described by its
conservation equation and what is more the equations needs to be interconnected. At this
point we can change for state space representation which means the appearance of the state
and control input vectors together with the coefficient system matrices. The general discrete
LTI state space representation is the following:
kEdkBukAxkx =1
kCxky = (2)
Using Equation (2), it is possible to describe the dynamics of an arbitrary urban traffic
network (see Fig. 2 as an example).
M
N
q
z
h
z
s
z
r
z
p
z
Fig. 2. Dynamics in the urban traffic network
The physical meaning of matrices and vectors is elementary to understand the model. The
state equation form can be achieved using all conservation equations, arranging them in one
linear matrix equality. In our case the state matrix
A
is practically considered as an identity
matrix. The elements of the state vector
)(
kx
represent the number of vehicles of each
controlled link. The second term of the state equation is the product of input matrix
B
and
control input
u . Vector u contains the green times of all stages. Their numerical values are
the results of a corresponding controller at each cycle. Naturally the number of states is
equal to the number of controlled links in the network. The product
kBu
is arising from
the part
khkqT
zz
of Equation (1) which means the difference of the inflow and the
outflow of a link during the control interval.
kq
z
and
kh
z
are directly related to control
input (green time), saturation flow (
S ) and turning rate ( t ) in a signalized network. To
understand the construction of
B
the parameters S and
t
have to be discussed. Saturation
flow represents the outflow capacity of link
Z
z
during its green time. A standard value
for saturation flow is
sec/0.5 vehS
which is considered constant in practice. Turning rate
represents the distribution of turnings of vehicles from link
j
Oz
to links
N
Iw . These
parameters are defined by the geometry and the rights of way in the traffic network and
assumed to be known and constant or time varying. Then matrix
ij
bB
can be constructed
by the appropriate allocation of the combinations of saturation flow and turning rates. The
diagonal values of
B
are negative
z
S as the product
kuS
zz
represents the outflow from
link
z
. At the same time the inflow to the link
z
has to be also characterized. Therefore the
products
zwz
tS
,
are placed in matrix
B
such that
zwzij
tSb
,
when
j
i
. The parameters
zw
t
,
(
M
Iw ) are the turning rates towards link
z
from the links that enter junction
M
.
Hence the inflow is resulted from the appropriate matrix-vector multiplication for all
z
.
In state space representation the third term
kEd
of Equation (2) represents an additive
disturbance where
I
E
= .
kd is composed of two type of data. On the one hand it is
coming from the part
kskrT
zz
of Equation (1) where
kr
z
and
ks
z
are considered as
measured disturbances. They reflect the difference of the demand and the exit flows of a link
during the control interval. On the other hand there is demand
kp
z
at the boundary of the
traffic network (Figure 2.) which also has to be taken into consideration in the model. The
traffic
kp
z
intending to enter is a measurable value. Therefore it is simply added to the
appropriate row of
kd .
To end the state space description of the urban traffic the measurement equation has to be
mentioned. As each output inside of the network is a measured state (number of vehicles of
the link
Z
z
) the output equation is simplified to
kxky = with IC = . Note that as the
exit links of the network are not controlled they do not have to be confused with the
outputs
ky .
Finally, as three of the system matrices are identity matrix (discussed above) the general
discrete LTI state space representation for urban traffic simplifies to the following form:
kdkBukxkx
=1
kxky = (3)
MPC in urban trafc management 255
Jj
which are defined geometrically exactly. Each signalized junction
j
has its own sets
of incoming
j
I and outgoing
j
O links. Figure 1. shows the coherence (link
z
) of two
neighboring intersections (
M
, N ) in the transportation network where
M
Oz and
N
Iz .
The dynamic of link
z
is described by the conservation equation:
kskrkhkqTkxkx
zzzzzz
=1
(1)
where
kx
z
measures the number of vehicles within link
z
, practically the length of queue,
at time kT .
kq
z
and
kh
z
are the inflow and outflow,
kr
z
and
ks
z
are the demand
and the exit flow during the sample period
TkkT 1,
.
T
is the control interval and
0,1 =k
is the discrete time index. For simplicity we assume henceforth that the cycle times
are equal for each junction
Jj
, namely
cjc
TT =
,
. Moreover T is also equal to
c
T .
kr
z
and
ks
z
represent typically the fluctuation between a parking lot and link
z
or the effects
of any non-controlled intersection between
M
and N . These disturbing flows can be
considered as known perturbations if they can be well measured or estimated. In case of
unknown disturbances robust control system is needed.
Equation (1) is linear scalar equation for the portrayal of vehicles movement of a given link.
But if we wish to define a whole traffic network each link has to be described by its
conservation equation and what is more the equations needs to be interconnected. At this
point we can change for state space representation which means the appearance of the state
and control input vectors together with the coefficient system matrices. The general discrete
LTI state space representation is the following:
kEdkBukAxkx
=1
kCxky = (2)
Using Equation (2), it is possible to describe the dynamics of an arbitrary urban traffic
network (see Fig. 2 as an example).
M
N
q
z
h
z
s
z
r
z
p
z
Fig. 2. Dynamics in the urban traffic network
The physical meaning of matrices and vectors is elementary to understand the model. The
state equation form can be achieved using all conservation equations, arranging them in one
linear matrix equality. In our case the state matrix
A
is practically considered as an identity
matrix. The elements of the state vector
)(
kx
represent the number of vehicles of each
controlled link. The second term of the state equation is the product of input matrix
B
and
control input
u . Vector u contains the green times of all stages. Their numerical values are
the results of a corresponding controller at each cycle. Naturally the number of states is
equal to the number of controlled links in the network. The product
kBu
is arising from
the part
khkqT
zz
of Equation (1) which means the difference of the inflow and the
outflow of a link during the control interval.
kq
z
and
kh
z
are directly related to control
input (green time), saturation flow (
S ) and turning rate ( t ) in a signalized network. To
understand the construction of
B
the parameters S and
t
have to be discussed. Saturation
flow represents the outflow capacity of link
Z
z
during its green time. A standard value
for saturation flow is
sec/0.5 vehS which is considered constant in practice. Turning rate
represents the distribution of turnings of vehicles from link
j
Oz to links
N
Iw . These
parameters are defined by the geometry and the rights of way in the traffic network and
assumed to be known and constant or time varying. Then matrix
ij
bB can be constructed
by the appropriate allocation of the combinations of saturation flow and turning rates. The
diagonal values of
B
are negative
z
S as the product
kuS
zz
represents the outflow from
link
z
. At the same time the inflow to the link
z
has to be also characterized. Therefore the
products
zwz
tS
,
are placed in matrix
B
such that
zwzij
tSb
,
when
j
i
. The parameters
zw
t
,
(
M
Iw ) are the turning rates towards link
z
from the links that enter junction
M
.
Hence the inflow is resulted from the appropriate matrix-vector multiplication for all
z
.
In state space representation the third term
kEd
of Equation (2) represents an additive
disturbance where
I
E
= .
kd is composed of two type of data. On the one hand it is
coming from the part
kskrT
zz
of Equation (1) where
kr
z
and
ks
z
are considered as
measured disturbances. They reflect the difference of the demand and the exit flows of a link
during the control interval. On the other hand there is demand
kp
z
at the boundary of the
traffic network (Figure 2.) which also has to be taken into consideration in the model. The
traffic
kp
z
intending to enter is a measurable value. Therefore it is simply added to the
appropriate row of
kd .
To end the state space description of the urban traffic the measurement equation has to be
mentioned. As each output inside of the network is a measured state (number of vehicles of
the link
Z
z
) the output equation is simplified to
kxky = with IC = . Note that as the
exit links of the network are not controlled they do not have to be confused with the
outputs
ky .
Finally, as three of the system matrices are identity matrix (discussed above) the general
discrete LTI state space representation for urban traffic simplifies to the following form:
kdkBukxkx
=1
kxky = (3)
Model Predictive Control256
3.2 Constraints of urban traffic control
As store-and-forward modeling technique tries to express the real dynamics and states of
the urban traffic there are several constraints which have to be taken into account. The most
essential constraints of the urban network are determined by the geometry. It is evident that
the maximum number of vehicles is defined by the length of link between two junctions.
Naturally the vehicles are considered as passenger car unit (PCU) resulting from
appropriate transformation (Webster & Cobbe, 1966). Thus the states are subject to the
constraints:
maxzz
xkx
,
0 (4)
If we consider a network the use of the states constraints can contribute to avoid the
oversaturation in the controlled traffic area. In a control scheme beside the state constraints
one can define output limitations too. However in our case the states constraints are
identically to the output constraints as
IC = .
The control input is the next variable restricted by some constraints. The first constraint on
u is the interval of seconds of green time:
maxzzminz
ukuu
,,
(5)
Depending on the system setting
minz
u
,
(for lack of vehicles on link
z
) can be zero. It means
permanent red signal for the stage in the next control interval. The second control input
constraint is represented by the linear combination of green times at junction
Jj . The sum
of the green times has to be lower as
maxj
T
,
:
maxjz
Oj
z
Tku
,
1=
,
Jj ,,2,1
, (6)
where
j
O is the number of stages at junction
j
,
jmaxj
LTT =
,
(
j
L is the fixed lost time
resulted from the geometry of junction
j
), and J is the number of controlled intersections.
4. Simulation environment
In the previous sections traffic modeling was introduced which can be used in control
design. Moreover the simulation environment has to be discussed similarly as all the
methods presented in this chapter were simulated and tested. For simulation we used traffic
simulator (VISSIM, 2010), numerical computing software (MATLAB, 2010) and C++
programming language.
VISSIM is a microscopic traffic simulation software for analyzing traffic operations. It is able
to simulate network consisting of several intersections and allow the use of external control
algorithm in the control processes. These properties make it suitable to use this software by
reason of the several junctions and the control algorithms written in MATLAB. VISSIM uses
a so-called psycho-physical driver behavior model based on the car-following model of
(Wiedemann, 1974). The model describes all the cars found in the system. The vehicles are
defined by both physical and psychical parameters (origin, destination, speed, driver
behavior, vehicle type, etc.). The VISSIM simulation is based on an iteration process of
acceleration and deceleration.
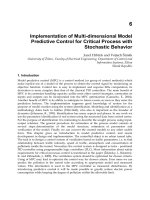
The communication does not work directly between MATLAB and VISSIM as the
simulation can only be accessed via Component Object Model (COM) interface (Roca, 2005).
To control the communication a C++ application has to be created. The created C++
program manages the simulation process and controls the data transfer between the
software (Figure 3.).
MATLAB
CONTROL
LOGIC
VISSIM
TRAFFIC
NETWORK
C++
PROGRAM
SIMULATION
AND
COMMUNICATION
CONTROL
COM INTERFACE
Fig. 3. The simulation process of the system model
5. MPC based urban traffic management
The aim of our research was to elaborate a control process related to network consisting of
several junctions which perform the control of all the traffic lights in its sphere of action in a
coordinated way depending on the traffic. The controller must be able to dynamically make
the traffic signal set of the intersections. From the point of view of realization, this means
that before every period a new traffic sign must be generated regarding all the traffic lights,
in harmony with the present traffic. To solve the above, MPC technology was chosen since it
is able to take all the constraints into consideration in course of the control input setting. To
show the efficiency of MPC the control design was tested simulating a real-word traffic
network.
5.1 The MPC cost function
The control objective is the minimization and balancing of the numbers of vehicles within
the streets of the controlled network. This control objective is approached through the
appropriate manipulation of the green splits at urban signalized junctions, assuming given
cycle times and offsets. By employing the predictive control model, the dynamic
determination (per cycle) of the traffic light’s period is possible either with the consideration
of the natural constraints existing in the system introduced in Section 3.2.
The state space equation for MPC design can be given as follows:
)(
~
)()1(
~
|1
|1
|
0
00
2
|
|2
|1
kg
B
kckx
kNku
kku
kku
BBB
BB
B
kNdkx
kdkx
kdkx
kNkx
kkx
kkx
(7)
where
x
, d ,
B
and u are elements of Equation (3) already discussed. x
~
is a hyper vector
of the state vectors, representing the number of vehicles standing at each controlled link of
MPC in urban trafc management 257
3.2 Constraints of urban traffic control
As store-and-forward modeling technique tries to express the real dynamics and states of
the urban traffic there are several constraints which have to be taken into account. The most
essential constraints of the urban network are determined by the geometry. It is evident that
the maximum number of vehicles is defined by the length of link between two junctions.
Naturally the vehicles are considered as passenger car unit (PCU) resulting from
appropriate transformation (Webster & Cobbe, 1966). Thus the states are subject to the
constraints:
maxzz
xkx
,
0
(4)
If we consider a network the use of the states constraints can contribute to avoid the
oversaturation in the controlled traffic area. In a control scheme beside the state constraints
one can define output limitations too. However in our case the states constraints are
identically to the output constraints as
IC = .
The control input is the next variable restricted by some constraints. The first constraint on
u is the interval of seconds of green time:
maxzzminz
ukuu
,,
(5)
Depending on the system setting
minz
u
,
(for lack of vehicles on link
z
) can be zero. It means
permanent red signal for the stage in the next control interval. The second control input
constraint is represented by the linear combination of green times at junction
Jj . The sum
of the green times has to be lower as
maxj
T
,
:
maxjz
Oj
z
Tku
,
1=
,
Jj ,,2,1
, (6)
where
j
O is the number of stages at junction
j
,
jmaxj
LTT
=
,
(
j
L is the fixed lost time
resulted from the geometry of junction
j
), and J is the number of controlled intersections.
4. Simulation environment
In the previous sections traffic modeling was introduced which can be used in control
design. Moreover the simulation environment has to be discussed similarly as all the
methods presented in this chapter were simulated and tested. For simulation we used traffic
simulator (VISSIM, 2010), numerical computing software (MATLAB, 2010) and C++
programming language.
VISSIM is a microscopic traffic simulation software for analyzing traffic operations. It is able
to simulate network consisting of several intersections and allow the use of external control
algorithm in the control processes. These properties make it suitable to use this software by
reason of the several junctions and the control algorithms written in MATLAB. VISSIM uses
a so-called psycho-physical driver behavior model based on the car-following model of
(Wiedemann, 1974). The model describes all the cars found in the system. The vehicles are
defined by both physical and psychical parameters (origin, destination, speed, driver
behavior, vehicle type, etc.). The VISSIM simulation is based on an iteration process of
acceleration and deceleration.
The communication does not work directly between MATLAB and VISSIM as the
simulation can only be accessed via Component Object Model (COM) interface (Roca, 2005).
To control the communication a C++ application has to be created. The created C++
program manages the simulation process and controls the data transfer between the
software (Figure 3.).
MATLAB
CONTROL
LOGIC
VISSIM
TRAFFIC
NETWORK
C++
PROGRAM
SIMULATION
AND
COMMUNICATION
CONTROL
COM INTERFACE
Fig. 3. The simulation process of the system model
5. MPC based urban traffic management
The aim of our research was to elaborate a control process related to network consisting of
several junctions which perform the control of all the traffic lights in its sphere of action in a
coordinated way depending on the traffic. The controller must be able to dynamically make
the traffic signal set of the intersections. From the point of view of realization, this means
that before every period a new traffic sign must be generated regarding all the traffic lights,
in harmony with the present traffic. To solve the above, MPC technology was chosen since it
is able to take all the constraints into consideration in course of the control input setting. To
show the efficiency of MPC the control design was tested simulating a real-word traffic
network.
5.1 The MPC cost function
The control objective is the minimization and balancing of the numbers of vehicles within
the streets of the controlled network. This control objective is approached through the
appropriate manipulation of the green splits at urban signalized junctions, assuming given
cycle times and offsets. By employing the predictive control model, the dynamic
determination (per cycle) of the traffic light’s period is possible either with the consideration
of the natural constraints existing in the system introduced in Section 3.2.
The state space equation for MPC design can be given as follows:
)(
~
)()1(
~
|1
|1
|
0
00
2
|
|2
|1
kg
B
kckx
kNku
kku
kku
BBB
BB
B
kNdkx
kdkx
kdkx
kNkx
kkx
kkx
(7)
where
x
, d ,
B
and u are elements of Equation (3) already discussed. x
~
is a hyper vector
of the state vectors, representing the number of vehicles standing at each controlled link of
Model Predictive Control258
the intersections.
c is a hyper vector combination of the previous state vector and d . The
disturbance
d is considered measured and constant during the horizons of kth step. Hence
it is multiplied by the value of the current horizon.
B
~
is a lower triangular hyper matrix
including the matrix
B
.
g
is a hyper vector of the control input vectors (green times),
2,1k a is the discrete time index, and N is the length of the MPC horizon.
The MPC algorithm needs the current values of the states at each control interval which
means the exact knowledge of the numbers of vehicle. However the states can not be
directly measured only estimated using appropriate measurement system (e.g. loop
detectors) and estimation algorithm. A possible realization for state estimation was
published in paper of Vigos et al. (2007) which is based on the well-known Kalman Filter
algorithm (Welch & Bishop, 1995). The estimation error is neglected in the paper.
The elements of
B
are the combinations of turning rates and saturation flow as discussed in
Section 3.1. Saturation flow is not measurable hence a standard value is determined
(
sec/0.5 vehS ). Usually the values of turning rates are also considered constant.
Nevertheless, in practice the turnings vary around the nominal rates. Thus a continuous
estimation may be applied to ameliorate the MPC algorithm. A possible way to estimate
turning rates is to use a finite back stepped state observer, e.g. Moving Horizon Estimation
(MHE) method (Kulcsár et al., 2005).
Several choices of the objective function in the optimization literature have been reported. In
this chapter we consider the following quadratic cost function characterized by the
weighted system states and control inputs:
min
~~
2
1
kgRkgkxQkxkJ
TT
(8)
where
0Q and 0R are scalar weighting matrices. Q and
R
have appropriately chosen
tuning parameters in their diagonals. The weightings reflect that the control input variation
is lightly punished compared to the state variation. The selection of the appropriate
weightings is important, because this could influence (especially the end-point weight) the
stability of the closed loop (Kwon & Pearson, 1978). To solve this minimization problem
several mathematical software can be applied which provide built-in function for quadratic
constrained optimization. The solution of optimization problem (8) leads to the
minimization of the vehicle queues waiting for crossing intersections. The control input
green time is defined corresponding to the states of intersection branches representing a
fully adaptive traffic management.
Different stability proofs exist for receding horizon control algorithms. Maciejowski (2002),
Rawlings & Muske (1993) or Mayne et al. (2000) offer different methodological approaches.
However the urban traffic is a special case. It is ensured that the system will not turn
instable because of the hard physical constraints coming from the network geometry.
Accordingly, there is a natural saturation in the system. The states can never grow
boundlessly. The instability can appear only if there is an oversaturation in the network. To
solve this problem we intend to apply the results of the invariant set theory (Blanchini &
Miani, 2007) in the future. It is also has to be noted that if we choose a traffic area to control
we do not deal with the traffic outside of the boundary of the network. Obviously the sphere
of control action is also an important question in traffic management.
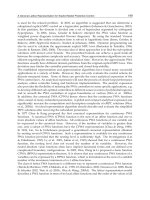
5.2 Test network for simulation
To test MPC technology in urban traffic management we choose a real-world test area
situated in the 10
th
district of Budapest. The test network includes seven neighboring
intersections (Figure 4.).
1 2
4
3
5
7
6
Fig. 4. Schematic representation of the test network consisting of seven junctions
The dimension of the system is 36 which means that we intend to control 36 links. This area
is suitable for testing our new control system since the included road stretches have a heavy
traffic volume in rush hours. The current traffic management system is offline. The seven
junctions are controlled individually. Three of them use fix time signal plan. In the other
four intersections detectors help the controllers. They can slightly modify their fix programs.
The current control is effective but only in case of normal traffic flow. If the volume of
vehicles increases extremely, the system cannot manage the situation and traffic becomes
congested before the stop lines. The biggest problem is that the controllers work locally and
independently. Our new control design, however, takes the seven junctions into
consideration as a real network.
As the MPC cost function (8) represents a quadratic optimization problem the control input
was calculated using the built-in quadprog function of MATLAB.
5.3 Simulation results
To prove the applicability of the MPC based control design it was compared with the
current control system of the test network, which is a partly adaptive control strategy.
The same input traffic volumes were set for both simulations. We used volume data for
which the traffic lights were originally designed. The simulation provided similar results for
both strategies as we expected. This means the current system is correctly designed, and
manages non-extreme traffic flow with good results.
To test the effectiveness of the two systems in case of heavier traffic we generated more
intensive traffic flow during the simulation. The original input volumes were increased by
10% in the network. This simulation showed different results to the previous case. The
current system could manage the traffic less efficiently compared with the MPC based
control system. The simulation time was 1 hour long. The results are presented in Table 1.
All important traffic parameters changed in a right way. The new system can provide a very
effective control in the test network.
MPC in urban trafc management 259
the intersections.
c is a hyper vector combination of the previous state vector and d . The
disturbance
d is considered measured and constant during the horizons of kth step. Hence
it is multiplied by the value of the current horizon.
B
~
is a lower triangular hyper matrix
including the matrix
B
.
g
is a hyper vector of the control input vectors (green times),
2,1k a is the discrete time index, and N is the length of the MPC horizon.
The MPC algorithm needs the current values of the states at each control interval which
means the exact knowledge of the numbers of vehicle. However the states can not be
directly measured only estimated using appropriate measurement system (e.g. loop
detectors) and estimation algorithm. A possible realization for state estimation was
published in paper of Vigos et al. (2007) which is based on the well-known Kalman Filter
algorithm (Welch & Bishop, 1995). The estimation error is neglected in the paper.
The elements of
B
are the combinations of turning rates and saturation flow as discussed in
Section 3.1. Saturation flow is not measurable hence a standard value is determined
(
sec/0.5 vehS ). Usually the values of turning rates are also considered constant.
Nevertheless, in practice the turnings vary around the nominal rates. Thus a continuous
estimation may be applied to ameliorate the MPC algorithm. A possible way to estimate
turning rates is to use a finite back stepped state observer, e.g. Moving Horizon Estimation
(MHE) method (Kulcsár et al., 2005).
Several choices of the objective function in the optimization literature have been reported. In
this chapter we consider the following quadratic cost function characterized by the
weighted system states and control inputs:
min
~~
2
1
kgRkgkxQkxkJ
TT
(8)
where
0Q and 0R are scalar weighting matrices. Q and
R
have appropriately chosen
tuning parameters in their diagonals. The weightings reflect that the control input variation
is lightly punished compared to the state variation. The selection of the appropriate
weightings is important, because this could influence (especially the end-point weight) the
stability of the closed loop (Kwon & Pearson, 1978). To solve this minimization problem
several mathematical software can be applied which provide built-in function for quadratic
constrained optimization. The solution of optimization problem (8) leads to the
minimization of the vehicle queues waiting for crossing intersections. The control input
green time is defined corresponding to the states of intersection branches representing a
fully adaptive traffic management.
Different stability proofs exist for receding horizon control algorithms. Maciejowski (2002),
Rawlings & Muske (1993) or Mayne et al. (2000) offer different methodological approaches.
However the urban traffic is a special case. It is ensured that the system will not turn
instable because of the hard physical constraints coming from the network geometry.
Accordingly, there is a natural saturation in the system. The states can never grow
boundlessly. The instability can appear only if there is an oversaturation in the network. To
solve this problem we intend to apply the results of the invariant set theory (Blanchini &
Miani, 2007) in the future. It is also has to be noted that if we choose a traffic area to control
we do not deal with the traffic outside of the boundary of the network. Obviously the sphere
of control action is also an important question in traffic management.
5.2 Test network for simulation
To test MPC technology in urban traffic management we choose a real-world test area
situated in the 10
th
district of Budapest. The test network includes seven neighboring
intersections (Figure 4.).
1 2
4
3
5
7
6
Fig. 4. Schematic representation of the test network consisting of seven junctions
The dimension of the system is 36 which means that we intend to control 36 links. This area
is suitable for testing our new control system since the included road stretches have a heavy
traffic volume in rush hours. The current traffic management system is offline. The seven
junctions are controlled individually. Three of them use fix time signal plan. In the other
four intersections detectors help the controllers. They can slightly modify their fix programs.
The current control is effective but only in case of normal traffic flow. If the volume of
vehicles increases extremely, the system cannot manage the situation and traffic becomes
congested before the stop lines. The biggest problem is that the controllers work locally and
independently. Our new control design, however, takes the seven junctions into
consideration as a real network.
As the MPC cost function (8) represents a quadratic optimization problem the control input
was calculated using the built-in quadprog function of MATLAB.
5.3 Simulation results
To prove the applicability of the MPC based control design it was compared with the
current control system of the test network, which is a partly adaptive control strategy.
The same input traffic volumes were set for both simulations. We used volume data for
which the traffic lights were originally designed. The simulation provided similar results for
both strategies as we expected. This means the current system is correctly designed, and
manages non-extreme traffic flow with good results.
To test the effectiveness of the two systems in case of heavier traffic we generated more
intensive traffic flow during the simulation. The original input volumes were increased by
10% in the network. This simulation showed different results to the previous case. The
current system could manage the traffic less efficiently compared with the MPC based
control system. The simulation time was 1 hour long. The results are presented in Table 1.
All important traffic parameters changed in a right way. The new system can provide a very
effective control in the test network.
Model Predictive Control260
Parameter
O
LD
STRATEGY
MPC based
strategy
Variation
Total travel time per vehicle [sec] 114 96 ↓ 16%
Average speed [km/h] 20.6 24.9 ↑ 21%
Average delay time per vehicle [sec] 68
56 ↓ 18%
Average number of stops per vehicles 3.8 3.1 ↓ 18%
Table 1. Average simulation results of the test network
At the same time these simulations were run in a reduced environment. We diminished the
number of junctions in the test network from seven to four. Namely the traffic lights at
junctions 4., 5., 6. (see Figure 4.) work totally offline. The capacities of these locations
increased apparently. So only the junctions 1., 2., 3., and 4. were kept in order to focus on the
comparison of the two adaptive strategies.
Parameter Old strategy
MPC based
strategy
Variation
Total travel time per vehicle [sec] 105 96 ↓ 9%
Average speed [km/h] 20.5 23.5 ↑ 15%
Average delay time per vehicle [sec] 64 52 ↓ 19%
Average number of stops per vehicles 1.2 1.2 0%
Table 2. Average simulation results of the test network with design input volumes
Parameter Old strategy
MPC based
strategy
Variation
Total travel time per vehicle [sec] 110 96 ↓ 13%
Average speed [km/h] 18.4 23.6 ↑ 28%
Average delay time per vehicle [sec] 71 52 ↓ 27%
Average number of stops per vehicles 1.5 1.2 ↓ 20%
Table 3. Average simulation results of the test network with 10% augmentation of the design
input volumes
Alike above, the behavior of the reduced network was analyzed with normal and heavier
input traffic volumes. The results ameliorated in both cases (see Table 2. and 3.). The
simulation time was 2 hours long.
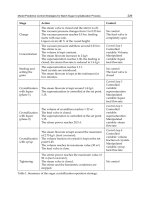
The aim of the MPC based control is the minimization of the number of vehicles waiting at
the stop line. The current system cannot adapt to the increased volume. The average queue
length grew strongly during the simulations. However, the MPC strategy is able to manage
heavier traffic situations real-time. Figure 5. represents the effectiveness of our system. It
shows the variation of average queue lengths in the network.
Fig. 5. The variation of average queue lengths in the two different control cases
6. Distributed traffic management system based on MPC
The classical scheme for adaptive road traffic management structure is based on control
center which processes and computes all signal control for the network. Another method for
the control system architecture is the decentralized and distributed control scheme. This
approach has numerous economical and technological advantages.
In this section we present a distributed control system scheme for urban road traffic
management. The control algorithm is based on MPC involving Jacobi iteration algorithm to
solve constrained and nonlinear programming problem. The distributed control design was
also simulated and tested.
6.1 The MPC cost function
We refer to the results of Section 5.1. Substituting
kx
~
and
kg in Equation (8) one arrives
to:
gggcqcgBqcgrIBBqgkJ
TTTTTT
2
1
2
1
~~~
2
1
(9)
where
q and
r
are constants coming from the diagonal of the scalar matrices
Q
and
R
.
As
is a constant term, finally one has the objective function to minimize:
min
2
1
kgkkgkgkJ
TT
(10)
where is constant matrix as it contains the combination of constant turning rates,
saturation rates and fixed tuning parameters. At the same time
contains varying values
coming from the current dynamics of the traffic area.
6.2 Multivariable nonlinear programming to solve MPC problem
The solution of the MPC cost function (10) represents a multivariable nonlinear problem
subject to linear constraints. It formulates a standard quadratic optimization problem
(Bertsekas & Tsitsiklis, 1997):
MPC in urban trafc management 261
Parameter
O
LD
STRATEGY
MPC based
strategy
Variation
Total travel time per vehicle [sec] 114 96 ↓ 16%
Average speed [km/h] 20.6 24.9 ↑ 21%
Average delay time per vehicle [sec] 68
56 ↓ 18%
Average number of stops per vehicles 3.8 3.1 ↓ 18%
Table 1. Average simulation results of the test network
At the same time these simulations were run in a reduced environment. We diminished the
number of junctions in the test network from seven to four. Namely the traffic lights at
junctions 4., 5., 6. (see Figure 4.) work totally offline. The capacities of these locations
increased apparently. So only the junctions 1., 2., 3., and 4. were kept in order to focus on the
comparison of the two adaptive strategies.
Parameter Old strategy
MPC based
strategy
Variation
Total travel time per vehicle [sec] 105 96 ↓ 9%
Average speed [km/h] 20.5 23.5 ↑ 15%
Average delay time per vehicle [sec] 64 52 ↓ 19%
Average number of stops per vehicles 1.2 1.2 0%
Table 2. Average simulation results of the test network with design input volumes
Parameter Old strategy
MPC based
strategy
Variation
Total travel time per vehicle [sec] 110 96 ↓ 13%
Average speed [km/h] 18.4 23.6 ↑ 28%
Average delay time per vehicle [sec] 71 52 ↓ 27%
Average number of stops per vehicles 1.5 1.2 ↓ 20%
Table 3. Average simulation results of the test network with 10% augmentation of the design
input volumes
Alike above, the behavior of the reduced network was analyzed with normal and heavier
input traffic volumes. The results ameliorated in both cases (see Table 2. and 3.). The
simulation time was 2 hours long.
The aim of the MPC based control is the minimization of the number of vehicles waiting at
the stop line. The current system cannot adapt to the increased volume. The average queue
length grew strongly during the simulations. However, the MPC strategy is able to manage
heavier traffic situations real-time. Figure 5. represents the effectiveness of our system. It
shows the variation of average queue lengths in the network.
Fig. 5. The variation of average queue lengths in the two different control cases
6. Distributed traffic management system based on MPC
The classical scheme for adaptive road traffic management structure is based on control
center which processes and computes all signal control for the network. Another method for
the control system architecture is the decentralized and distributed control scheme. This
approach has numerous economical and technological advantages.
In this section we present a distributed control system scheme for urban road traffic
management. The control algorithm is based on MPC involving Jacobi iteration algorithm to
solve constrained and nonlinear programming problem. The distributed control design was
also simulated and tested.
6.1 The MPC cost function
We refer to the results of Section 5.1. Substituting
kx
~
and
kg in Equation (8) one arrives
to:
gggcqcgBqcgrIBBqgkJ
TTTTTT
2
1
2
1
~~~
2
1
(9)
where
q and
r
are constants coming from the diagonal of the scalar matrices
Q
and
R
.
As
is a constant term, finally one has the objective function to minimize:
min
2
1
kgkkgkgkJ
TT
(10)
where is constant matrix as it contains the combination of constant turning rates,
saturation rates and fixed tuning parameters. At the same time
contains varying values
coming from the current dynamics of the traffic area.
6.2 Multivariable nonlinear programming to solve MPC problem
The solution of the MPC cost function (10) represents a multivariable nonlinear problem
subject to linear constraints. It formulates a standard quadratic optimization problem
(Bertsekas & Tsitsiklis, 1997):
Model Predictive Control262
min
2
1
gggkJ
TT
s. t.
0 hFg (11)
where matrix inequality
hFg
incorporates the constraints (4), (5) and (6) already
discussed in Section 3.1.
If
is a positive semi definite matrix, (11) gives a convex optimization problem (Boyd &
Vanderberghe, 2004). Otherwise one has to use the singular value decomposition method to
which results a convex problem. This means a linear transformation to the original
problem (11).
Using the duality theory (Bertsekas & Tsitsiklis, 1997) the primal problem can be formulated
into Lagrange dual standard form. The basic idea in Lagrangian duality is to take the
constraints into account by augmenting the objective function with a weighted sum of the
constraint functions. We define the Lagrangian associated with the problem as:
hFgkJgL
T
, (12)
We refer to
i
as the Lagrange multiplier associated with the ith inequality constraint of
(11). The dual function is defined as the minimum value of the Lagrangian function. This
can be easily calculated by setting gradient of Lagrangian to zero (Boyd & Vanderberghe,
2004). This yields an optimal green time vector (16) which minimizes the primal problem.
Hence one arrives to the dual of the quadratic programming problem:
min
2
1
TT
DUAL
wPkJ
s. t.
0
(13)
where
P
and
w
are coming from the original problem:
T
F
F
P
1
(14)
hFw
1
(15)
It is shown that if
provides optimal solution for the
kJ
DUAL
problem then
T
Fg
1
(16)
gives also an optimal solution for the primal problem (Rockafellar, 1970).
The dual problem has a simple constraint set compared with the primal problem’s
constraints. Hence expression (13) represents a standard minimization problem over
nonnegative orthant.
A very efficient method, the Jacobi iteration was found to solve the optimization problem.
Since
is a positive semi definite matrix the jth diagonal element of P , given by
j
T
jjj
ffp
1
(17)
is positive. This means that for every j the dual cost function is strictly convex along the jth
coordinate. Therefore the strict convexity is satisfied and it is possible to use the nonlinear
Jacobi algorithm. Because the dual objective function is also quadratic the iteration can be
written explicitly. Taking into account the form of the first partial derivative of the dual cost
n
k
kjkj
pw
1
(18)
the method is given by:
n
k
kjkj
jj
jj
tpw
p
tt
1
,0max1
, nj ,,1
(19)
Where
0
is the stepsize parameter which should be chosen sufficiently small and some
experimentation may be needed to obtain the appropriate range for
.
The importance of this method, over its efficiency, is the ability to satisfy the positivity since
equation (19) excludes negative solution for
. Thus, during the MPC control process at
each (kth) step the optimal green times can be directly calculated from equation (16) after
solving the problem (11).
6.3 Realization of MPC based distributed traffic management system
The economical and technological innovation of the above described control method is
represented by the state-of-the-art control design and the optional decentralized realization
at the same time.
Generally, the architectures of traffic control systems can be central, decentralized, or mixed.
The central management architecture is a frequent strategy based on a central processor
which controls all signal controllers in the transportation network. Decentralized and mixed
control systems are not so common applications yet. However they have many advantages
and represent a new way in traffic control technology. Decentralized management systems
carry a higher performance since they can distribute their computations between the traffic
controllers. As well as they represent a higher operation safety because of their structural
redundancy. Some of these distributed realizations are for example SCATS (Wolshon &
Taylor, 1999) or Utopia (UTOPIA, 2010).
The distributed technology can be used in any road traffic network which is equipped with
adequate signal controllers and detectors, as well as communication between controllers is
also required.
Since the solution of the Jacobi algorithm (19) is an iteration process the computers can
distribute their calculations during the operation cycle. Therefore it is suitable for the
distributed realization of the MPC problem. Considering a large traffic network the
following practical system realization can be applied. Firstly we define the nodes
represented by the red cubes on Figure 6. The nodes are the head traffic controllers which
participate in the resolution procedure. Every node covers a few intersections (traffic
MPC in urban trafc management 263
min
2
1
gggkJ
TT
s. t.
0
hFg (11)
where matrix inequality
hFg
incorporates the constraints (4), (5) and (6) already
discussed in Section 3.1.
If
is a positive semi definite matrix, (11) gives a convex optimization problem (Boyd &
Vanderberghe, 2004). Otherwise one has to use the singular value decomposition method to
which results a convex problem. This means a linear transformation to the original
problem (11).
Using the duality theory (Bertsekas & Tsitsiklis, 1997) the primal problem can be formulated
into Lagrange dual standard form. The basic idea in Lagrangian duality is to take the
constraints into account by augmenting the objective function with a weighted sum of the
constraint functions. We define the Lagrangian associated with the problem as:
hFgkJgL
T
, (12)
We refer to
i
as the Lagrange multiplier associated with the ith inequality constraint of
(11). The dual function is defined as the minimum value of the Lagrangian function. This
can be easily calculated by setting gradient of Lagrangian to zero (Boyd & Vanderberghe,
2004). This yields an optimal green time vector (16) which minimizes the primal problem.
Hence one arrives to the dual of the quadratic programming problem:
min
2
1
TT
DUAL
wPkJ
s. t.
0
(13)
where
P
and
w
are coming from the original problem:
T
F
F
P
1
(14)
hFw
1
(15)
It is shown that if
provides optimal solution for the
kJ
DUAL
problem then
T
Fg
1
(16)
gives also an optimal solution for the primal problem (Rockafellar, 1970).
The dual problem has a simple constraint set compared with the primal problem’s
constraints. Hence expression (13) represents a standard minimization problem over
nonnegative orthant.
A very efficient method, the Jacobi iteration was found to solve the optimization problem.
Since
is a positive semi definite matrix the jth diagonal element of P , given by
j
T
jjj
ffp
1
(17)
is positive. This means that for every j the dual cost function is strictly convex along the jth
coordinate. Therefore the strict convexity is satisfied and it is possible to use the nonlinear
Jacobi algorithm. Because the dual objective function is also quadratic the iteration can be
written explicitly. Taking into account the form of the first partial derivative of the dual cost
n
k
kjkj
pw
1
(18)
the method is given by:
n
k
kjkj
jj
jj
tpw
p
tt
1
,0max1
, nj ,,1 (19)
Where
0
is the stepsize parameter which should be chosen sufficiently small and some
experimentation may be needed to obtain the appropriate range for
.
The importance of this method, over its efficiency, is the ability to satisfy the positivity since
equation (19) excludes negative solution for
. Thus, during the MPC control process at
each (kth) step the optimal green times can be directly calculated from equation (16) after
solving the problem (11).
6.3 Realization of MPC based distributed traffic management system
The economical and technological innovation of the above described control method is
represented by the state-of-the-art control design and the optional decentralized realization
at the same time.
Generally, the architectures of traffic control systems can be central, decentralized, or mixed.
The central management architecture is a frequent strategy based on a central processor
which controls all signal controllers in the transportation network. Decentralized and mixed
control systems are not so common applications yet. However they have many advantages
and represent a new way in traffic control technology. Decentralized management systems
carry a higher performance since they can distribute their computations between the traffic
controllers. As well as they represent a higher operation safety because of their structural
redundancy. Some of these distributed realizations are for example SCATS (Wolshon &
Taylor, 1999) or Utopia (UTOPIA, 2010).
The distributed technology can be used in any road traffic network which is equipped with
adequate signal controllers and detectors, as well as communication between controllers is
also required.
Since the solution of the Jacobi algorithm (19) is an iteration process the computers can
distribute their calculations during the operation cycle. Therefore it is suitable for the
distributed realization of the MPC problem. Considering a large traffic network the
following practical system realization can be applied. Firstly we define the nodes
represented by the red cubes on Figure 6. The nodes are the head traffic controllers which
participate in the resolution procedure. Every node covers a few intersections (traffic
Model Predictive Control264
controllers) which do not participate in the computation. The distributed control network is
represented by Figure 6.
1
2
4
3
,x
,x
,x
,x
Fig. 6. Distributed MPC control in urban traffic network
The distributed computation is executed during the operation cycle as follows:
1. Communication: At the end of the kth cycle all traffic controllers send their
measurements (number of vehicles) to their node.
2. Communication: The head controllers share the measurement data with the other
nodes.
3. Calculation (which is not the third step practically since it can be started parallel
with step 1.): Node 1. starts iteration procedure. After some predefined iteration
steps it forwards their computational results to the next node and so on. The
transmitted data is the currently calculated vector
s
where
, ,2,1s (
represents the final iteration step number specified previously).
4. Communication: When the last node finishes the computation (which means
practically that
s
) it shares the optimal result (
) with the other nodes.
5. Calculation: The head controllers calculate their final calculation. Using Equation
(16) the nodes do not need to execute the whole multiplication. But only the
specified part of
g which contains the optimal green times of their traffic
controllers.
6. Communication: Finally the nodes pass the optimal green times to every traffic
controllers for the next (k+1) cycle.
If one wishes to control small traffic network with a few intersections the distributed
solution is not certainly required. The calculation of one Jacobi iteration step means simple
multiplications and additions of scalars. In case of few states (number of the controlled
links) a single controller’s performance is sufficient to compute all signal sets of the network.
Thus the system is working with redundancy which can be very useful at the same time.
The controllers can continuously check their operation comparing their computation results.
On the other hand, if one of the signal controllers fails in the network the system can go on
with safe functioning.
However with the growth of the number of the system states the computational demand
increases quadratically. Therefore larger network requires the distributed solution of the
MPC control. Certainly the solution method is also largely depends on the performance of
the actual signal controllers and the communication system.
6.4 Simulation of MPC based distributed control algorithm
To verify the designed control system scheme a closed loop simulation environment was
created (Section 4.). The traffic network used for the simulation is equivalent with the one
applied in Section 5.2.
As discussed before the appropriate setting for the stepsize parameter
requires some
practical experimentation. This value strongly influences the performance of the calculation.
Convergence can be shown when
1
n
. However this value may lead to an unnecessarily
slow rate of convergence for some problems.
The values in Table 4. shows the variation of the number of steps to achieve convergence. In
case of our test network the smallest value with convergence was
0525.0
n
.
Number of steps
1
n
6000
5.0
n
1000
1.0
n
200
0525.0
n
150
Table 4. The variation of the number of steps to achieve convergence
We also compared the computation times of the applied methods. Using the quadprog
function of MATLAB the computation time was about 20 seconds. Conversely the Jacobi
algorithm required less than 1 second on average which means 20 times faster calculation. It
has to be noted that the Jacobi algorithm was not tested in a distributed way. However even
with some communication time the Jacobi iteration is more efficient. On the one hand in our
test network the number of states was quite few. The distributed solution is not needed. On
the other hand the distributed realization is highly dependent on the current system
configuration (measurement accuracy, communication speed, etc.).
6.5 Vehicle priority management in MPC based urban control
The design of an adaptive traffic control system comes with the desirable demand to
incorporate vehicle priority management as well. Therefore an additional feature of the
designed system is the ability to manage priority.
The scope of the priority management has to be specified as some special vehicle classes
(e.g. emergency vehicles) have top-level priority. Therefore they do not need any help from
traffic lights to cross the intersections anytime. Our control deals vehicles which are favored
compared to the others but not by all means. Vehicles of the public transport are typically of
this sort. However one may differentiate the levels of importance even between public
vehicles (e.g. an overland bus compared to a local bus).
To operate such system these vehicles have to be able to communicate with the traffic
controllers. If a preferred vehicle arrives to any junction of the network it may be
automatically indicated by the traffic controller through radio frequency. Its stage can be
handled with priority getting maximum green time as possible in every cycle until the
MPC in urban trafc management 265
controllers) which do not participate in the computation. The distributed control network is
represented by Figure 6.
1
2
4
3
,x
,x
,x
,x
Fig. 6. Distributed MPC control in urban traffic network
The distributed computation is executed during the operation cycle as follows:
1. Communication: At the end of the kth cycle all traffic controllers send their
measurements (number of vehicles) to their node.
2. Communication: The head controllers share the measurement data with the other
nodes.
3. Calculation (which is not the third step practically since it can be started parallel
with step 1.): Node 1. starts iteration procedure. After some predefined iteration
steps it forwards their computational results to the next node and so on. The
transmitted data is the currently calculated vector
s
where
, ,2,1s (
represents the final iteration step number specified previously).
4. Communication: When the last node finishes the computation (which means
practically that
s
) it shares the optimal result (
) with the other nodes.
5. Calculation: The head controllers calculate their final calculation. Using Equation
(16) the nodes do not need to execute the whole multiplication. But only the
specified part of
g which contains the optimal green times of their traffic
controllers.
6. Communication: Finally the nodes pass the optimal green times to every traffic
controllers for the next (k+1) cycle.
If one wishes to control small traffic network with a few intersections the distributed
solution is not certainly required. The calculation of one Jacobi iteration step means simple
multiplications and additions of scalars. In case of few states (number of the controlled
links) a single controller’s performance is sufficient to compute all signal sets of the network.
Thus the system is working with redundancy which can be very useful at the same time.
The controllers can continuously check their operation comparing their computation results.
On the other hand, if one of the signal controllers fails in the network the system can go on
with safe functioning.
However with the growth of the number of the system states the computational demand
increases quadratically. Therefore larger network requires the distributed solution of the
MPC control. Certainly the solution method is also largely depends on the performance of
the actual signal controllers and the communication system.
6.4 Simulation of MPC based distributed control algorithm
To verify the designed control system scheme a closed loop simulation environment was
created (Section 4.). The traffic network used for the simulation is equivalent with the one
applied in Section 5.2.
As discussed before the appropriate setting for the stepsize parameter
requires some
practical experimentation. This value strongly influences the performance of the calculation.
Convergence can be shown when
1
n
. However this value may lead to an unnecessarily
slow rate of convergence for some problems.
The values in Table 4. shows the variation of the number of steps to achieve convergence. In
case of our test network the smallest value with convergence was
0525.0
n
.
Number of steps
1
n
6000
5.0
n
1000
1.0
n
200
0525.0
n
150
Table 4. The variation of the number of steps to achieve convergence
We also compared the computation times of the applied methods. Using the quadprog
function of MATLAB the computation time was about 20 seconds. Conversely the Jacobi
algorithm required less than 1 second on average which means 20 times faster calculation. It
has to be noted that the Jacobi algorithm was not tested in a distributed way. However even
with some communication time the Jacobi iteration is more efficient. On the one hand in our
test network the number of states was quite few. The distributed solution is not needed. On
the other hand the distributed realization is highly dependent on the current system
configuration (measurement accuracy, communication speed, etc.).
6.5 Vehicle priority management in MPC based urban control
The design of an adaptive traffic control system comes with the desirable demand to
incorporate vehicle priority management as well. Therefore an additional feature of the
designed system is the ability to manage priority.
The scope of the priority management has to be specified as some special vehicle classes
(e.g. emergency vehicles) have top-level priority. Therefore they do not need any help from
traffic lights to cross the intersections anytime. Our control deals vehicles which are favored
compared to the others but not by all means. Vehicles of the public transport are typically of
this sort. However one may differentiate the levels of importance even between public
vehicles (e.g. an overland bus compared to a local bus).
To operate such system these vehicles have to be able to communicate with the traffic
controllers. If a preferred vehicle arrives to any junction of the network it may be
automatically indicated by the traffic controller through radio frequency. Its stage can be
handled with priority getting maximum green time as possible in every cycle until the
Model Predictive Control266
vehicle will not leave the intersection. It means practically that the cost function is
dynamically modified by the system weights depending of the presence of any preferred
vehicles. Accordingly for the sake of immediate reaction the given junction falls out of the
scope of the coordinated traffic control until the vehicle will not leave the intersection.
However it can be considered as disturbance.
We refer to the original MPC cost function (8) where Q is a diagonal weighting matrix:
n
q
q
q
Q
2
1
(20)
Each diagonal element tunes a state (queue length of controlled links). If there is no preferred
vehicle in the scope of control:
n
qqq
21
. By online modifying the weight
i
q (according to
the preferred vehicle's direction) one can assure priority. The measure of the modification of
i
q
depends on the current level of priority. In practice, the appropriate choice of the weights is an
empirical process as it strongly depends on the junction's properties.
7. Future work: Robust MPC in urban traffic management
As future work we introduce the problem of robustness in urban traffic management. In
Section 3.1 all disturbances in the state space model were considered as known (measured)
values and all possible uncertainties were neglected. These assumptions were taken by
practical reasons. However for more precise traffic modeling these factors can be involved in
the control scheme determining upper and lower bounds of the uncertainties. This implies
the use of a suitable robust control method as well.
The simplest approach to represent disturbances in the system is the
bounded unknown
external additive disturbance
. In this case an additive term appears in the LTI state space
model. This approach can deal with state disturbances. As a part of the Ph.D thesis of
Löfberg (2003) a Minimax MPC is presented which can be eligible for traffic systems too.
Another possibility to model the uncertainties is the polytopic paradigm. The system
matrices
kA and
kB of an LTV state space description can be defined by a prespecified
polytopic set:
LL
BABABACo ,,,=
2211
(21)
where Co devotes to the convex hull and
L
is the number of the vertices. Matrix
kA can
be used to express uncertainties of the states. In practice it means for example parking places
along the road or non-controlled junctions in the network which result unmeasured state
variation. Matrix
kB can be used to represent uncertainties of the saturation flow rates
which are also non-measurable parameters. For polytopic system Kothare et al. (1996)
provide an efficient Minimax MPC solution which can be potentially applied in urban traffic
management as well.
There is another factor which can be taken into consideration in robust traffic control. In
Section 5.1 the demands (
d ) intending to enter the network were assumed constant and
measured disturbances. In effect they vary continuously. Therefore for fully exact solution
varying demands should be considered in the MPC cost function.
8. Conclusion
This chapter introduced the aspects of MPC applied in urban traffic management. As the
urban traffic is a complex system having special attributes the appropriate traffic model had
to be discussed in details as well. At the same time MPC technology is suitable to control
such complex system optimally and real-time. The main control aim was the optimal and
coordinated control which can be satisfied. The applicability was demonstrated by several
simulations. Furthermore a distributed technology was presented which can be very useful
in practice particularly in large traffic network. As an additional feature of MPC based
system we showed that an optional vehicle priority management can be easily implemented
in the control design. Finally we introduced the possibility of the robust control in urban
traffic which is a planned research scope in the future.
9. Acknowledgement
This work is connected to the scientific program of the "Development of quality-oriented
and harmonized R+D+I strategy and functional model at BME" project. This project is
supported by the New Hungary Development Plan (Project ID: TÁMOP-4.2.1/B-
09/1/KMR-2010-0002) and by the Hungarian Scientific Research Fund (OTKA) through
grant No. CNK 78168 and by the János Bólyai Research Scholarship of the Hungarian
Acadamy of Sciences which are gratefully acknowledged.
10. References
Aboudolas, K.; Papageorgiou, M. & Kosmatopoulos, E. (2009). Store-and-forward based
methods for the signal control problem in large-scale congested urban road networks,
Transportation Research Part C: Emerging Technologies, 17:163_174,
doi:10.1016/j.trc.2008.10.002
Bellemans, T.; De Schutter, B. & De Moor, B. (2002). Model predictive control with repeated
model fitting for ramp metering. Singapore, Proceedings of the Fifth IEEE Intelligent
Transportation Systems Conference, doi:10.1109/ITSC.2002.1041221
Bertsekas, D. P. & Tsitsiklis, J. N. (1997). Parallel and distributed computation: Numerical
methods. ISBN 1-886529-01-9, 731 pages
Blanchini, F. & Miani, S. (2007). Set-Theoretic Methods in Control. ISBN:0817632557,
Birkhäuser, Boston
Boyd, S. & Vanderberghe, L. (2004). Convex optimization. Cambridge University Press, ISBN
0 521 83378 7
Diakaki, C.; Papageorgiou, M. & McLean, T. (1999). Application and evaluation of the integrated
traffic-responsive urban corridor control strategy In-TUC in Glasgow. In CD-ROM of the
78th Annual Meeting of the Transportation Research Board, number 990310,
Washington, D.C., USA
Farges, J. L.; Henry, J. J. & Tufal, J. (1983). The PRODYN real-time traffic algorithm. In 4th
IFAC Symposium on Transportation Systems, pages 307_312
MPC in urban trafc management 267
vehicle will not leave the intersection. It means practically that the cost function is
dynamically modified by the system weights depending of the presence of any preferred
vehicles. Accordingly for the sake of immediate reaction the given junction falls out of the
scope of the coordinated traffic control until the vehicle will not leave the intersection.
However it can be considered as disturbance.
We refer to the original MPC cost function (8) where Q is a diagonal weighting matrix:
n
q
q
q
Q
2
1
(20)
Each diagonal element tunes a state (queue length of controlled links). If there is no preferred
vehicle in the scope of control:
n
qqq
21
. By online modifying the weight
i
q (according to
the preferred vehicle's direction) one can assure priority. The measure of the modification of
i
q
depends on the current level of priority. In practice, the appropriate choice of the weights is an
empirical process as it strongly depends on the junction's properties.
7. Future work: Robust MPC in urban traffic management
As future work we introduce the problem of robustness in urban traffic management. In
Section 3.1 all disturbances in the state space model were considered as known (measured)
values and all possible uncertainties were neglected. These assumptions were taken by
practical reasons. However for more precise traffic modeling these factors can be involved in
the control scheme determining upper and lower bounds of the uncertainties. This implies
the use of a suitable robust control method as well.
The simplest approach to represent disturbances in the system is the
bounded unknown
external additive disturbance
. In this case an additive term appears in the LTI state space
model. This approach can deal with state disturbances. As a part of the Ph.D thesis of
Löfberg (2003) a Minimax MPC is presented which can be eligible for traffic systems too.
Another possibility to model the uncertainties is the polytopic paradigm. The system
matrices
kA and
kB of an LTV state space description can be defined by a prespecified
polytopic set:
LL
BABABACo ,,,=
2211
(21)
where Co devotes to the convex hull and
L
is the number of the vertices. Matrix
kA can
be used to express uncertainties of the states. In practice it means for example parking places
along the road or non-controlled junctions in the network which result unmeasured state
variation. Matrix
kB can be used to represent uncertainties of the saturation flow rates
which are also non-measurable parameters. For polytopic system Kothare et al. (1996)
provide an efficient Minimax MPC solution which can be potentially applied in urban traffic
management as well.
There is another factor which can be taken into consideration in robust traffic control. In
Section 5.1 the demands (
d ) intending to enter the network were assumed constant and
measured disturbances. In effect they vary continuously. Therefore for fully exact solution
varying demands should be considered in the MPC cost function.
8. Conclusion
This chapter introduced the aspects of MPC applied in urban traffic management. As the
urban traffic is a complex system having special attributes the appropriate traffic model had
to be discussed in details as well. At the same time MPC technology is suitable to control
such complex system optimally and real-time. The main control aim was the optimal and
coordinated control which can be satisfied. The applicability was demonstrated by several
simulations. Furthermore a distributed technology was presented which can be very useful
in practice particularly in large traffic network. As an additional feature of MPC based
system we showed that an optional vehicle priority management can be easily implemented
in the control design. Finally we introduced the possibility of the robust control in urban
traffic which is a planned research scope in the future.
9. Acknowledgement
This work is connected to the scientific program of the "Development of quality-oriented
and harmonized R+D+I strategy and functional model at BME" project. This project is
supported by the New Hungary Development Plan (Project ID: TÁMOP-4.2.1/B-
09/1/KMR-2010-0002) and by the Hungarian Scientific Research Fund (OTKA) through
grant No. CNK 78168 and by the János Bólyai Research Scholarship of the Hungarian
Acadamy of Sciences which are gratefully acknowledged.
10. References
Aboudolas, K.; Papageorgiou, M. & Kosmatopoulos, E. (2009). Store-and-forward based
methods for the signal control problem in large-scale congested urban road networks,
Transportation Research Part C: Emerging Technologies, 17:163_174,
doi:10.1016/j.trc.2008.10.002
Bellemans, T.; De Schutter, B. & De Moor, B. (2002). Model predictive control with repeated
model fitting for ramp metering. Singapore, Proceedings of the Fifth IEEE Intelligent
Transportation Systems Conference, doi:10.1109/ITSC.2002.1041221
Bertsekas, D. P. & Tsitsiklis, J. N. (1997). Parallel and distributed computation: Numerical
methods. ISBN 1-886529-01-9, 731 pages
Blanchini, F. & Miani, S. (2007). Set-Theoretic Methods in Control. ISBN:0817632557,
Birkhäuser, Boston
Boyd, S. & Vanderberghe, L. (2004). Convex optimization. Cambridge University Press, ISBN
0 521 83378 7
Diakaki, C.; Papageorgiou, M. & McLean, T. (1999). Application and evaluation of the integrated
traffic-responsive urban corridor control strategy In-TUC in Glasgow. In CD-ROM of the
78th Annual Meeting of the Transportation Research Board, number 990310,
Washington, D.C., USA
Farges, J. L.; Henry, J. J. & Tufal, J. (1983). The PRODYN real-time traffic algorithm. In 4th
IFAC Symposium on Transportation Systems, pages 307_312
Model Predictive Control268
Gartner, N. H. (1983). OPAC: A demand-responsive strategy for traffic signal control.
Transportation Research Record, 906:75_84
Gazis, D. C. & Potts, R. B. (1963). The oversaturated intersection. In: Proceedings of the Second
International Symposium on Traffic Theory, London, UK, pp. 221–237.
Hegyi, A.; De Schutter, B. & Hellendoorn, J. (2003). MPC-based optimal coordination of variable
speed limits to suppress shock waves in freeway traffic. Denver, USA, American Control
Conference.
Hunt, P. B.; Robertson, D. L. & Bretherton, R. D. (1982). The SCOOT on-line traffic signal
optimisation technique. Traffic Engineering & Control, 23:190_192
Kwon, H. K. & Pearson, A. E. (1978). On Feedback Stabilization of Time-Varying Discrete Linear
System. IEEE Trans. Autom. Control, 23_3_, pp. 479–481
Maciejowski, J. M. (2002): Predictive Control with Constraints. Harlow, England: Prentice Hall
MATLAB, (2010). The MathWorks Inc., available on
Rawlings, J. B. & Muske, K. R. (1993). The Stability of Constrained Receding Horizon Control.
IEEE Trans. Autom. Control, 38_10_, pp. 1512– 1516., doi:10.1109/9.241565
Mayne, D. Q.; Rawlings, J. B.; Rao, C. V. & Scokaert, P. O. (2000). Constrained Model Predictive
Control: Stability and Optimality. Automatica, 36_6_, pp. 789–814.,
doi:10.1016/S0005-1098(99)00214-9
Kothare, M. V.; Balakrishnan, V. & Morari, M. (1996). Robust Constrained Model Predictive
Control using Linear Matrix Inequalities. Automatica, vol. 32, no. 10, pp. 1361 79.,
doi:10.1016/0005-1098(96)00063-5
Kulcsár, B.; Varga, I. & Bokor, J. (2005). Constrained Split Rate Estimation by Moving Horizon.
16th IFAC World Congress Prague, Czech Republic
Lowrie, P. R. (1982). The Sydney co-ordinated adaptive traffic system – principles, methodology
logrithms. In: International Conference on Road Traffic Signaling, London, pp. 67–70
Löfberg, J. (2003). Minimax approaches to robust model predictive control. Ph.D thesis, Linköping
University, Sweden
Roca, V. (2005). User Manual for the VISSIM COM interface, PTV AG.
Rockafellar, R. T. (1970). Convex analysis, Princeton University Press
Sen, S. & Head, L. (1997). Controlled optimization of phases at an intersection. Transportation
Science, 31:5_17, doi: 10.1287/trsc.31.1.5
Tettamanti, T. & Varga, I. (2010). Distributed traffic control system based on model predictive
control. Periodica Polytechnica ser. Civil. Eng., 54
Tettamanti, T.; Varga, I.; Kulcsár, B. & Bokor, J. (2008). Model predictive control in urban traffic
network management. 16th IEEE Mediterranean Conference on Control and
AutomationIn CD ISBN:978-1-4244-2505-1 pp. 1538-1543, Ajaccio, Corsica, France
UTOPIA, (2010). Swarco AG., available on
Vigos, G.; Papageorgiou, M. & Wang, Y. (2007). Real-time estimation of vehicle-count within
signalized links. Transportation Research Part C, doi: 10.1016/j.trc.2007.06.002
VISSIM, (2010). PTV AG., available on
Webster, F. V. & Cobbe, B. M. (1966). Traffic Signals. Technical Paper 56. HMSO, London
Welch, G. & Bishop, G. (1995). An Introduction to the Kalman Filter. University of North
Carolina at Chapel Hill, TR95-041
Wiedemann, R. (1974).
Simulation des Straßenverkehrsflusses, Schriftenreihe des Instituts für
Verkehrswesen der Universität Karlsruhe, Heft 8
Off-line model predictive control of dc-dc converter 269
Off-line model predictive control of dc-dc converter
Tadanao Zanma and Nobuhiro Asano
0
Off-line model predictive
control of dc-dc converter
Tadanao Zanma and Nobuhiro Asano
Mie University
Japan
1. Introduction
Control systems with switching modes in which different dynamics are assigned are called
hybrid dynamical systems and are being actively researched (1–6). The continuous behavior
in the hybrid dynamical system is expressed generally by differential or difference equations,
while the discrete behavior is described by logics or state machines such as automata. If a sys-
tem can be regarded as a hybrid dynamical system, both continuous and discrete properties
can be dealt with concurrently. Therefore, a hybrid dynamical system has the ability to repre-
sent many systems as a single model without dividing into separate continuous and discrete
systems.
Power electronic circuits can also be regarded as hybrid dynamical systems as they share both
continuous and discontinuous behaviors(7–14). The continuous behavior of current or voltage
in such a system is subject to passive elements such as resistance, capacitance and inductance,
whereas the discontinuous element of switching devices such as MOSFETs and IGBTs yields
an on-off signal that is essentially discrete.
A conventional method currently being used for the control of dc-dc converters is PWM (Pulse
Width Modulation) with triangular wave. The average output voltage is controlled by PWM,
which determines on-off switching timing by employing relatively high carrier frequency.
However, the reference may vary in the half period of triangular wave carrier if the carrier
frequency is lowered to decrease switching loss for saving energy. Then, the average voltage
can no longer approximate the voltage reference. One possible reason is that the control fre-
quency is determined by the carrier frequency only. Another reason may be that the PWM
method focuses only on the average output characteristic and excludes switching property.
Therefore, a novel method is desired for dc-dc converters by considering switching property
explicitly as hybrid dynamical systems.
For synthesis of the hybrid dynamical system, various approaches have been proposed.
Specifically, modeling and synthesis based on mixed logical dynamical (MLD) systems
has much potential since the formulation is similar to the linear discrete time state space
representation(19). The solution of the design is obtained by solving an optimization prob-
lem with the help of model predictive control (MPC)(16; 17). It derives the optimal input to
minimize an estimation of a given cost function by predicting controlled variables for an MLD
system. Specifically, the problem is reduced to a mixed-integer linear or quadratic program-
ming (MILP or MIQP) problem. The method is expected to achieve better control performance
than that achieved by conventional methods when applied to the output control of a power
12
Model Predictive Control270
Fig. 1. Topology of the step-down dc-dc converter.
converter. However, it is difficult to solve the optimal problem online because of the com-
putation burden caused by the control period of power converters being considerably short
compared to that in mechanical or process control systems.
This paper proposes a control method using the MPC for the output control problem of the
dc-dc converter. The considered system is described as an MLD system form. In our work(14),
one control period is divided into N submodels. Thus, additional auxiliary variables are
needed. In addition, the state variable among the submodels is handled as an averaged one.
The method in this paper, however. requires no averaging. The explicit switching law is given
as a direct gate signal for the switching devices. Moreover, it is emphasized that a quadratic
cost function which was not adopted in a previous work(14) is addressed in this paper so that
not only the tracking error but also the switching losses can be considered. The proposed
control method achieves quick tracking to the reference in transient state, while keeping the
switching frequency as small as possible in steady state. To verify the effectiveness of the
proposed method, numerical simulations and experimental results are illustrated.
This paper is organized as follows. In Section 2, a step-down dc-dc converter and MLD system
are introduced. Next, the optimization problem for the control is described. Following several
simulation results, Section 3 proposes a modified control method taking into account the com-
putation delay. Then, experimental results are shown in Section 4. Finally, Section 5 concludes
this paper. In the Appendix, formulation of constraints and transformation to mp-MIQP are
explained.
2. Preliminaries
In this section, a step-down dc-dc converter is considered as an example of power elec-
tronic circuits. After the formulation, an MLD system(19) and multi-parametric MIQP (mp-
MIQP)(18) are reviewed.
2.1 Step-down dc-dc converter
The circuit topology of the step-down dc-dc converter is shown in Fig. 1. The dc-dc con-
verter controls the load voltage v
o
with on-off switches S
1
and S
2
. The resistance r
o
expresses
the load. The equivalent series resistance of the capacitor and the internal resistance of the
inductor are denoted by r
c
and r
l
, respectively, while x
l
and x
c
represent inductance and ca-
pacitance of the low-pass filtering stage, respectively. Switches S
1
and S
2
cannot be conducted
simultaneously. Together with diode D, switch S
2
provides a path for the inductor current i
l
regardless of whether it is positive or negative. The continuous time state-space representa-
tion of the dc-dc converter shown in Fig. 1 is given by
˙
x
(t) = A
c
x(t) + B
c
u(t), (1)
y
(t) = C
c
x(t), (2)
where x
(t) =
i
l
(t) v
o
(t)
. Denoted by i
l
(t) and v
o
(t) are the inductor current
and output voltage, respectively. The matrices A
c
, B
c
and C
c
are given by A
c
=
−
r
l
x
l
−
1
x
l
r
o
r
c
+r
o
(
1
x
c
−
r
c
r
l
x
l
) −
r
o
r
c
+r
o
(
1
x
c
r
o
+
r
c
x
l
)
, B
c
=
1
x
l
r
c
r
o
x
l
(r
c
+r
o
)
and C
c
=
0 1
, respectively.
Eqs. (1) and (2) are sampled by T
s
. Hereafter, the discrete time is described anew as t. Thus,
the considered system is recast as follows.
x
(t + 1) = Ax(t) + Bu(t), (3)
y
(t) = Cx(t), (4)
where A
= e
A
c
T
s
, B =
T
s
0
e
A
c
τ
dτB
c
and C = C
c
. Note that the value of input is limited to
either 0 or v
s
, which can be rewritten as follows.
(∀t) u(t) ∈ {0, v
s
}. (5)
2.2 Representation by MLD system(19)
A mixed logical dynamical (MLD) system is described by a linear dynamical equation with
linear mixed-integer inequalities so that discrete properties included in the process can be
introduced into the system using logical variables. One advantage is that the logical formula
can be described with linear inequalities and model predictive control can be applied.
The model of the dc-dc converter is rewritten to the MLD system representation. The auxiliary
δ of 0-1 variable is introduced as a new input variable to describe the discrete variable. The
variable is associated as follows.
[δ(t) = 1] → [z(t) = v
s
], (6)
[δ(t) = 0] → [z(t) = 0], (7)
where z
(t) is,
0
≤ z(t) ≤ v
s
. (8)
Eqs. (6) and (7) indicate that z
(t) = v
s
if δ(t) = 1, whereas z(t) = 0, otherwise. By replacing
Eqs. (6) and (7) with their equivalent linear inequalities,
E
1
δ(t) + E
2
z(t) ≤ E
3
u(t) + E
4
x(t) + E
5
, (9)
where,
E
1
=
0 v
s
−v
s
0
, (10)
E
2
=
1
−1 1 −1
, (11)
E
3
= E
4
= O, (12)
E
5
=
v
s
0 0 0
. (13)
Off-line model predictive control of dc-dc converter 271
Fig. 1. Topology of the step-down dc-dc converter.
converter. However, it is difficult to solve the optimal problem online because of the com-
putation burden caused by the control period of power converters being considerably short
compared to that in mechanical or process control systems.
This paper proposes a control method using the MPC for the output control problem of the
dc-dc converter. The considered system is described as an MLD system form. In our work(14),
one control period is divided into N submodels. Thus, additional auxiliary variables are
needed. In addition, the state variable among the submodels is handled as an averaged one.
The method in this paper, however. requires no averaging. The explicit switching law is given
as a direct gate signal for the switching devices. Moreover, it is emphasized that a quadratic
cost function which was not adopted in a previous work(14) is addressed in this paper so that
not only the tracking error but also the switching losses can be considered. The proposed
control method achieves quick tracking to the reference in transient state, while keeping the
switching frequency as small as possible in steady state. To verify the effectiveness of the
proposed method, numerical simulations and experimental results are illustrated.
This paper is organized as follows. In Section 2, a step-down dc-dc converter and MLD system
are introduced. Next, the optimization problem for the control is described. Following several
simulation results, Section 3 proposes a modified control method taking into account the com-
putation delay. Then, experimental results are shown in Section 4. Finally, Section 5 concludes
this paper. In the Appendix, formulation of constraints and transformation to mp-MIQP are
explained.
2. Preliminaries
In this section, a step-down dc-dc converter is considered as an example of power elec-
tronic circuits. After the formulation, an MLD system(19) and multi-parametric MIQP (mp-
MIQP)(18) are reviewed.
2.1 Step-down dc-dc converter
The circuit topology of the step-down dc-dc converter is shown in Fig. 1. The dc-dc con-
verter controls the load voltage v
o
with on-off switches S
1
and S
2
. The resistance r
o
expresses
the load. The equivalent series resistance of the capacitor and the internal resistance of the
inductor are denoted by r
c
and r
l
, respectively, while x
l
and x
c
represent inductance and ca-
pacitance of the low-pass filtering stage, respectively. Switches S
1
and S
2
cannot be conducted
simultaneously. Together with diode D, switch S
2
provides a path for the inductor current i
l
regardless of whether it is positive or negative. The continuous time state-space representa-
tion of the dc-dc converter shown in Fig. 1 is given by
˙
x
(t) = A
c
x(t) + B
c
u(t), (1)
y
(t) = C
c
x(t), (2)
where x
(t) =
i
l
(t) v
o
(t)
. Denoted by i
l
(t) and v
o
(t) are the inductor current
and output voltage, respectively. The matrices A
c
, B
c
and C
c
are given by A
c
=
−
r
l
x
l
−
1
x
l
r
o
r
c
+r
o
(
1
x
c
−
r
c
r
l
x
l
) −
r
o
r
c
+r
o
(
1
x
c
r
o
+
r
c
x
l
)
, B
c
=
1
x
l
r
c
r
o
x
l
(r
c
+r
o
)
and C
c
=
0 1
, respectively.
Eqs. (1) and (2) are sampled by T
s
. Hereafter, the discrete time is described anew as t. Thus,
the considered system is recast as follows.
x
(t + 1) = Ax(t) + Bu(t), (3)
y
(t) = Cx(t), (4)
where A
= e
A
c
T
s
, B =
T
s
0
e
A
c
τ
dτB
c
and C = C
c
. Note that the value of input is limited to
either 0 or v
s
, which can be rewritten as follows.
(∀t) u(t) ∈ {0, v
s
}. (5)
2.2 Representation by MLD system(19)
A mixed logical dynamical (MLD) system is described by a linear dynamical equation with
linear mixed-integer inequalities so that discrete properties included in the process can be
introduced into the system using logical variables. One advantage is that the logical formula
can be described with linear inequalities and model predictive control can be applied.
The model of the dc-dc converter is rewritten to the MLD system representation. The auxiliary
δ of 0-1 variable is introduced as a new input variable to describe the discrete variable. The
variable is associated as follows.
[δ(t) = 1] → [z(t) = v
s
], (6)
[δ(t) = 0] → [z(t) = 0], (7)
where z
(t) is,
0
≤ z(t) ≤ v
s
. (8)
Eqs. (6) and (7) indicate that z
(t) = v
s
if δ(t) = 1, whereas z(t) = 0, otherwise. By replacing
Eqs. (6) and (7) with their equivalent linear inequalities,
E
1
δ(t) + E
2
z(t) ≤ E
3
u(t) + E
4
x(t) + E
5
, (9)
where,
E
1
=
0 v
s
−v
s
0
, (10)
E
2
=
1
−1 1 −1
, (11)
E
3
= E
4
= O, (12)
E
5
=
v
s
0 0 0
. (13)
Model Predictive Control272
is obtained. Inequality (9) reflects that z(t) = v
s
if δ( t) = 1 whereas z(t) = 0 if δ(t) = 0.
Namely, δ
(t) can be considered as the state of the switch: δ(t) = 1 if the switch is on, δ(t) = 0
otherwise. Note that z
(t) in inequality (8) is an apparent continuous auxiliary variable.
As a result, Eqs. (3), (4) and (5) can be transformed into an MLD system consisting of one
standard linear discrete time state space representation and linear inequalities associated with
the constraints on the system,
x
(t + 1) = Ax(t) + Bz(t), (14)
y
(t) = Cx(t), (15)
subject to Eq. (9). (16)
2.3 Multi-parametric MIQP(18)
Multi-parametric MIQP (mp-MIQP) is a type of MIQP(18) parameterized by multiple param-
eters. The mp-MIQP parameterized by state x of the system is described as follows.
min
ν
ν
Hν + 2x
Fν + x
Yx + 2C
f
ν + 2 C
x
x, (17)
subject to Gν
≤ W + Ex, (18)
where ν is
ν
=
∆
Ξ
, (19)
∆
=
δ
0
. . . δ
N
p
−1
, (20)
Ξ
=
z
0
. . . z
N
p
−1
. (21)
In Eqs. (20) and (21), the predictive horizon in MPC is denoted by N
p
.
If solved, the optimal solution of mp-MIQP is given as the piece-wise affine state feedback
form. Namely, the explicit control law parameterized by the state x is obtained as follows.
ν
= K
i
x + h
i
if x ∈ X
i
, (22)
where X
i
(i = 1, 2, . . .) are regions partitioned in the state space, and K
i
and h
i
are the cor-
responding constant matrices and vectors, respectively. As Eq. (22) is available off-line, the
optimal input is determined online according to the state measured at each sampling.
3. Numerical simulation and revision of control method
In this section, the effectiveness of the method proposed in the previous section and the Ap-
pendix is shown by applying it to the output control of the dc-dc converter shown in Fig. 1.
The control objective is to achieve quick tracking to the reference in transient state with mini-
mal switching in steady state. For the purpose, mp-MIQP is exploited.
3.1 Simulation condition and state partition
The circuit and control parameters for simulation are listed in Tables 1 and 2, respectively.
Let us consider Eqs. (14) to (16) as the model for the dc-dc converter shown in Fig. 1. In
Eq. (45),
˜
H and L are first set as zeros. Then, the setting of these matrices imply that focus
is only on tracking performance. The state partition obtained by off-line model predictive
control, (mp-MIQP) and its enlarged view are shown in Fig. 2. In each region of Fig. 2, the
optimal input sequence is assigned. The figure of state partition shown in Fig. 2 is generated
Table 1. Circuit parameters
source voltage v
s
5.0 [V]
inductance x
l
20 [µH]
internal resistance r
l
25 [mΩ]
capacitance x
c
2.2 [mF]
equivalent series resistance r
c
60[mΩ]
load resistance r
o
1[Ω]
Table 2. Control parameters
control period T
s
10 [µs]
predictive horizon N
p
1, 3, 5
upper limit i
l,max
8.0 [A]
reference value v
ref
2.0 [V]
using of Multi-Parametric Toolbox(20). In Fig. 2, the number of state partitions is limited to
at most 2
N
p
. Each partition is specified by linear inequalities. In each partition, the solution
of mp-MIQP given by Eq. (22) is assigned. To investigate to which partition it belongs, the
state
i
l
v
o
at each sampling can be performed simply since the obtained state partition
is constructed by linear inequalities. Focus on the white region at the right bottom corner
in Fig. 2. Whenever the state
i
l
v
o
enters the region, switch S
1
shown in Fig. 1 is forced
to turn off since the constraint about the inductor current given by Eq. (37) can no longer be
satisfied.
3.2 Consideration of delay for computation of state distinction
Figs. 3 and 4 show simulation results for N
p
= 3 and N
p
= 5, respectively. Note that the
method described in the Appendix is utilized for each of the calculations. Figs. 3 and 4, also
indicate that the output voltage is kept at the specified value 2.0 [V] in steady state, while the
inductor current does not exceed its limit of 8[A]. In the simulation, the computation time of
state distinction for optimal input is assumed to be negligible. Little difference exists between
-5 0 5 10
-1
0
1
2
3
4
5
il
vo
-5 0 5 10
1.6
1.8
2
2.2
2.4
2.6
il
vo
Fig. 2. State partition for N
p
= 5 (left: whole, rigtht: closeup).