The Discovery of Type II Superconductors Part 9 potx
Bạn đang xem bản rút gọn của tài liệu. Xem và tải ngay bản đầy đủ của tài liệu tại đây (5.47 MB, 25 trang )
Application of Optical Techniques in the Characterization of Thermal Stability and
Environmental Degradation in High Temperature Superconductors
191
Fig. 12. Behaviour of a sample with a defect in contact V
2
after having applied a pulse
current of 125 A for 3 s at 78.6 K. (a) Electric fields and (b) temperature profiles. (c)-(h)
Fringes patterns obtained taking as a reference the sample situation at t=t
0
-0.1 s.
Superconductor
192
for this reason the total deformation is being observed. The fringe patterns at t=0.15 s and
t=0.59 s show that in the initial bending deformation stages, the sample takes an S-like shape
with a central maximum deformation of 2.2
μm (8 fringes) and a minimum one of
approximately 0.56
μm (2 fringes) in the right part of the sample. In the rest of the images,
the sample deformation leads to the expected C-liked shape bending deformation of a
sample fixed by the two extremes. The number of fringes increases with time in a similar
way to the electric field.
DSPI also helps to detect situations in which heat is not generated in a uniform way. This can
be seen in Fig 12, which shows the behaviour observed in a 2G HTS wire where a defect was
unintentionally produced in the sample when soldering the voltage tap number 2 and a
current pulse of 125 A was applied for 5 s. In this case, the sample was placed on the metallic
plate. The electric field generation increases faster in regions 1-2 and 2-3 reaching values of the
order of 0.03 V/cm, two orders of magnitude higher than in the case presented in Fig. 11. At
t=2.67s the electric field in these two regions show a strong reduction that can be also observed
in the temperature profiles. They are associated with the increase in the heat transfer
coefficient of the liquid nitrogen when moving from the convective to the nucleate boiling
regime (Angurel et al., 2008, Martínez et al., 2010). The results indicate that the electric field
generation and the temperature increase in region 3-4 start later than in regions 1-2 and 2-3.
In this case, the deformation is much higher than in the previous case, the number of fringes
is too high and the resolution is not enough. For this reason, deformation evolution (Fig. 12.
c-h) has been visualized taking as the reference the previous image. With this configuration,
the observed deformation corresponds to the deformation that took place in the sample
during the previous 0.1s. At t=2.2s, deformation and, in consequence, heat generation is
located in the position of voltage contact V
2
. In the region between contacts V
3
and V
4
the
sample does not deform. This is also consistent with the measured temperature profiles
evolution. ΔT
34
starts to increase later on. At t=2.4s the heat generated in the sample, in the
left part, is enough to induce some movement of the liquid nitrogen above the sample. In
the last two photographs, the nucleate boiling has started between contacts V
1
and V
3
and
the fringe pattern can not be observed, while in the right part of the sample, region 3-4, the
different fringes can clearly be observed.
These results indicate that DSPI observations provide information that is complementary to
the electric field and temperature profiles. The main advantage is that DSPI provides precise
local information and determines with a good resolution where the origin of the heat
generation is placed and that this information can be inferred without anchoring any
voltage tap or thermocouple on the sample.
4. Analysis of environmental degradation in textured bulk Bi
2
Sr
2
CaCu
2
O
8+δ
monoliths obtained by laser melting techniques.
4.1 Applicability of digital speckle photography on the analysis of local surface
modifications in metallic materials.
Before studying the surface degradation in Bi
2
Sr
2
CaCu
2
O
8+
δ
monoliths, the possibilities of
the DSP technique have been explored on the analysis of well known corrosion processes of
metallic samples in different conditions. First, we analysed the corrosion of Fe samples in
H
2
SO
4
solutions with different concentrations (Andrés et al., 2008). In this case, the
corrosion process produces the generation of H
2
bubbles in the metallic surface. These
bubbles are clearly observed in Fig. 13.a in the case of a Fe sample after having been
immersed 40 s in a 0.1 N H
2
SO
4
solution. These bubbles prevent the information about the
surface state in these points from being obtained (Fig. 13.b).
Application of Optical Techniques in the Characterization of Thermal Stability and
Environmental Degradation in High Temperature Superconductors
193
Fig. 13. (a) Image of speckle photography from a Fe sample after being immersed in a 0.1 N
H
2
SO
4
solution for 40 s. (b) 2-D correlation coefficient map measured in these conditions.
For this reason, when corrosion takes place in an acid solution, these studies were
performed by recording the images with the sample removed from the solution. It was
observed that the time dependence of the correlation coefficient is linear in the initial 250 s,
when the correlation coefficient value reduces down to 0.6. It was proposed that the slope of
this variation is related to the corrosion rate of Fe in these conditions. DSP observations have
been compared with linear sweep voltametry measurements. This comparison showed that
DSP can be used to compare corrosion rates in different conditions.
A second problem that has been analysed is when the corrosion process involves the
deposition of a layer on the surface. This is the case of Fe samples immersed in Cu(NO
3
)
2
solutions, where a copper layer is deposited on the Fe surface. Samples have been sanded
with emery paper of 400# which produces a scratched structure on the surface (Fig. 14.a).
The maximum scratch depth is 1.2
μm. DSP observations (Fig. 14.b) clearly show that the
corrosion is not uniform being more important in the central and right part of the sample,
where the correlation coefficient has lower values.
In order to find a relation between the correlation coefficient variations and the
modifications taking place on the sample surface, the topography along the line indicated in
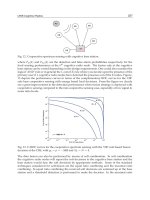
Fig 14.b has been measured using confocal microscopy. Results are compared in Fig. 15,
where each image corresponds to a 1.1 mm length. In Fig. 15.a and 15.b, the left part of the
region, with the highest values of the correlation coefficient, is presented. Between pixels
390 and 420, where the correlation coefficient remains close to 1, the surface was not
modified. In the regions where the correlation coefficient is reduced to values between 0.8
and 0.9 the surface becomes smoother. Around pixel 430, the correlation coefficient value is
close to 0.7. In this region, Cu deposition is observed with small aggregates, 1 to 2
μm thick.
A region with higher variations is observed in Fig. 15.c and 15.d. The correlation coefficient
reaches values between 0.2 and 0.3. In this case, the Cu layer completely covers the Fe
surface reaching a layer thickness close to 8
μm.
(a)
(b)
Superconductor
194
These results clearly show that DSP is a technique that can be used to compare the corrosion
rate in different experimental conditions. One of the main advantages is that it is possible to
obtain local information of how the corrosion process evolves in different regions of the
surface.
Fig. 14. (a) Confocal image of the Fe surface (255 x 190
μm
2
) before starting the deposition
process. (b) 2D correlation map obtained in a Fe sample after being immersed in a 0.1 M
Cu(NO
3
)
2
solution for 1 h.
Fig. 15. Comparison of the 2D correlation coefficient map and the surface topography
measured with confocal micrscopy in the line shown in Fig. 14.b.
(b)
(a)
(a)
(b)
(c)
(d)
Application of Optical Techniques in the Characterization of Thermal Stability and
Environmental Degradation in High Temperature Superconductors
195
4.2 Analysis of the environmental degradation process in textured Bi-2212 monoliths
The application of melting techniques to fabricate Bi-2212 monoliths produces a multiphase
material (Mora et al., 2003). The as-grown material is composed of the Bi
2
Sr
2
CuO
6
(Bi-2201)
phase as the main phase and the (Sr,Ca)CuO
2
oxide as the secondary one. After annealing,
the Bi-2212 becomes the predominant phase but some amounts of the Bi-2201 and the
(Sr,Ca)CuO
2
phases remain. These differences in the phase composition can affect the
resistance of these materials to environmental degradation.
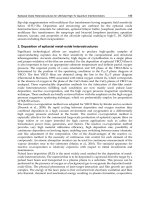
Fig. 16. Bi-2212 coating on a MgO substrate used for environmental degradation
experiments with the sample immersed in water.
Initial tests were performed with the samples immersed in water. Fig. 16 shows an example
of a Bi-2212 coating on a MgO substrate (Mora et al., 2004) where these initial tests were
performed. The sample was machined with meander geometry in order to explore the
possibility of using these materials in resistive fault current limiters (López-Gascón, 2005).
DSP observations are presented in Fig. 17. A magnification of 0.61 was used, and the
observation surface is 15 mm x 10 mm, that covers 5 machined lines. Fig. 17.a shows the
image of the analysed surface. After 10 s, the 2D correlation map shows that some surface
changes have started close to the machined lines (Fig. 17.b). This process evolves as can be
observed in Fig. 17.c where the 2D correlation map after 60 s is presented. It is observed that
in the regions close to the machined lines, the correlation values are lower while in the other
regions, the surface has not degraded.
Immersing the samples in water is not the best procedure because surface degradation
processes are too fast and in these ceramic samples some air bubbles appear on the sample
surface. Thus, the next tests were performed placing the superconducting samples inside a
small chamber with a relative humidity value of a 93% (Recuero et al., 2008). These
experimental conditions were used to compare the resistance of as-grown and annealed
samples to environmental degradation. DSP observations in textured Bi-2212 monoliths
were compared with other complementary characterization techniques: diffuse reflectance
infrared spectroscopy (DRIFT), X-ray diffractometry (XRD) and scanning electron
microscopy (SEM). DSP observations showed that the correlation was lost faster in the as-
grown sample indicating a faster surface degradation.
The (Sr,Ca)CuO
2
grains that are close to the surface decompose to an amorphous phase that
is responsible of the swollen regions that appear in the superconductor surface (Fig. 18).
This modification is responsible of the reduction in the correlation coefficient values. The
amount of this phase is higher in the as-grown samples. For this reason, the observed
reduction in the correlation coefficient value is 3.5 times faster in the as-grown samples than
in the annealed ones. In consequence, the environmental degradation in the as-grown
Superconductor
196
samples is 3.5 times faster. One of the main advantages of the DSP measurements is that
this conclusion can be obtained just 60 s after having started the experiments.
(a) (b) (c)
Fig. 17. (a) Image of the analysed surface. (b) 2D correlation map after 10 s. (c) 2D correlation
map after 60 s.
Fig. 18. SEM micrograph showing the decomposition of the (Sr,Ca)CuO
2
phase due to the
reaction with moisture.
The second advantage of the DSP is that these 2D observations provide information about
how the surface degradation evolves in different regions of the sample. In addition, DSP
measurements allow determining how the degradation process changes with time. If the
reference is taken at an instant t, the correlation maps visualize the changes that have taken
place from this instant.
4.3 Influence of laser ablation machining process in the environmental degradation
resistance of Bi-2212 monoliths
One of the problems associated with the ceramic nature of high temperature
superconductors are the difficulties associated with machining without introducing
mechanical defects in the sample. One of the alternatives is to use laser ablation techniques
(López-Gascón, 2005). This technology allows obtaining samples with different geometries
or to machine meander geometries in the sample (Angurel et al, 2006).
When this machining process is performed with a nanosecond pulsed laser, an amount of
superconductor is melted during the ablation. Fig. 19.a shows that, in the surface of the
machined regions there is a layer of melted material with a thickness of approximately 1
μm.
Application of Optical Techniques in the Characterization of Thermal Stability and
Environmental Degradation in High Temperature Superconductors
197
In consequence, the (Sr,Ca)CuO
2
phase does not reach the surface. If the environmental
degradation is due to the chemical decomposition of this phase, laser ablation can modify
the resistance of these materials to environmental degradation. Another factor related to the
microstructure of these materials is that it is not uniform as the (Sr,Ca)CuO
2
phase is mainly
concentrated close to the sample surface. In order to study these effects several
4 mm x 5 mm rectangles have been machined in 1 cm wide samples (Fig. 19.b). The depth of
these machined regions increases from number 1 to 5: 60, 100, 220, 300 and 480
μm.
Environmental degradation tests for both as-grown and annealed samples have been
performed using the humidity chamber procedure.
Fig. 19. (a) Detail of the surface of a machined region showing the external layer of melted
material. (b) Photograph of a textured Bi-2212 sample showing the machined regions
obtained with laser ablation.
Fig 20 shows the 2D correlation maps measured in the as-grown sample. It can be observed
that the degradation process is slower in all the machined regions. The degradation rate
increases slowly when the machined region depth increases. The behaviour observed in
region 5 is similar to the non-machined regions. In consequence, the laser ablation process
of as-grown Bi-2212 textured materials reduces the chemical interaction with water of the
sample surface, at least in the initial instants.
10 s 20 s 30 s 70 s 100 s
Fig. 20. 2D correlation maps of the as-gown sample with different machined regions at
different instants. The reference corresponds to the surface state at t=0s.
Superconductor
198
This evolution has also been analysed by comparing the time dependence of the correlation
coefficient value of a rectangle of 180 x 140 pixels in each region (Fig. 21). From the slope of
this dependence it is possible to infer that the degradation rate is 2.6 times faster in the non-
machined region than in region 1. But there is another interesting fact. For longer times
degradation in the non-machined region seems to stabilize and it becomes faster in the
machined ones. This can be confirmed looking to the time evolution of the correlation
coefficient (Fig. 21.b) and the 2D correlation maps (Fig. 22) that have been obtained taking as
reference the situation of the sample at t=1800 s.
Fig. 21. Time evolution of the correlation coefficient in the different regions of the as-grown
samples. The reference has been taken at (a) t=0s and at (b) t=1800s.
In the case of the annealed samples, the behaviour is slightly different. Degradation rate in
the machined regions is faster (Fig. 23) than in the non-machined ones. Another difference is
that the behaviour of all the machined regions is much more similar than in the as-grown
samples.
10 s
20 s
30 s
70 s
100 s
Fig. 22. 2D correlation maps of the as-gown sample with different machined regions at
different instants. The reference corresponds to the sample surface at t=1800 s.
(a)
(b)
Application of Optical Techniques in the Characterization of Thermal Stability and
Environmental Degradation in High Temperature Superconductors
199
10s 20s 30s 50s 70s
Fig. 23. 2D correlation maps of the annealed sample with different machined regions at
different instants. The reference is the sample surface at t=0s.
5. Conclusions and future research
These results show that optical techniques are valuable tools to obtain information about the
behaviour of superconducting materials, relevant to the design of different technological
applications. In particular, problems with quench generation and environmental
degradation have been studied.
DSPI can be used to visualize different heat generation processes that take place in
superconducting materials depending on the cooling conditions. It can be used to detect
where a hot spot will take place before damaging the sample. In consequence, it can help to
find out which are the microstructural defects that are more important in heat generation
and propagation. This has been applied in the analysis of bulk Bi-2212 monoliths and 2G
HTS wires. In the case of bulk materials this information can be used to modify the
processing parameters in order to eliminate these defects or to distribute them in the sample
in order to homogenise the transition to the normal state. In the case of 2G HTS wires DSPI
measurements visualize if the sample presents a homogeneous or an inhomogeneous
transition to the normal state. This information has been confirmed with the direct
measurement of the electric field and temperatures profiles. The main advantage is that
DSPI does not require soldering voltage taps or thermocouples in the sample.
One of the objectives for the future research is to obtain quench parameters from the optical
observations. This is not a simple task because the deformations that are observed also
depend on the sample mechanical constraints. For this reason, in order to obtain
quantitative information from these measurements, thermo-mechanical models are being
developed in order to be able of determining the temperature profile from the mechanical
deformation.
DSP has provided useful information about environmental degradation of bulk
superconducting materials. The chemical reactions that take place modify the surface
characteristics and, in consequence, reduce the correlation coefficient values. The main
advantage of this technique in comparison with other experimental techniques is that it
provides 2D local information in the very early stages of the degradation process. In
addition, if the reference image is changed from the initial state to any other at a given time,
Superconductor
200
the evolution of the degradation processes from this instant can be determined. This allows
evaluating how the degradation process rate evolves at any instant.
In the case of the Bi-2212 monoliths, it has been established that the surface degradation is
associated with (Sr,Ca)CuO
2
chemical decomposition. DSP has shown that this process is
faster in the as-grown samples than in the annealed ones. In addition, this optical technique
has also been applied to quantify the change in the degradation rate when the samples are
machined with laser ablation techniques.
6. Acknowledgments
Authors thank the Spanish Ministry of Science and Innovation (Projects MAT-2008-05983-
C03-01 to -03) and the Gobierno de Aragón (Research groups T12, T61 and T76) for financial
support of this research. Authors are also obliged to SuperPower, Inc and, in particular, to
Dr. V. Selvamanickam and Dr. Y Y. Xie for their collaboration in applying these techniques
in 2G HTS wires. Finally authors also thank Prof. G. de la Fuente and Dr. C. López-Gascón
for their collaboration in applying laser ablation techniques in Bi-2212 monoliths.
*Present address: Instituto Tecnológico de Óptica, Color e Imagen (AIDO), Spain
7. References
Andrés, N.; Arroyo, M. P.; Hinrichs, H. & Quintanilla, M. (1999). Digital speckle
interferometry as a full-field fluid-velocity technique. Opt. Lett., Vol. 24, No. 9, 575-
577, ISSN: 0146-9592
Andrés, N.; Arroyo, M. P.; Zahn, H. & Hinrichs, H. (2001). Application of digital speckle
pattern interferometry for fluid velocimetry in wind tunnel flows.
Exp. Fluids, Vol.
30, No. 5, 562-567, ISSN: 0732-4864
Andrés, N.; Recuero, S.; Arroyo, M. P.; Bona, M. T.; Andrés, J. M. & Angurel, L. A. (2008).
Fast visualization of corrosion processes using digital speckle photography.
Corrosion Science, Vol. 50, No. 10, 2965-2971, ISSN: 0010-938X
Angurel, L. A.; Díez, J. C.; De la Fuente, G. F.; Gimeno, F.; Lera, F.; López-Gascón, C.;
Martínez, E.; Mora, M.; Navarro, R.; Sotelo, A.; Andrés, N.; Recuero, S. & Arroyo,
M. P. (2006). Laser technologies applied to the fabrication and characterization of
bulk Bi-2212 superconducting materials for power applications.
Phys. stat. sol. (a),
Vol. 203, No. 11, 2931-2937, ISSN: 0031-8965
Angurel, L. A.; Martínez, E.; Lera, F.; Recuero, S.; Andrés, N.; Arroyo, M. P.; Xie, Y. Y. &
Selvamanickam, V. (2008). Quench detection in YBa
2
Cu
3
O
7-
δ
coated conductors
using interferometric techniques. J. Appl. Phys., Vol. 104, No. 9, 093916, ISSN: 0021-
8979
Angurel, L. A.; Martínez, E.; Lera, F.; Recuero, S.; Andrés, N.; Arroyo, M. P.; Xie, Y. Y. &
Selvamanickam, V. (2009). Analysis of Quench Initiation in YBCO Coated
Conductors Using Optical Interferometric Techniques.
IEEE Trans. Appl. Supercond.,
Vol. 19, No. 3, 3479-3482, ISSN: 1051-8223
Archbold, E. & Ennos, A. E. (1972). Displacement measurement from double-exposure laser
photographs,
Opt. Acta, Vol. 19, No. 4, 253-271, ISSN:0030-3909
Argyropoulou, R.; Ochsenkuhn-Petropoulou, M.; Dounis, C.; Karaboulis, P.; Altzumailis, A.
& Ochsenkuhn K. M. (2007). Comparison of the behaviour of the three
Application of Optical Techniques in the Characterization of Thermal Stability and
Environmental Degradation in High Temperature Superconductors
201
superconductors YBCO, Bi-2212 and MgB
2
in different environmental conditions. J.
Mat. Proc. Technol.
, Vol. 181, No. 1-3, 2-5, ISSN: 0924-0136
Burke, J.; Helmers, H.; Kunze, C. & Wilkens, V. (1998). Speckle intensity and phase
gradients: influence on fringe quality in spatial phase shifting ESPI-systems.
Opt.
Comm.
, Vol. 152, No. 1-3, 144-152, ISSN: 0030-4018
Creath, K. (1985). Phase-Shifting Speckle Interferometry.
App. Opt., Vol. 24, No. 18, 3053-
3058, ISSN: 0003-6935
Fricke-Begemann, T.; Gulker, G.; Hinsch, K. D. & Wolff, K. (1999). Corrosion monitoring
with speckle correlation.
App. Opt., Vol. 38, No. 28, 5948-5955, ISSN: 0003-6935
Fricke-Begemann, T. (2003). Three-dimensional deformation field measurement with digital
speckle correlation.
App. Opt., Vol. 42, No. 34, 6783-6796, ISSN: 003-6935
Goodman, J. W. (1975).
Introduction to Fourier optics, Roberts & Company Publishers, ISBN:0-
07-024254-2
Goodman, J. W (1975). Static properties of laser speckle patterns, in:
Laser Speckle and Related
Phenomena
, J. C. Dainty (Ed.), 9-74, Springer Verlag, ISBN: 0387074988, Berlin
Ishiyama, A.; Tsuchida, M.; Ueda, H. & Shiohara, Y. (2007). Assessment of cryogenic
thermography system using commercial fluorescent paints on their applicability to
visualization of normal-zone propagation in YBCO coated conductors,
IEEE Trans.
Appl. Supercond.,
Vol. 17, No. 2, 3765-3768, ISSN: 1051-8223
Jones, R. & Wykes, C. (1989). Holographic and Speckle Interferometry, Cambridge University
Press, ISBN: 0-521-34878-1
Lee, H.; Kim, H. M.; Jankowski, J. & Iwasa, Y. (2004). Detection of “hot spots” in HTS coils
and test samples with acoustic emission signals.
IEEE Trans. Appl. Supercond., Vol.
14, No. 2, 1298-1301, ISSN: 1051-8223
Lera, F.; Angurel, L. A.; Rojo, J. A.; Mora, M.; Recuero, S.; Arroyo, M. P. & Andrés, N. (2005).
Microstructure origin of hot spots in textured laser zone melting Bi-2212 monoliths.
Supercond. Sci. Technol., Vol. 18, No. 11, 1489-1495, ISSN: 0953-2048
Lobera, J.; Andrés, N. & Arroyo, M. P. (2004). From ESPI to Digital Image Plane Holography
(DIPH): Requirements, possibilities and limitations for velocity measurements in a
3-D region, in:
Particle image velocimetry: Recent improvements, Stanislas, M.;
Westerweel, J. & Kompenhans, J. (Ed.), 363-372, Springer-Verlag, ISBN: 3-540-
21423-2, Berlin
López-Gascón, C. (2005).
Procesado y mecanizado de cerámicas superconductoras de Bi-2212 con
técnicas láser
. PhD Thesis, University of Zaragoza, Spain
Martínez, E.; Angurel, L. A.; Pelegrín, J.; Xie, Y Y. & Selvamanickam, V. (2010). Thermal
stability analysis of YBCO-coated conductors subject to over-currents.
Supercond.
Sci. Tecnol.
, Vol. 23, No. 2, 025011, ISSN: 0953-2048
Mora, M.; Díez, J. C.; López-Gascón, C. I.; Martínez, E. & De la Fuente, G. F. (2003). Laser
textured Bi-2212 in planar geometries.
IEEE Trans. Appl. Supercond., Vol. 13, No. 2,
3188-3191, ISSN: 1051-8223
Mora, M.; Gimeno, F.; Angurel, L. A. & de la Fuente, G. F. (2004). Laser zone melted
Bi
2
Sr
2
CaCu
2
O
8+
δ
thick films on (100) MgO substrate. Supercond. Sci. Technol., Vol. 17,
No. 10, 1133-1138, ISSN: 0953-2048
Rastogi, P. K. (2001).
Digital Speckle-Pattern Interferometry and related techniques. Willey, ISBN:
978-0-471-49052-4, Chichester, UK
Superconductor
202
Recuero, S.; Andrés, N.; Arroyo, M. P.; Lera, F. & Angurel, L. A. (2005). Superconductor
ceramics behaviour analyses during service by speckle metrology,
Proceedings of the
Society of Photo-Optical Instrumentation Engineers (SPIE)
, 5856, 775-785, ISBN: 0-8194-
5856-2, Munich, June 2005, SPIE-International Society of Optical Engineering,
Bellingham, USA.
Recuero, S.; Andrés, N.; Lobera, J.; Arroyo, M. P.; Angurel, L. A. & Lera, F. (2005).
Application of DSPI to detect inhomogeneous heating on superconducting
ceramics.
Meas. Sci. Technol., Vol. 16, No. 4, 1030-1036, ISSN: 0957-0233
Recuero, S.; Bona, M. T.; Andrés, N.; Andrés, J. M. & Angurel, L. A. (2008). Visualization of
environmental degradation in ceramic superconductors using digital speckle
photography.
Jour. Eur. Ceram., Vol. 28, No. 11, 2239-2246, ISSN: 0955-2219
Song, H. H.; Davidson, M. W. & Schwartz, J. (2009). Dynamic magneto-optical imaging of
transport current redistribution and normal zone propagation in YBa
2
Cu
3
O
7-
δ
coated conductor.
Supercond. Sci. Technol., Vol. 22, No. 6, 062001, ISSN: 0953-2048
Takeda, M.; Ina, H. & Kobayashi, S. (1982). Fourier-transform method of fringe-pattern
analysis for computer based topography and interferometry. J. Opt Soc. Am., Vol.
72, No. 1, 156-160, ISSN: 0030-3941
Vest, C.M. (1979).
Holographic Interferometry. John Willey and Sons, ISBN: 0471906832, New
York.
Wang, X.; Trociewitz, U. P. & Schwartz, J. (2007). Near-adiabatic experiments on short
YBa
2
Cu
3
O
7-
δ
coated conductors. J. Appl. Phys., Vol. 101, No. 5, 053904, ISSN: 0021-
8979
Yamaguchi, I.; Kobayashi, K. & Yaroslavsky, L. (2004). Measurement of surface roughness
by speckle correlation.
Opt. Eng., Vol. 43, No. 11, 2753-2761, ISSN: 0091-3286
10
Nanoscale Pinning in the LRE-123
System - the Way to Applications up to
Liquid Oxygen Temperature and
High Magnetic Fields
Muralidhar Miryala
1
, Milos Jirsa
2
and Masaru Tomita
1
1
Railway Technical Research Institute (RTRI), Applied Superconductivity, Materials
Technology Division, 2-8-38, Hikari-cho, Kokubuni-shi, Tokyo 185-8540
2
Institute of Physics, ASCR, CZ-182 21 Praha 8
1
Japan
2
Czech Republic
1. Introduction
The discovery of superconductivity in oxides (Bednorz, et al., 1986), especially in the system
of YBa
2
Cu
3
O
y
“Y-123” (Wu et al., 1987), having a transition temperature well above boiling
point of liquid nitrogen and capable of carrying critical current densities at a level necessary
for practical use, moreover in rather high magnetic fields, placed cuprate composites into
center of the present material physics and technology. Liquid nitrogen cooling has promised
construction of cryogenic systems greatly simplified, more realistic and economical in
operation. Note that not only the critical temperatures of the new superconductors have
been much higher than those of the conventional materials. The upper critical field of the
order of 100 T has been estimated and also measured, making from these materials ideal
candidates for high field applications (Welp et al., 1989). On the other hand, it has also been
found that high-T
c
materials in a polycrystalline form carry only low critical current
densities, due to grain boundary weak links and crystal anisotropy (Cava et al., 1987).
Attempts to improve the critical current density of the Y-123 material by texturing
substrates and identifying coupling mechanisms at interface started immediately world-
wide (Jin et al., 1988; Babcock et al., 1990). U.S. Pat. No. 5,061,682, issued to Aksay et al., 1991
disclosed a process for preparing conductive and superconductive ceramics composed of
Y
2
BaCuO
5
, YBa
2
Cu
3
O
7
, and YBa
2
Cu
4
O
8
. The most successful process at present is melt-
texturing, which controls to a high degree lattice orientation of the crystalline material. In
this way the superconducting phase (YBa
2
Cu
3
O
x
) is formed by a peritectic reaction of
Y
2
BaCuO
5
(211) with a liquid phase. The growth process of the superconducting phase is
accelerated by means of finely and homogeneously dispersed 211 phase in the liquid phase;
at the same time, however, the 211 phase serves as a pinning medium dispersed in the
superconducting phase. During the following slow cooling nucleation often occurs. This
secondary nucleation forms parasitic grains that consume the material intended for the
growth of superconducting grains. In this way high-angle grain boundaries are created that
Superconductor
204
reduce the current conducting efficiency of the polycrystalline material. The conventional
procedure for fabricating a good quality 123-phase material was reported by the SRL group
(Murakami et al., 1995). The material was produced by melting the raw materials for an
oxide superconductor of REBaCuO, solidifying the melt, pulverizing the solidified material,
and adding Pt or PtBa
4
Cu
2
O
y
to the powder, molding the mixture to a predetermined shape,
and again heating the mixture to grow a superconducting phase. The process in which the
211 phase and the platinum compound were finely dispersed in the 123 crystal was
patented as U.S Pat. No. 5,395,820 (Murakami et al., 1995).
By adding silver or silver oxide to the powder in this process, and preparing the precursor
containing silver or a silver oxide finely dispersed therein (Vipulanandan & Salib, 1994)
mechanical performance can be dramatically improved. Fabrication of single-grain Y-123
superconductors was reported in U.S. Pat. No. 6,046,139; Blohowiak et al., 2000. In the
method, 1–25 wt % of 211 YBCO, 0.05–1.0 wt % Pt, and a balance of YBa
2
Cu
3
O
7-x
(123 YBCO
material) were combined. Pt is believed to limit growth of non-superconducting 211-phase
crystallites. The mixed precursor powder was pressed into the form of a compact disk or
other forms. A seed crystal NdBa
2
Cu
3
O
7-x
or SmBa
2
Cu
3
O
7-x
was placed onto the top surface,
parallel to it. The compact was heated to a maximum temperature around 1050° C and held
at that temperature for a time sufficient to fuse the seed crystal to the compact surface. The
temperature was then lowered at the rate of approximately 0.1–1.0° C per hour. As the
materials cooled, growth of the 123 YBCO grain started at the seed crystal. After nucleation,
the compound was cooled at the rate of about 1–10° C per hour to a temperature of
approximately 950° C. The Y-123 grain growth spread from the nucleation site until the
entire pellet transformed into a single 123 YBCO grain. Using a similar approach and
controlling the processing conditions and cooling rate, one can produce good-quality large
single-grain YBCO pellets. In these processes the initial constitution of the starting
composition resides on a "123-211 tie line" of a ternary phase diagram while keeping a
sufficient but not excessive mass balance to yield a superconductive phase (123 phase) and
to cause micro-dispersion of the 211 phase (in cases of Y, Sm, etc.) or the 422 phase (in cases
of Nd, La, etc.), functioning as magnetic flux pinning centers in the superconductive phase.
It increases critical current density, J
c
, and at the same time keeps mass balance to minimize
a residue of unreacted Cu, Ba, etc. As a result, such melt-grown Y-123 samples trap
magnetic field much higher than that supplied by best nowadays known hard magnetics
(Tomita & Murakami, 2003). The enormous effort in research and development has led to
growing large single crystal grains of the 123 phase with spread the fine RE-211 phase in the
matrix and significantly improved critical current density for super-magnet applications. On
the other hand, it was found that the high J
c
due to fine RE-211 phase appeared at low
magnetic fields and decreased as the field increased (Salama et al., 1994; Cardwell et al.,
1998).
In parallel to the YBCO system, the LRE-123 analogues (LRE=Nd, Sm, Eu, Gd) have been
extensively studied. In these superconductors the rare earth elements partially substitute for
Ba and vice versa (Yoo et al., 1994). Without control, an excess of such defects can
deteriorate superconducting properties of such a compound. E.g. the early NdBa
2
Cu
3
O
y
melt-textured blocks prepared in air exhibited a lower T
c
than Y-123 bulks. It was found,
however, that melt growth proceeded in a reduced partial pressure of oxygen reduced the
mutual substitution of LRE and Ba ions and such materials were found to exhibit T
c
even
higher than that of Y-123 (Murakami et al., 1996). Moreover, the compositional fluctuation
Nanoscale Pinning in the LRE-123 System -
the Way to Applications up to Liquid Oxygen Temperature and High Magnetic Fields
205
on nm scale in such LRE-123 materials had a similar positive effect on the secondary peak of
J
c
(B) as oxygen vacancies in YBCO (Egi et al., 1995; Ting et al., 1997). This fluctuation
originated in solid solution of LRE atoms with Ba “LRE-123ss” (Osabe et al., 2000). In order
to regulate the complex melt growth process in LRE-123 compounds, leading in general also
to T
c
reduction and superconducting transition broadening, a melt growth in a reduced
oxygen atmosphere has been developed and optimized. In this process, the melt texturing
process was decoupled from oxygenation, which enabled an independent control of both
steps. The former could be optimized with respect to the LRE-123ss cluster concentration
and the associated secondary peak (fishtail effect) enhancement (Pradhan et al., 2001), the
latter with respect to the highest T
c
. The oxygen-controlled-melt-grown (OCMG) LRE-123
materials reach typically 94-96 K with superconducting transition width below 1 K and
exhibit a well developed secondary peak (Yoo et al., 1994). Materials with a slight excess of
LRE or Ba can be produced but also materials with macroscopically stoichiometric
composition but with composition fluctuation on a nanometer scale, in all the cases with the
same positive effect on the electromagnetic performance.
The next breakthrough came with ternary (LRE
1
,LRE
2
,LRE
3
)Ba
2
Cu
3
O
y
. Combination of three
light rare earth elements in the elementary cell provides an exceptional technological
freedom that enables a fine variation in the inter-atomic exchange within the elementary cell
and, consequently, a control of a variety of physical characteristics of the final product
(Muralidhar et al., 1998). The OCMG processed (Nd,Eu,Gd)Ba
2
Cu
3
O
y
“NEG-123” system
proved that mixture of three different elements is possible, without any deterioration of the
electromagnetic performance (Muralidhar et al., 2000 patent). Moreover, a control of the Nd:
Eu: Gd ratio in the NEG-123 matrix enabled tailoring the pinning performance according to
the requirements of the specific use (Muralidhar & Murakami, 2000). One can produce
materials with a high narrow secondary peak of J
c
(B) at moderate fields or with a rather
broad moderate peak with maximum at fields as high as 4 T (77 K) (Muralidhar et al., 2001).
In a certain range of the Nd:Eu:Gd ratio, a nano-scale variation in the NEG-123 matrix
composition appeared, correlated with the ordinary twin boundary structure. It enhanced
vortex pinning in exceptionally high fields, around 10 T at 77 K and lead to shifting the
irreversibility field at 77 K up to 15 T (Muralidhar et al., 2002a; Muralidhar et al., 2003a). As
in YBCO, also here externally added secondary phase particles enhance critical current
density at low magnetic fields (Diko et al., 2000). Gd
2
BaCuO
5
“Gd-211” proved to form the
smallest particles of all other LRE secondary phases and became a standard addition in the
LRE composites. The efficiency of the secondary phase precipitates is inversely proportional
to their size. With the aim to further improve the low-field pinning performance, we
reduced the initial size of the secondary phase particles. (Muralidhar et al., 2002b;
Muralidhar et al., 2003b). The refinement of Gd-211 particles from the commercial size of
about 3 μm to several tens of nm was done by ball-milling with Y
2
O
3
– ZrO
2
balls. With the
help of these ball-milled nanoparticles a new type of nano-scale Zr-rich NEG-Ba-Cu-O
precipitates appeared in the final product, accompanied by an exceptional pinning
enhancement in all high temperatures, up to vicinity of T
c
. As a result, this material showed
very high critical current density at 90.2 K, the boiling temperature of liquid oxygen
(Muralidhar et al., 2003c). With this material we could levitate a permanent magnet at 90.2
K. As a result, a remarkable flux trapping, by order of magnitude higher than the best
classical hard magnets, was achieved. These new materials can be utilized as a new class of
high temperature superconducting super-magnets for a wide range of commercial and
industrial applications (Jirsa & Muralidhar, 2004; Muralidhar et al., 2004a).
Superconductor
206
The present review focuses on the latest development in the field of mixed ternary LRE-123
systems. We report the results of microstructure and magnetization analyses of ternary LRE-
123 compounds. Flux pinning and size effect of the initially added nanometer-sized Gd-211
and Zr-, Ti-, Mo-, and Nb-based particles is reviewed and discussed, especially from the
viewpoint of applications of superconducting permanent magnets usable up to vicinity of T
c
(liquid oxygen refrigeration).
2. Flux pinning in ternary LREBa
2
Cu
3
O
y
materials
Critical currents in superconductors usually rapidly decrease with increasing magnetic field.
This feature, expressed e.g. by the Kim’s empirical formula J
c
(B)=A/(B+B
0
), is one of the
main obstacles for sharing superconducting applications. In bulk high-T
c
superconductors
the fishtail effect represents some sort of exception from this rule, valid in intermediate
fields. However, above the fishtail peak position, the J
c
(B) decay is even faster than that
predicted by Kim. One can thus generalize and state that in high magnetic fields critical
currents in high-T
c
superconductors vary rapidly decay with increasing field. There are
several factors contributing to this situation: (i) high-T
c
superconductors are strong type II
superconductors. The Ginsburg-Landau factor κ=λ/ξ, where ξ is the coherence length and λ
is the magnetic penetration depth, is very high, in the range of 100. Vortex core diameter,
being in HTSCs in the range of a few nm, is very small. The defects interacting with such
tiny vortex cores have to be of an equal or even smaller size. The corresponding pinning and
activation energies are then extremely low; (ii) the high critical temperatures encountered in
these materials enable operation at rather high temperatures at which thermal activation is
very high. Together with the low mean activation energy it leads to a fast vortex release
from the pinning sites and so called giant magnetic relaxation. This effect is manifested by
the existence of an irreversibility line B
irr
(T) above which the superconductor can no more
hold a reasonable internal magnetic field gradient and carry critical current associated with
this gradient. In contrast to the classical metallic type-II superconductors, in HTSCs
B
irr
<<B
c2;
(iii) high-T
c
superconductors are layered structures composed of superconducting
and non-superconducting planes. Therefore, the materials are highly anisotropic and the
flux lines are more or less stacks of freely joined pancake vortices. Such objects are very
flexible and elastic, which complicates modeling of vortex-defect interaction. The activation
energies, enabling a vortex release from a defect, are here very low, especially, if the
pancakes correlation becomes rather weak or if the vortex matter gets liquid of individual
pancakes or their short segments.
For more than 20 years it has been a major practical objective to increase efficiency of
pinning centers in high-T
c
superconductors by a careful control of microstructure. An
important aspect was to bring the pinning defects size up to nanoscale level, close to the
material’s coherence length (4.5 nm in YBCO at 77 K and similar in all LRE-123 compounds).
Recently, this goal was realized in the ternary NEG-123 system produced by means of the
OCMG process (Muralidhar et al., 2002c; Awaji et al., 2004). A further tuning of the
nanoscale secondary phase particles with Zr, Mo, Ti, Nb additives enhanced flux pinning of
these materials more than 3 times compared to a single-LRE 123 materials (Muralidhar et al.,
2008a; Muralidhar et al., 2008b; Muralidhar et al., 2009). These results are systematically
described below in respect of microstructure and flux pinning performance.
Nanoscale Pinning in the LRE-123 System -
the Way to Applications up to Liquid Oxygen Temperature and High Magnetic Fields
207
3. Second-phase inclusions and the associated flux pinning in NEG-123
In the melt growth process the RE-123 domain growth advances with a peritectic
recombination of the RE-211 particles and the liquid phase (Ba- and Cu-rich). The rare earth
ions needed for the 123 phase growth are supplied from RE-211 particles dispersed in the
liquid. Moreover, as an optimum, 20-40 mol% of an additional secondary phase is usually
added to the 123 powders before melt processing. These extra particles are partly utilized in
the liquid phase for growth of the 123 matrix, partly are trapped in the RE-123 matrix (see
Fig.1).
According to some models the interface between the RE-123/RE-211 is a good pinning
medium.
Fig. 1. Scanning electron micrographs of the NEG-123 + 30 mol% (left figure) & 40 mol%
(right figure) Gd-211 composite prepared under 1% partial pressure of O
2
. Note the uniform
dispersion of fine 211 inclusions in the NEG-123 matrix.
In such models the critical current density increases with the V
211
/d
211
ratio, where V
211
is
the RE-211 volume fraction and d
211
is the average size of the RE-211 particles (Murakami
1991), Sandiumenge et al., 1997). According to another model, this dependence is V
211
/√d
211
.
(Zablotskii 2002). In both cases, the particle size decrease leads to a J
c
enhancement.
In the mixed LRE-123 systems one can control the size, homogeneity, and dispersion of the
Gd-211 particles (see Fig. 2). As the formation temperature of Gd-123 is lowest among the
four LRE-123, the small Gd-211 particles cannot be consumed for the growth of Gd-123 and
thus have a chance to survive (see Fig. 2). As a result, the critical current density of the
samples with Gd-211 shows a remarkable J
c
-B performance as compared to the “classical”
melt-processed Y-123 or LRE-123 (LRE: Nd, Sm, Eu, Gd) systems without additional
secondary phase. The OCMG-processed Nd-123 presents a well-developed peak effect.
However, an extremely good pinning performance can be seen in the melt-processed
(Nd,Eu,Gd)-123 “NEG-123” with 40 mol% NEG-211 or 30 mol% Gd-211 (see Fig. 3). The
microstructure observations along with a compositional analysis showed that the extremely
fine NEG-211 particles contain only Gd on the rare earth site. These particles therefore
represent the effective flux pinning centers. The samples exhibit a pronounced secondary
peak effect in the magnetization loops. A further improvement of the NEG-123 flux pinning
was possible by an intentional size reduction of the initial Gd-211 particles to nanometer
scale.
Superconductor
208
Fig. 2. Transmission electron micrograph of NEG123 with 30 mol% NEG-211 and 0.5 mol%
Pt. Note the fine 211 inclusions dispersed in the matrix, which mainly comprise Gd in the
rare earth site.
0
20
40
60
80
100
01234567
YBCO
NdBCO
NEG-pure
NEG+40% NEG-211
NEG+10% NEG-211
NEG+30% Gd-211
H (T)
μ
0
Fig. 3. Comparison of the field dependences of critical current density (T = 77 K, H
a
parallel
to the c axis) for melt-processed YBCO, OCMG-processed Nd-123, (Nd,Eu,Gd)-123 with 0
mol%, 10 mol%, and 40 mol% additions of NEG-211, and 30 mol% addition of Gd-211.
4. Nanometer-sized second-phase inclusions in NEG-123
Further improvement in flux pinning was obtained in NEG-123 system with a gradually
reduced starting size of the Gd
2
BaCuO
5
particles. The Gd- 211 powder was milled using Y
2
O
3
– ZrO
3
balls in acetone, for 0.3, 2, and 4 h. The size was estimated by Brunauer-Emmerit-
Teller (BET) specific area measurements (Brunauer et al., 1938). 30 and 40 mol% of the ball-
milled Gd-211 were added to the sintered NEG-123. For coarsening suppression of the Gd-
Nanoscale Pinning in the LRE-123 System -
the Way to Applications up to Liquid Oxygen Temperature and High Magnetic Fields
209
211 particles during melt processing, 0.5 mol% Pt and 1 mol% CeO
2
were added. The pellets
were grown by OCMG process in Ar with 1% O
2
. The starting average particle size was 200
nm, 100 nm, and 70 nm, in dependence of ball-milling time 0.3 h, 2 h, and 4 h, respectively.
The J
c
(H) dependencies of both types of NEG-123 samples with 30 and 40 mol% of
differently sized Gd-211 particles are shown in Fig. 4. For comparison also a sample with
commercial Gd-211 powders "CP" (< 3 μm) was measured. All measurements were
performed at 77.3 K and H//c-axis. A clear increase of remnant J
c
with decreasing size of the
particles is visible. Remarkable is the record value of the remnant J
c
, 140 kA/cm
2
, reached in
the sample with 30 mol% of Gd-211, with the average starting particle size of 70 nm. The
same particle size dependence was observed in the composite with 40 mol% Gd-211
(squares in the figure), where the remnant J
c
value for the average starting particle size of 70
nm reached even 192 kA/cm
2
and 110 kA/cm
2
at remnant state and 3 Tesla, respectively.
This result is by more than 60% better than the previous record values of NEG-123 and other
RE-123 materials. Simultaneously with the enhancement of the low-field pinning also the
super-current density at intermediate fields significantly increased in both materials with
decreasing secondary phase particle size. This might be an indication of an overlapping of
the “large” particle pinning mechanism with the individual vortex pinning regime on point-
like defects. However, the 70 nm particles seem to be rather large to significantly contribute
to single-vortex pinning regime. Microstructure and chemical analyses enlightened the
problem. DFM test of the sample with 30 mol% Gd-211 (starting size 70 nm) brought an
evidence of the final particle size dispersion between 20 and 50 nm. Such small secondary
phase particles have not been observed before in any RE-123 material. Figure 5 shows the
TEM micrographs of this sample. Two types of nanoparticles can be seen: large irregular
inclusions of about 300 to 500 nm in size and round particles of 20-50 nm in diameter. The
quantitative analysis by TEM-EDX clarified that the former ones were Gd-211 and Gd-rich
NEG-211 particles. Both types were evidently created or at least strongly modified during
the melting process. The small 211 inclusions had a clear link to a long-term ball-milling.
0
40
80
120
160
01234567
CP 3 m
200 nm
100 nm
70 nm
J
c
(kA cm
-2
)
H (T)
μ
0
μ
0
50
100
150
200
01234567
J
c
(kA cm
-2
)
μ
0
H (T)
Fig. 4. Field dependence of super-current density for (Nd,Eu,Gd)Ba
2
Cu
3
O
y
samples with 30
mol% and 40 mol% Gd-211 (squares) refined by ball-milling for 0.3, 2, and 4 h (200 nm, 100
nm, and 70 nm). "CP" represents the commercial Gd-211 powders (≈3μm). All the samples
were measured at T = 77 K with H||c-axis. The current density increased in the whole field
range with decreasing particle size. Record critical current densities of 192 and 110 kA/cm
2
were achieved at 0 and 3 Tesla, respectively.
Superconductor
210
Fig. 5. Transmission electron micrographs of (Nd,Eu,Gd)Ba
2
Cu
3
O
y
samples with 30 mol%
Gd-211 (average particle size was 70 nm); Insets show the new Zr-rich pinning medium in a
higher magnification.
These defects, denoted as A1 - A4, are marked in figure 5 by arrows. Chemical analysis of
nanoparticles with different sizes and shapes was made by energy dispersive spectroscopy
(EDS) in scanning transmission electron microscopy (STEM) mode. Each analyzed spot had
diameter of 2-3 nm. More than 65 nanoparticles were analyzed. We found that particles of
size below 50 nm contained a significant amount of Zr. The four nanoparticles (A1 - A4)
possessed different elemental ratios, always with a significant amount of Zr. A similar
feature was observed in different parts of the sample. As no Zr was intentionally introduced
into the system, we learned that the Gd-211 powder was contaminated with Zr from the
balls used for milling. To estimate the Zr content in the Gd-211 particles, we made very
precise quantitative analysis by inductively coupled plasma spectroscopy (ICP model: SPS-
1700HVR). An average content of Zr was found to be 0.23 wt% for 4 hours ball-milled Gd-
211 powders. Chemical composition of the particles represents a new, Zr-rich compound
close to Gd-211, with yet not fully clear chemical structure.
The average size 20 – 70 nm sets these pins between point-like and “large” particles. This
implies a potential of these defects to enhance material pinning in both low and
intermediate fields. In comparison with another method capable of producing comparably
sized artificial defects, namely fast neutron irradiation (Umezawa et al., 1997), the present
technology is quite simple and can be easily adapted for mass production. Therefore, the
new type of pins represents a unique economically feasible way how to enhance pinning in
low and intermediate fields. This is particularly important for the applications using liquid
nitrogen cooling. Note that J
c
at 77 K and 3 Tesla is by about one order of magnitude higher
than in high quality Nd-123 samples.
Another important consequence of the effective pinning by the new type of defects is the
shift of the operating temperature from liquid nitrogen (77.2 K) to liquid oxygen (90.3 K).
Nanoscale Pinning in the LRE-123 System -
the Way to Applications up to Liquid Oxygen Temperature and High Magnetic Fields
211
For the first time the super-current density at 90 K was high enough to successfully levitate
permanent magnet under liquid oxygen cooling (Muralidhar et al., 2003c).
5. Trapped magnetic field in RE-123 bulk superconductors
A strong electromagnetic suspension force can be generated by interaction of the melt-
processed ternary RE-123 bulk superconductor with the stray magnetic field of a strong
permanent magnet. This effect is applicable e.g. to construction of a practically lossless
magnetic bearing, a contact-less liquid pump or a superconducting flywheel. The latter
system has a wide range of applications, like position stabilizer, electric power storage, a
high capacity, high current “fast” electric “battery”, unit absorbing and compensating
voltage fluctuations at solar-cell or wind power plants etc.
When the superconducting pellet is magnetized to a high magnetic field, part of this field is
trapped in the pellet and we get a superconducting permanent magnet or, shortly, super-
magnet. Such a name is fully justified as high-Tc superconductors can trap magnetic field by
order of magnitude higher than the best hard ferromagnets nowadays known. The major
problem to solve is that the material is a ceramic, though in the state of pseudo single
crystal. It is difficult in practice to prevent generation of micro-cracks and micro-pores
during the melt processing. The micro-cracks are formed especially during the oxygenation
process when a transformation from tetragonal to orthorhombic phase takes place,
accompanied by significant atom displacements and stresses. As a result, the c-axis shrinks
and b-axis is prolonged with respect to the a-axis. As the main atom displacement takes
place within the a-b plane, most cracks lie just in the plane. Some, however, are also
transversal to the current flow and hinder its flow. In any case, the mechanical properties
are rather poor. To improve the mechanical performance of the materials, (i) addition of 20-
30 wt% silver can help, when silver atoms prevent cracks proliferation, as well as (ii)
reinforcement of the sample with metal ring, (iii) resin impregnation in vacuum when resin
fills the pores and cracks, or (iv) resin impregnation with wrapping the material in carbon
fiber. All these procedures greatly improve mechanical performance of the material. As a
result, a trapped field of 14.35 T was recorded at 22.5 K (Fuchs et al., 2009). However, the
samples are cracked also during the experiment, from a strong mechanical impact, thermal
impact due to sudden temperature variation, a large electromagnetic force. The stress is then
concentrated just in the aforesaid micro-cracks, which become a starting point of a
progressive cracking of the whole sample. To overcome this problem, Tomita et al. 2003
impregnated the melt processed YBCO sample with Bi-Pb-Sn-Cd alloy along with the epoxy
resin impregnation. The alloy has a high thermal conductivity at low temperatures (at 29 K)
and its thermal expansion coefficient is close to the YBCO disk. To improve the thermal
conductivity of the interior region of the disk, 1 mm in diameter bores were mechanically
drilled in the center of the sample and filled with 0.9 mm diameter Al wires fixed by the Bi-
Pb-Sn-Cd alloy. As a result, the trapped field of 9.5 T at 46 K, and 1.2 T for 78K was recoded.
Until now valid record of 17.24 T was achieved at 29K, that all between two 2.65 cm in
diameter discs, all without fracturing. These results opened the way to a new class of
compact super magnets for various industrial applications. Note that the above experiment
was done with a specially treated YBCO bulk. In the case of NEG-123 the pinning effect is
considerably higher than in YBCO, both due to the LRE/Ba substitution and the capability
of these materials to incorporate a rich network of various types of nanoparticles. According
to resent reports, these bulk superconductors can trap magnetic field of about 1T at liquid
nitrogen temperature (77 K) and several tens of Tesla even at liquid oxygen temperature
Superconductor
212
(90.2 K). The present refrigeration technique enables, however, operation at considerably
lower temperatures, where the critical current and thus also the trapped field rapidly grow.
Thus, in comparison to YBCO, the LRE super-magnets can trap comparable fields at much
higher temperatures or at the same temperatures in pellets of much smaller diameter (the
trapped field magnitude is also proportional to the pellet diameter). This opens a new class
of applications, especially for space programs and medicine.
6. Flux pinning in NEG-123 due to TiO
2
nanoparticles
One should note that in these early NEG-123 materials with high pinning at high
temperatures (in the range above 80 K) only the remnant critical current density was high
but rather rapidly decayed with increasing magnetic field. It was desirable to extend the
range of high critical current densities at high temperatures to higher magnetic fields. As the
nanoparticles contaminated by Zr during ball milling appeared so effective, we also tried to
introduce and to study the pinning effect of ZrO
2
(Muralidhar et al., 2004c) and other oxides
of refractory metals from vicinity of Zr in the periodic table of elements. First, we tried to
dope the material with TiO
2
nanoparticles. In accord with our expectations, nanometer-sized
defects appeared in the final product of this kind, correlated with a significantly improved
flux pining at low and medium magnetic fields. This effect was particularly significant at
high temperatures. To characterize the superconducting transition of the NEG-123 samples
with various contents of Ti, the temperature dependence of the dc magnetic moment was
first measured (Fig. 6). The zero-field-cooled (ZFC) and field-cooled (FC) curves were
measured in magnetic field of 1 mT. All studied compositions exhibited a sharp
superconducting transition (around 1 K wide) with the onset T
c
around 93 K. The onset T
c
slightly decreased from 93.2 K to 92 K with increasing Ti content. This showed that the small
quantities of Ti studied in this work only slightly affected the superconducting performance
of the NEG-123 material. Several previous reports have dealt with the TiO
2
doping. It was
found that the increasing content of TiO
2
from 1% to 5% in a flame-quench-melt-grown
(FQMG) YBa
2
Cu
3
O
7−δ
bulk caused a decrease of superconducting transition temperature,
while in the range from 7 to 10 wt.% T
c
slightly recovered again (Yanmaz et al., 2002). In the
YBa
2
(Cu
3-x
Ti
x
)O
y
specimens, T
c
of about 80 K was observed for 0≤x≤0.9 (Okura et al., 1988).
Fig. 6. Temperature dependence of the normalized DC susceptibility of the OCMG-
processed NEG-123 + 35 mol% Gd-211 (70 nm) with varying content of TiO
2
.
Nanoscale Pinning in the LRE-123 System -
the Way to Applications up to Liquid Oxygen Temperature and High Magnetic Fields
213
Venkataramani et al., 1988 found T
c
significantly dropping with increasing x in
Y
1-x
Ti
x
Ba
2
Cu
3
O
7−δ
(x=0.05 and 0.1), which they attributed to a site preference
(Venkataramani et al., 1988). In the DyBa
2
(Cu
1−x
Ti
x
)
3
O
7−z
system the observed decrease of T
c
with increasing Ti doping was attributed to the hole-filling mechanism (Mavani et al., 2004).
In all above-mentioned cases the Ti doping was high compared to the present work. It is
clear that the optimum content of Ti cannot depress T
c
of the investigated RE-123 system.
In the present case small amounts of nanometer-sized TiO
2
(≤0.35 mol%) were added to the
NEG-123 samples in order to improve the current-carrying capacity of the material, in
particular around liquid nitrogen boiling point or at higher temperatures. Figure 7 presents
the critical current densities at 77 K of the 0-0.35 mol% TiO
2
-added NEG-123 composites
magnetized parallel to the c-axis. It is evident that the self -field critical current increased for
0.1 mol% of TiO
2
as compared to the pure NEG-123 and reached at 77 K 320 kA/cm
2
. The
high-field critical current density, J
c
, and the irreversibility field, H
irr
, decreased with further
increase of TiO
2
content (≥0.2 mol% of TiO
2
). These results proved that the optimum amount
of TiO
2
in the NEG-123 system was around 0.1 mol%.
Ti is a 3d transition metal that can be accommodated at Cu sites in the RE-123 system due to
the similar ionic radius with Cu. The drop of T
c
in the Dy-123 system doped by Ti was in one
previous study interpreted so that Ti ions maintain their +4 normal valence state as in the
starting TiO
2
(Mavani et al., 2004). Vankataramani et al., 1988 found only a slight effect of Ti-
substitution. They argued that the T
c
dependence on Ti substitution is slower than that arising
from oxygen vacancies in the Cu(1)-O chains. The behavior of the system up to 10% of Ti did
not change much and correlated much more with the concentration of the second phase when
Ti was substituted for yttrium. It could mean that Ti actually did not occupy the Y-sites but the
Cu- ones. On the other hand, a low Zn substitution for Cu in the Y-123 system (Krabbes et al.,
2000) or Fe, Co, or Ni substitutions for Cu in Bi-2212 single crystals were found to enhance J
c
(Shigemori et al., 2004). These results showed that a direct doping in superconducting CuO
2
planes is an effective method for introducing point-like pinning sites in cuprate
Fig. 7. Field dependence of the super-current density in NEG-123 samples with the same, 35
mol% content of Gd-211 (70 nm) but various contents of TiO
2
. All the samples were
measured at T = 77 K with H||c-axis. The current density increased in the whole field range
up to the 0.1 mol% content of TiO
2
and decreased thereafter. Note the relatively high critical
current density of 320 kA/cm
2
at self-field and 77 K, achieved with 0.1 mol% TiO
2
.
Superconductor
214
superconductors provided the doping levels stay low. Such a dilute doping technique is
particularly effective when the mean distance between the impurity ions is much longer than
the coherence length in the a-b plane (Shimoyama et al., 2005). The present results indicate that
an optimum “dilute” content of Ti enhances flux pinning of the NEG-123 material.
To find more about the pinning effect of Ti nanoparticles in NEG-123, we examined the
microstructure of the samples in detail using the high resolution transmission electron
microscopy (HRTEM). Figure 8 shows the typical TEM images of 0.1 mol% of TiO
2
-added
NEG-123 viewed from the <001> direction. In the images, two types of defects could be
distinguished: large irregular inclusions of about 200 to 500 nm in size, and round particles
of 20-50 nm size. The energy-dispersive x-ray (EDX) spectra of the larger particles identified
them as a Gd-rich NEG-211 secondary phase, spontaneously created by peritectic
decomposition of LRE-123 in the partial-melted region during the melt-texturing process.
On the other hand, the small round particles of 20-50 nm size contained a significant amount
of Ti, similar to the samples with a Zr addition. The critical current densities of the samples
with various contents of TiO
2
are presented in Figure 9 for temperatures between 65 K and
90 K. Magnetic field was applied parallel to the c-axis and J
c
was calculated from M-H
curves using the extended Bean model. In all samples, the remnant critical current density
dramatically increased in the whole range of investigated temperatures. At 65 K the critical
current density of the sample with 0.1 mol% TiO
2
reached 550 kA/cm
2
at 0 and 4.5 Tesla and
exceeded 450 kA/cm
2
over the whole range up to 5 Tesla. In the case of 0.2 mol% TiO
2
doping the super-current density at 65 K reached 275 kA/cm
2
at 0 and 4.5 Tesla and
exceeded 250 kA/cm
2
over the whole range up to 5 Tesla, while the sample with 0.35 mol%
of TiO
2
showed J
c
of only 150 kA/cm
2
at 0 Tesla and 100 kA/cm
2
over the whole range up to
5 Tesla. At 90.2 K the remnant super-current density of the sample with 0.1 mol% TiO
2
reached 50 kA/cm
2
and the value decreased with further increasing the TiO
2
(≥0.2 mol%)
content. All these data indicate that the optimum pinning was reached for 0.1 mol% of TiO
2
.
The J
c
values presented here are significantly higher than those of a pure NEG-123 (without
TiO
2
) (Fig. 8). TiO
2
addition makes the NEG-123 composite a further member of the group
Fig. 8. Transmission electron micrograph of the NEG-123 + 35 mol% Gd-211 (70 nm) with 0.1
mol% TiO
2
. Besides the rather large precipitate of NEG-211 seen in the right figure, two
types of nanoparticles appear in the product, one within the size range 200-500 nm and
another one of 20-50 nm size. The 200-500 nm particles are Gd-rich NEG-211 and Gd-211
secondary phase. The smallest particles are (LRE,Ti)BaCuO and LRE-Ba
2
CuZrO
y
. The
arrows point to some of the nanometer sized Ti-based nanoparticles.
Nanoscale Pinning in the LRE-123 System -
the Way to Applications up to Liquid Oxygen Temperature and High Magnetic Fields
215
0
100
200
300
400
500
600
65 K
68 K
70 K
73 K
75 K
77 K
80 K
82 K
84 K
86 K
88 K
90 K
J
c
(kA cm
-2
)
0.1 mol% TiO
2
0
100
200
01234567
65 K
68 K
70 K
73 K
75 K
77 K
80 K
82 K
84 K
86 K
88 K
90 K
J
c
(kA/cm
2
)
H
a
(T)μ
0
0.2 mol% TiO
2
0
50
100
150
01234567
65 K
68 K
70 K
73 K
75 K
77 K
80 K
82 K
84 K
86 K
88 K
90 K
H
a
(T)
μ
0
0.35 mol% TiO
2
Fig. 9. Field dependence of the super-current density of the NEG-123 samples with the same,
35 mol%, content of Gd-211 (70 nm) but various contents of TiO
2
, measured from 65 K to 90
K with H||c-axis. Note the critical current densities of 550 kA/cm
2
at self-field and 4.5T at
65 K and 50 kA/cm
2
at self-field at 90 K, achieved with 0.1 mol% TiO
2
.
capable of permanent magnet levitation at 90.2 K, with liquid oxygen cooling (Muralidhar et
al., 2003b).
The normalized volume pinning force density, f
p
= F
p
/F
pmax
, as a function of the reduced
field, h = H
a
/H
irr
, is frequently used as a measure of the pinning structure effectiveness. H
irr
was determined from magnetization loops using the criterion of 100 A/cm
2
. The f
p
(h) curves
for a pure and Ti-doped NEG-123 are presented in Fig. 10. For the pure and 0.1 mol% of Ti
NEG-123 samples, the f
p
(h) dependence peaked close to 0.42. Note that 0.5 was in classical
theories associated with δT
c
pinning. While even a slightly increased TiO
2
content over 0.1
mol% shifted the peak of f
p
(h) down to 0.36, the optimum quantity of 0.1 mol% of Ti did not
affect the pinning mechanism much.
Whatever the pinning mechanism really is, a higher position of the f
p
(h) peak is associated
with a better flux pinning. Moreover, the normalized peak position 0.5 is the highest met in
literature. In this sense the f
p
(h) dependence confirms the conclusion that the 0.1 mol% Ti
concentration is optimum. Magnetic data combined with microstructure analysis proved that
TiO
2
nanoparticles belong to the agents capable to significantly improve pinning performance
of the LRE-123 materials so that NEG-123 could be utilized for fabrication of superconducting
super-magnets working at liquid argon and/or liquid oxygen temperatures.