Advances in Measurement Systems Part 13 docx
Bạn đang xem bản rút gọn của tài liệu. Xem và tải ngay bản đầy đủ của tài liệu tại đây (2.33 MB, 40 trang )
AdvancesinMeasurementSystems476
location of the sensor, the date and the release of the last firmware upgrade, the author
of the system and the organization that developed the device.
ACK: If the SETUP packet has been received correctly by the client and it interprets the
data in the right way, the client sends an acknowledgment packet to the server.
REQUEST: When the server receives an acknowledgment packet, it waits for a request
packet from the client for the accessing of the data provided by a transducer connected to the
server.
DATA-SEND: After receiving the request packet, the server begins to process the
acquired data from the sensor involved in the calling and then transmits a new
datagram with the result. The form of the datagram depends on the dimension of the
data type that represents the measurement.
3. The Web service technology
The use of the XML as streaming support of measurement results is a good solution for all
the remote measuring applications. However, XML presents a limitation: even if the
streaming support is open, well organized and cross platform, the way used by client and
server to exchange XML streaming data is proprietary. These problems present important
limitations in the development of complex sensors network (Ferrari et al., 2003).
The basic requirement beyond smart Web sensor is the needing to have in some way the
accessibility to some measured value (Bucci et al., 2003). The supplying of this value can be
seen as a service done by an embedded server that is accessible on Internet. Every server
allows the client to access the information acquired from a sensor.
A different approach to Web sensor development is based on the new concept of server that
has been developed by the W3C (World Wide Web Consortium) ( the
idea is to consider a Web server not only as a stand alone server that a client can access to
download files or HTML pages, but also a Web component that supply a service on the
Internet network (Mielcarz & Winiecki, 2005). This solution, known as Web service approach,
transforms a smart Web sensor into a server of measurement functions. In this way it is
possible to offer great possibilities in terms of easy access for measurement data, integration
of large complex Web sensors networks, realization of flexible custom applications and
services reusability. Every client or developer can use this service to obtain information or to
develop new complex services starting from the received information.
It is important to underline that Web services are similar to the local components used to
build Windows applications (COM Object) with the method and attribute that the COM
(Component Object Model) Object provides to the developer, but they aren’t physically
present in the local machines.
In the past, clients accessed these services using a tightly coupled, distributed computing
protocol, such as DCOM (Distributed Component Object Model), CORBA (Common Object
Request Broker Architecture), or RMI (Remote Method Invocation). While these protocols
are very effective for building a specific application, they limit the flexibility of the system.
Specifically, is the tight coupling used in these protocols (dependencies on vendor
implementations, platforms, languages, or data encoding schemes) that limits the reusability
of individual services.
The Web service architecture takes all the best features of the service-oriented approach and
combines it with the Web, supporting universal communication using loosely coupled
NewTechnologiesForMeasurementSystemsDistributedOnAWideArea 477
connections. Web protocols are completely vendor-, platform-, and language-independent.
Web services support Web-based access, easy integration, and service reusability.
3.1 Smart Web sensors based on Web services
As previously discussed, the today’s smart Web sensors present in literature adopt a micro-
embedded Web server to transfer data and information to the clients that perform the
request. As an application, starting form a low cost widely adopted smart Web sensor
(Castaldo et al., 2003) ; (Castaldo et al., 2004) (Testa et al. , 2004) , a new kind of smart Web
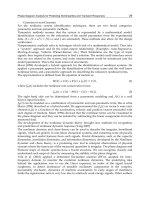
sensor with the Web service functionality is proposed; its simplified block diagram is shown
in Fig. 7.
Fig. 7. Simplified block diagram of a smart Web sensor based on Web services
For including a Web service in a server environment, the main and widely adopted software
architecture is ASP.NET, available in Microsoft Visual Studio .NET.
However, the use of a real Web service determines hard constraints on a general embedded
architecture in term of cost, portability and power consumption. For these reasons, a
possible solution for the developed of embedded Web service server is the use of a low cost
embedded Web server.
In general a Web server does not have the same functionally of a Web service because of the
use of HTTP (as protocol for sending data packets), HTML (to display information to a
browser) and SOAP, Simple Object Access Protocol, (to exchange data with a client or with a
Web service), while a Web server manages only HTTP and HTML.
As reported in Fig. 7, the communication system emulates a Web service opening a socket
on port 80 for the listening of all the packets; then, a HTTP and SOAP parser controls and
responses to the SOAP messages.
AdvancesinMeasurementSystems478
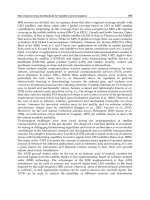
The most remarkable aspect of the entire flow is the waiting time of the Windows Form
during a request; this time depends on the network load and on the number of samples
acquired by the microcontroller. When the Windows Form sends a request on HTTP with a
SOAP message to the Light Web service, it waits a SOAP response (an XML streaming file)
in which the waveform is serialized. During this time, the Windows Form doesn’t execute
any other thread and it waits for the SOAP message.
To continue to use the Windows Form, it is necessary to control the thread of the Windows
Form otherwise the process seizes up and any operation can be run (see Fig. 8).
Fig. 8. Time analysis of the tasks present in the whole system
4. Plug-n-play smart Web sensors based on Web services
In a DMS, based on this technology, the services published by a Web service are reported in
the WSDL (Web Services Definition Language) file.
Unfortunately, the Web service technology does not give any mechanism to refresh the
services published and to manage dynamically the new services exported or deleted
(Mielcarz & Winiecki, 2005). For instance, the access to a deleted service by a distributed
application can generate an exception, collapsing the whole system and switching off the
application. This is a stiff limitation, especially for a network of sensors that are often
reconfigured to perform different measurements (Bucci et al., 2001), that require an
appropriate run-time control for managing these service problems. Therefore, it is very
important to develop a methodology to create a network in which smart Web sensors
(network nodes) can be plugged without the need for an external configuration (Bucci et al.,
2007).
A suitable solution is that every sensor sets an IP address and communicates its ability to the
network master, who has two functions: master of the entire network and gateway
(Ciancetta et al., 2007) Besides, the network master provides a Web service interface to every
client that wants to use the sensors network: the entire network is equivalent to a single
dynamic Web service (Ciancetta et al., 2006).
The core of this new approach is the adoption of two different tables in the smart sensors
network: IP Routing Table and Services Table. The IP Routing Table is a table necessary to
route a request from a client. This table stores the IP address and the services of every node;
allowing the server to join the network node with its services. So, every request from a client
NewTechnologiesForMeasurementSystemsDistributedOnAWideArea 479
can be sent to the specific node. However, the client request has a different approach: the
client sends a request to the server that, consulting its IP table routing, decides if it can
execute the request. Next, the server sends a request to the network node present in the table
to await the response and re-sends it to the client. This operation works well if there is a
request to a specific service present in the network.
The main advantage of this solution is the possibility to merge more services to implement
another new service. For example, we can imagine having a sensors network with two
nodes: a voltage measurement sensor and a current measurement sensor. Besides the voltage
or current services, the server can create other ”virtual” services by fusion of the existing
services. As an example, power or resistance can be ”virtually” measured starting from these
two services and the server can show four different services stored in the Service Table. This
table, showing all the services available to the client and how they can be implemented, is
upgraded every time a new sensor, executing new services, is plugged.
The service table describes whether the service is direct (not virtual) or virtual as shown in Fig. 9.
A direct service is directly connected to a node, so, the Web service consults its IP table routing to
resolve it. On the contrary, if a client sends a virtual request, the Web service consults an
execution table, where the service is linked with a specific function related to actual devices.
Fig. 9. IP Routing Table and Service Table
The Web service presents a DataBase (DB) storing all the executable functions. A typical
function executes these tasks: i) reserves the required memory to every element; ii) receives
all the values from the services involved in the function; iii) performs all the operations
necessary to have the correct result; iv) gives the result to the Web service that resends it to
the client, using SOAP.
The Fig. 9 illustrates how a Web service deals with a virtual service received from a client.
The execution table is consulted to know whether the Web service can perform the function.
Then the service table is consulted, to find the services it requires. Adopting this technique,
it’s possible to execute a virtual service by means of other virtual services. The service table
has an important role in this approach. Every time a new network node is plugged in a
sensors network, the Web service maps all the direct services available on the node,
AdvancesinMeasurementSystems480
upgrading the IP routing table. Moreover, it scans all the DB functions that can be
performed, to correctly execute virtual services.
5. A peer-to-peer distributed system for multipoint measurement techniques
To implement a DMS based on smart Web sensors, it is necessary to use a common and open
communication protocol to exchange information and a methodology to auto-configure any
smart sensor is linked to the network. Peer-to-peer networks allow individual computers to
communicate directly with each other and to share information and resources without using
specialized servers. A common characteristic of this new breed of applications is that they
build, at the application level, a virtual network with its own routing mechanisms. The
topology of this virtual network and the adopted routing mechanisms has a significant
influence on the application properties such as performance and reliability (Ripenanu,
2001). Significant advantages can be gained using a freeware and widely adopted
technology, such as the Gnutella.
The Gnutella protocol (The Gnutella protocol specification v4.0) .is an open, decentralized
group membership and search protocol, mainly used for file sharing. The term Gnutella also
designates the virtual network of Internet accessible hosts running Gnutella-speaking
applications (this is the Gnutella network) and a number of smaller, and often private,
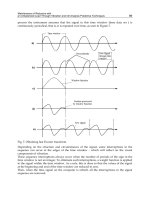
disconnected networks. The graph in Fig. 10 depicts the topology of peers forming a
connected segment of the Gnutella network.
Fig. 10. A representation of the topology of Gnutella Network
Like most peer-to-peer file sharing applications, Gnutella was designed to meet the
following goals:
- Ability to operate in a dynamic environment. Peer-to-peer applications operate in
dynamic environments, where hosts may join or leave the network frequently.
They must achieve flexibility in order to keep operating transparently despite a
constantly changing set of resources.
- Performance and Scalability. The peer-to-peer paradigm shows its full potential only
on large-scale deployments where the limits of the traditional client/server
paradigm become obvious. Moreover, scalability is important as peer-to-peer
NewTechnologiesForMeasurementSystemsDistributedOnAWideArea 481
applications exhibit what economists call the ”network effect” (Makarenko et al.
2004): the value of a network to an individual user scales with the total number of
participants. Ideally, when increasing the number of nodes, aggregate storage space
and file availability should grow linearly, response time should remain constant,
while search throughput should remain high or grow.
- Reliability. External attacks should not cause significant data or performance loss.
- Anonymity. Anonymity is valued as a means of protecting the privacy of people
seeking or providing unpopular information.
Gnutella nodes, called servents by developers, perform tasks normally associated with both
SERVers and cliENTS. They provide client-side interfaces through which users can issue
queries and view search results, accept queries from other servents, check for matches
against their local data set, and respond with corresponding results. These nodes are also
responsible for managing the background traffic that spreads the information used to
maintain network integrity.
The Ultrapeer is an important concept that was not specified in the original Gnutella
protocol, but which has now become a prominent feature of the Gnutella network. The
Ultrapeer scheme improves network efficiency and scalability by categorizing nodes into
regular clients and super nodes. A super node is a reliably connected host with plenty of
network bandwidth that can act as a proxy for a large number of connecting clients. The
super node removes the burden of extensive network message routing from the client, which
may be a low bandwidth modem user. With this scheme, the Gnutella network mimics the
Internet itself: low bandwidth nodes are connected to larger routers (the super nodes) that
transmit the majority of the data over high bandwidth backbones.
As an example of using the Gnutella network, we describe a network that allows linked
hosts to share arbitrary resources. This is a decentralized peer-to-peer system, consisting of
hosts connected to one another using TCP/IP. In this network a client request for a
measurement application is addressed to a computer which performs a particular Web
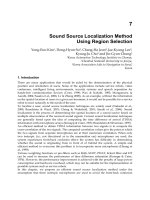
service (Gnutella Web Service). This systems use the Gnutella network to search all the users
able to perform the specific measurement, called Gnutella Embedded Clients (GECs) as
reported in Fig. 11.
Fig. 11. Distributed architecture of a Gnutella measurement network
The name client for GEC is because it is a client of the Gnutella network. To execute the user
search the request (query message) is repeated to all the Gnutella network computers (Fig.
12). When the suitable user is found, this network sends back the GEC address to the client.
AdvancesinMeasurementSystems482
At this point, the client can download the measures directly from the GEC, without
overloading the Gnutella network (Bucci et al., 2005).
In this system, the measurement points are the GECs; each GEC can perform special
measurements, depending on the kind of sensors embodied. This network creates an
Internet over-structure from which all clients can perform a free access without external
configuration and the GECs are visible without special operations. In order to implement
this kind of system, a special Gnutella Web Service, a kind of interface between the client
and the Gnutella network (Fig. 13) has been implemented, because the current
implementations, referring exclusively on files sharing, cannot support a measurement
process. When a measurement operation is asked, GEC sends the results to the Gnutella Web
Service (GWS). One of the advantages of the proposed solution is the simplification of the
activities to search and locate the measurement systems (GECs).
Fig. 12. The measurement server search, route and download
Fig. 13. Architecture of the implemented Web Service and User Interface
The GWS provides a particular implementation of typical Gnutella software, developing an
ad-hoc Gnutella Search Engine. The methods are specifically developed for a measurement
application; in particular the exported methods are:
NewTechnologiesForMeasurementSystemsDistributedOnAWideArea 483
1. GetStations: to obtain information about the stations present in a limited
geographic area defined by GPS coordinates, in order to restrict the searching. The
output of the method gives an array of stations in which every one reports.
2. GetCurrentData: the user calls the method passing the HASHID (hash
identification)of the remote station and the service request to obtain the current
data.
3. GetHistoryData: is similar to GetCurrentData, but accesses to stored DB data.
The Gnutella network is time consuming during the searching. In order to reduce this time,
we adopted a caching system: at the end of a search, the authenticated stations are cached
and their IP address stored in a DB for a limited period. Therefore, to obtain some
information from a particular station, it is not necessary to start a new search, but it is
possible to directly perform the download.
5.1 Environment monitoring application
In order to evaluate the feature of the proposed architecture, we implemented a monitoring
application able to measure atmospheric values (Manuel et al., 2005), (Simic & Sastry, 2003)
developing a remote measurement system (GEC), a GWS and a Web interface between the
server and the operator (Ciancetta et al., 2007), (Ciancetta, Bucci et al. 2007).
The Web user interface has been implemented as a XHTML (eXtensible HyperText Markup
Language) page that sends a request to Web Service and displays the results using Google
Map (Fig. 14).
Fig. 14. Screenshot of Web user interface.
The Web user interface gives a more degree of freedom to the whole system, allowing the
user to directly access measurement information with a common browser. We used Ajax
(Asynchronous JavaScript and XML) technology to create interactive Web applications.
AdvancesinMeasurementSystems484
The XHTML page sends asynchronous requests to the Web Service and installs a callback
function on the XMLHttpRequest. All the management of the function is done in JavaScript.
To interface the XHTML-JavaScript page with GWS, we adopted a SOAP client, a JavaScript
class able to receive/create XML data form XHTML page and create/receive SOAP packet to
GWS. In particular, on the remote station we implemented the services: temperature,
humidity, pressure, wind direction and speed as shown in the Google Map Balloon
accessible directly on the map.
To provide a more powerful mode to represent data from Gnutella Embedded Client we
suggest a Windows Form user interface, based on Framework .NET 2.0. In the example, the
user interface is divided in two parts: the first part, placed on the right side of the Windows
Form, in which the user can: i) list the GECs present in the geographic area limited by the
GPS coordinates; ii) select a station, looking at the available services and its GPS coordinates;
iii) see a geographic view of all the station involved in the search. On the left Windows Form
side there are two panels, reporting the downloaded data.
In the Current Data Panel (Fig. 15) there is a current view of the station with the last stored
data acquired by the Gnutella Embedded Client and a graphical view of all the data of the
current day from the 0:00 to the current hour retrieved form the GEC DB. The History Data
Panel (Fig. 16) performs a direct access to the Gnutella Embedded Client DB, downloading
the data.
In this example, all data are accessible directly to the GEC, without using the Gnutella
network to reduce the traffic. In order to reduce space there are two DBs: one for the values
accumulated during the day and another for an historical trend of the measurements.
6. Sensor synchronization
In a DMS time synchronization is a very important feature; many applications need local
clocks of sensor nodes to be synchronized, requiring various degrees of precision.
Unfortunately clock devices generate signals with some relative time uncertainties: local
clock signals may drift from each other in time, hence sampling time or durations of time
intervals may differ for each node in the network.
In general, a DMS can require different clock synchronization. The simplest case is the need
to order the measures, that is to determine whether a measure m
1
carried out by a sensor has
occurred before or after another measure m
2
carried out by another one. This problem
presents simple solutions, because it is just required to compare the local clocks rather than
to synchronize them.
Another more important occurrence is when each node embodies an independent clock and
it is necessary to obtain information about the deviation from the other clocks in the
network. In this way each node has its own local clock, but it is possible to convert a local
time to the local times of other nodes. The majority of the synchronization procedures
proposed for sensor networks use this technique (Elson et al., 2002); (Greunen &, Rabaey,
2003); (Sichitiu & Veerarittiphan, 2003)
The most complex situation is when all nodes must maintain a local clock synchronized to a
remote reference clock. This is, for example, the case of two sensors sampling voltage and
current that must be synchronized for calculating the electrical power. The synchronization
scheme of (Ganeriwal et al., 2003) conforms to this model.
NewTechnologiesForMeasurementSystemsDistributedOnAWideArea 485
The synchronization methods are generally based on message exchange between nodes. In
effect the problem is complicated by the nondeterminism in the network data access time,
typical of Ethernet, characterized by a random access time, and in the variable packet
transmission time. If a node transmits a measure with the local timestamp to another node
or client, the packet can have a variable amount of delay before it is delivered, precluding
the possibility of comparing and synchronizing the two clocks. Other access techniques,
such as the TDMA (Time Division Multiple Access) can eliminate the uncertainty on the
access time, but not on the transmission time.
Traditional synchronization techniques such as the use of a global positioning system (GPS)
are not suitable for use in sensor networks; a GPS device may be too expensive to attach on a
small sensor devices, and GPS service may not be available everywhere, such as inside a
building. Moreover, this problem becomes important especially for a network of wireless
smart sensors, because of their intrinsic properties such as limited resources of energy,
storage, and computation.
To solve this problem, several solutions are under study in terms of synchronization
algorithms, specifically designed for sensor networks.
The most diffused protocol is the Reference Broadcast Synchronization (RBS) (Elson &
Estrin, 2001) where the sensors are divided in clusters, each with a cluster-head that transmit
a synchronization packet (beacon). A reference beacon does not include a timestamp, but
instead, its time of arrival is used by receiving nodes as a reference for comparing clocks. All
receivers record the packet arrival time. The receiver nodes then exchange their recorded
timestamps and estimate their relative phase offsets. RBS also estimates the clock skew by
using a least-squares linear regression. The interesting feature of RBS is that it records the
timestamp only at the receivers, thus, all timing uncertainties, including MAC (Media
Access Control) medium access time, on the transmitter’s side are eliminated. This
characteristic makes it especially suitable for hardware that does not provide low-level
access to the MAC layer. The main disadvantage of RBS is that it does not synchronize the
sender with the receiver directly and that, when the programmers have low-level access at
the MAC layer, simpler methods can achieve a similar precision to RBS.
Another protocol is the Flooding Time Synchronization Protocol (FTSP) or Tiny-Sync. FTSP,
designed for applications requiring very high precision, utilizes a customized MAC layer
time-stamping and calibration to eliminate unknown delays (Mar´oti et al., 2004). Linear
regression from multiple timestamps is used to estimate the clock drift and offset. The main
drawback of FTSP is that it requires calibration on the hardware actually used in the
deployment (it is not a simply software algorithm). FTSP also requires intimate access to the
MAC layer for multiple timestamps. However, if well calibrated, the FTSP’s precision is less
than 2 μs.
The Precision Time Protocol (PTP) is a high precision time synchronization protocol, defined
in the IEEE 1588 standards "Standard for a Precision Clock Synchronization Protocol for
Networked Measurement and Control Systems". There are two steps for synchronizing
devices using PTP: (1) determine which device serves as the master clock, and (2) measure
and correct time skew caused by clock offsets and network delays. When a system is
initialized, the protocol uses an algorithm to determine which clock (Master Clock) in the
network is the most precise. All other clocks become slaves and synchronize their clocks
with the master. Because the time difference between the master clock and slave clock is a
combination of the clock offset and message transmission delay, correcting the clock skew is
AdvancesinMeasurementSystems486
done in two phases: offset correction and delay correction. Accuracy in the sub-microsecond
range may be achieved with low-cost implementations.
7. Conclusions and future trends
Smart sensors are an enabling technology that will influence the future applications of
measurement and data acquisition systems distributed on a wide area. The main
revolutionary aspect of DMSs is the advanced integration of many state-of-the-art enabling
technologies, mainly sensor, wireless communication, positioning, tracking and information
technologies.
The first consequence of present trends is the supposition that in the future all sensors will
be smart to some degree. Certainly a much higher percentage of them will be self-identifying
and communicating. Communication is an important requirement for these devices and
Internet, with either wired or wireless links, another widely shared solution.
It will be hard to solve all the problems in a “standard” way, also because there are several
different applications with conflicting requirements. Proprietary solutions will be proposed
again, especially for industrial applications. A plentiful supply of software tools for
information and communication applications can help the DMS developers; even if the
needs of a network of measurement systems are substantially different from a network of
computers or communication devices.
In this chapter we tried to give an overview of the actual possibilities and trend in this field,
even if the evolution run very fast and every day new standards and tools are available.
8. References
Amiano, M., Cruz, C., D., Ethier, K. and Thomas, M., D. (2006), XML Problem - Design -
Solution, Wiley, 2006. ISBN-13: 978-0-471-79119-5, ISBN-10: 0-471-79119-9.
Benz, B. and Durant, J., R. (2003) XML Programming Bible, Wiley, 2003. ISBN-10: 0-7645-3829-
2
Berkes, J., E. (2003), Decentralized Peer-to-Peer Network Architecture: Gnutella and Freenet,
University of Manitoba, Winnipeg, Manitoba, Canada, April, 2003.
Bertocco, M., Ferraris, F., Offelli C. and Parvis, M. (1998), A Client-Server Architecture for
Distributed Measurement Systems , Proceedings of IEEE Instrumentation and
Measurement Technology Conference St. Paul, Minnesota, USA, May 18-21, 1998
pp 67–72.
Bucci, G., Ciancetta F., Fiorucci, E., Gallo, D. and Landi, C. (2005), A low cost embedded Web
Services for measurements on power system, Proceeding of IEEE International
Conference on Virtual Environments, Human-Computer Interfaces, and
Measurement Systems, Giardini Naxos, Italy, 18-20 July, 2005.
Bucci, G., Ciancetta, F. and Fiorucci E. (2005), A DSP-Based Wireless and Modular Data
Acquisition Unit for Real-Time Measurement, TechOnline Technical Papers, March 16,
2005 www.techonline.com.
Bucci, G., Ciancetta, F. and Fiorucci, E. (2003), Unità d’acquisizione dati remota per sistemi di
misura e controllo su rete TCP/IP, Proceedings of Convegno Misure & Energia:
l’importanza della metrologia nellindustria energetica italiana, Milano, 25
Novembre 2003.
NewTechnologiesForMeasurementSystemsDistributedOnAWideArea 487
Bucci, G., Ciancetta, F. and Rotondale, N. (2007), Rete di sensori Plug-N-Play basata sui servizi
Web: applicazioni al controllo di processi industriali, Proceeding of LI Convegno
Nazionale Motion Control, ANIPLA 2007, Milano, Italy, 10-11 Maggio 2007.
Bucci, G., Fiorucci, E. and Landi, C. (2001), Digital Measurement Station for Power Quality
Analysis in Distributed Enviroments, Proceeding of IEEE International Conference on
Instrumentation and Measurement Technology Conference, Budapest, Hungary,
May 21-23,2001, pp 368–373.
Castaldo, D., Gallo, D. and Landi, C. (2004), Collaborative Multisensor Network Architecture
Based On Smart Web Sensor for Power Quality Applications, Proceedings of IEEE
International Conference on Instrumentation and Measurement Technology
Conference, Como, Italy, 18-20 May, 2004, pp 1361– 1366.
Castaldo, D., Gallo, D., Landi, C., Langella, R. and Testa, A. (2003), A Distributed Measurement
System for Power Quality Analysis, Proceedings of IEEE Power Tech 2003, Bologna,
Italy, June 23-26, 2003.
Chu X., Kobialka T., Durnota B., and Buyya R. (2006). Open Sensor Web Architecture: Core
Services, Proceedings of the 4th International Conference on Intelligent Sensing and
Information Processing (ICISIP 2006). ISBN 1-4244-0611-0, pp.:98-103. Bangalore,
India.
Ciancetta, F., Bucci, G., Fiorucci, E., D’Apice, B. and Landi, C. (2007), Proposta di un sistema di
misura distribuito basato su una rete Peer-To-Peer, Proceeding of XXIV Congresso
nazionale GMEE (Gruppo Nazionale di Coordinamento Misure elettriche ed
Elettroniche), Torino, Italy, 5-8 Settembre 2007.
Ciancetta, F., D’Apice, B., Gallo, D. and Landi, C. (2006), Sistema di misura distribuito basato sui
sensori smart e servizi Web, Proceeding of XXIII Congresso nazionale GMEE (Gruppo
Nazionale di Coordinamento Misure elettriche ed Elettroniche), L’Aquila, Italy, 11-
13 Settembre 2006.
Ciancetta, F., DApice, B., Landi, C. and Pelvio, A. (2007), Sistema di misura distribuito per il
monitoraggio di rete di potenza, Proceeding of XXIV Congresso nazionale GMEE
(Gruppo Nazionale di Coordinamento Misure elettriche ed Elettroniche), Torino,
Italy, 5-8 Settembre 2007.
Ciancetta, F., Fiorucci, E., D’Apice, B. and Landi, C. (2007), A Peer-to-Peer Distributed System
for Multipoint Measurement Techniques, Proceedings of IEEE Instrumentation and
Measurement Technology Conference, Warsaw, Poland, May 1-3, 2007, pp 1–6
Coulouris, G., Dollimore, J. and Kindberg, T. (1994) Distributed Systems, Concepts and Design,
Addison-Wesley, Reading, MA, 1994.
Elmasri, R., and Navathe, S., B. (1994) Fundamentals of Database Systems, Addison-Wesley,
Reading, MA, 1994.
Elson, J. and Estrin, D. (2001), Time synchronization for wireless sensor networks, In Proc. of the
2001 International Parallel and Distributed Processing Symposium (IPDPS),
Workshop on Parallel and Distributed Computing Issues in Wireless Networks and
Mobile Computing. San Francisco, CA.
Elson, J., Girod, L. and Estrin, D. (2002), Fine-Grained Time Synchronization using Reference
Broadcasts, Proceedings of the Fifth Symposium on Operating Systems Design and
Implementation (OSDI 2002), Boston, MA, December 2002.
AdvancesinMeasurementSystems488
Ferrari, P., Flammini, A., Marioli, D., Sisinni, E. and Taroni, A. (2003), Sensor integration in
Industrial Environment: From Field-bus to web-sensors, Computer standards &
Interfaces, 25, 2003.
Ganeriwal, S., Kumar, R. and Srivastava, M. (2003), Timing Sync Protocol for Sensor Networks,
Proceedings of ACM SenSys, Los Angeles, November 2003.
Greunen, J. and V., Rabaey, J. (2003), Lightweight Time Synchronization for Sensor Networks,
Proceedings of the 2nd ACM International Conference on Wireless Sensor
Networks and Applications (WSNA), San Diego, CA, September 2003.
Grimaldi, D., Nigro, L. and Pupo, F. (1997), Java based distributed measurement systems,
Proceedings of IEEE Instrumentation and Measurement Technology Conference,
19-21 May 1997, Ottawa, Canada, pp 686–689.
Grimaldi, D., Rapuano, S. and Laopoulos, T. (2005) State of Art of the Distributed Measurement
Systems for Industrial and Educational Purposes, IEEE Workshop on Intelligent Data
Acquisition and Advanced Computing Systems: Technology and Applications, 5-7
September 2005, Sofia, Bulgaria pp 289–294.
Hamrita, T.K. Kaluskar, N.P. Wolfe, K.L. (2005). Advances in smart sensor technology.
Proc. Of Industry Applications Conference, 2005. ISBN: 0-7803-9208-6. Volume: 3, pp.:
2059 – 2062.
Han, R., Perret, V. and Naghshineh M. (2000), WebSplitter: A Unified XML Framework for
Multi-device Collaborative Web Browsing, Computer Supported Cooperative Work, pp
21–23.
Hrushal, V., Osolinskiyl, O., Daponte P. and Grimaldi D.(2005), Distributed Web-based
Measurement System, Proceedings of IEEE Workshop on Intelligent Data Acquisition
and Advanced Computing Systems: Technology and Applications, 5-7 September
2005, Sofia, Bulgaria pp 355–358.
IEEE Standard for a Smart Transducer Interface for Sensors and Actuators, IEEE Std 1451.1-4,
1997,
Knyziak, T. and Winiecki, W. (2003), The New Prospects of Distributed Measurement Systems
Using JavaTM 2 Micro Edition Mobile Phone, Proceedings of IEEE International
Workshop on Intelligent Data Acquisition and Advanced Computing System:
Technology and Applications, 8-10 September 2003, Lviv, Ukraine, pp 291–295.
Makarenko, A., Brooks, A., Williams, S., Durrant-Whyte, H. and Grocholsky B. (2004), A
decentralized architecture for Active Sensor Networks, Proceedings of IEEE International
Conference on Robotics and Automation, New Orleans, LA, USA, April 26-May 1,
2004, pp 1097–1102.
Manuel, A., DelRio, J., Shariat, S., Piera, J. and Palomera, R. (2005), Software Tools for a
Distributed Temperature Measurement Systems, Proceedings of Instrumentation and
Measurement Technology Conference Ottawa, Ontario, Canada, May 17-19, 2005,
pp 1566–1570.
Mar´oti, M., Kusy, B., Simon, G., and L´edeczi, A. (2004) The flooding time synchronization
protocol, Proceedings of the 2nd international conference on Embedded networked
sensor systems, SenSys ’04, ACM Press, 39–49.
Michal, K. and Wieslaw, W. (2001), A New Java-Based Software Environment for Distributed
Measurement Systems Designing, Proceedings of IEEE Instrumentation and
Measurement Technology Conference, 21-23 May 2001, Budapest, Hungary, pp
397–402.
NewTechnologiesForMeasurementSystemsDistributedOnAWideArea 489
Mielcarz, T. and Winiecki, W. (2005), The Use of Web-services for Development of Distributed
Measurement Systems, Proceedings of IEEEWorkshop on Intelligent Data Acquisition
and Advanced Computing Systems: Technology and Applications, 5-7 September
2005 ,Sofia, Bulgaria, pp 320–324.
Morelli, S., Morelli, R., Ciancetta, F., Vasile, A., D’Intino, A., Di Donato, M., A., Di
Gioacchino, M. and Boscolo P. (2004), Monitoraggio dei campi elettromagnetici nelle
aree urbane di Chieti e Pescara, Proceedings of LXVII Congresso Nazionale S.I.M.L.I.I.,
Sorrento, Italy, 3-6 Novembre 2004, pp 301-302.
Ozsu, T. and Valduriez, P. (1991) Principles of Distributed Database Systems, Prentice-Hall,
Englewood Cliffs, NJ, 1991.
Ripeanu, M. (2001), Peer-to-Peer Architecture Case Study: Gnutella Network Analysis, 1st
International Conference in Peer-to-Peer Networks, Aug. 2001, Linkpings
Universitet, Sweden.
Rusty, H., E. (2004) XML 1.1 Bible, Wiley, 2004. ISBN-10: 0-7645-4986-3.
Sichitiu, M.,L. and Veerarittiphan, C. (2003), Simple, Accurate Time Synchronization for Wireless
Sensor Networks, Proceedings of IEEE Wireless Communications and Networking
Conference, WCNC 2003.
Simic, S. and N., Sastry, S. (2003), Distributed environmental monitoring using random sensor
networks, Proceedings of the 2nd International Workshop on Information Processing
in Sensor Networks, Palo Alto, California, April 22-23, 2003, pp 582–592.
Tanenbaum, A., S. (1992) Modern Operating Systems, Prentice-Hall, Englewood Cliffs, NJ,
1992.
Tari, Z. and Bukhres, O. (2001) Fundamentals of Distributed Object Systems: The CORBA
Perspective, Wiley, 2001.
Testa, A., Castaldo, D., Gallo, D. and Landi, C. (2004), A Digital Instrument for non-Stationary
Disturbance Analysis in Power Lines, IEEE Transactions on Instrumentation and
Measurement , 53, no. 5, August, 2004, pp 1353–1361.
The Gnutella protocol specification v4.0. 2004.
Viegas V., Dias Pereira J. M., Silva Girão P. (2007). Framework and Web Services: A Profit
Combination to Implement and Enhance the IEEE 1451.1 Standard. IEEE
Transactions on Instrumentation and Measurement, Volume 56.NET, Issue 6, pp. 2739-
2747, December 2007.
W3C, Extensible Markup Language (XML) 1.0 (Fourth Edition),
2006.
Yong Z.; Yikang G.; Vlatkovic, V.; Xiaojuan W. (2004). Progress of smart sensor and smart
sensor networks. Proc. of Intelligent Control and Automation, 2004. WCICA 2004.
Digital Object Identifier 10.1109/WCICA. 2004.1343265. Volume 4, pp.: 3600 – 3606.
AdvancesinMeasurementSystems490
Amethodologyformeasuringintellectualcapital.Astructuralequationsmodellingapproach 491
Amethodologyformeasuringintellectualcapital.Astructuralequations
modellingapproach
MariolinaLongoandMatteoMura
X
A methodology for measuring intellectual
capital. A structural equations modelling
approach
Mariolina Longo and Matteo Mura
Department of Management, University of Bologna
Italy
1. Introduction
The past decade has been characterized by a process of growing dematerialization of the
strategic resources possessed by firms. The relational capabilities of the firm, technology
connected with the planning and management of firm processes, know-how, as well as the
decisional autonomy and technical competencies of the employees all represent intangible
assets that are determining in the value creation process of a firm (Longo & Mura, 2007;
Roos et al., 2005).
The relevance of this topic is supported by the attention that financial markets attribute to
the accounting of these assets. In January 2007 the International Accounting Standard Board
issued a technical document in support of the ‘Intangible Assets’ project, which is examining
the possibility of adding to the balance sheet the intangible assets that are generated
internally to the firm and that are not subject to any negotiation on active markets (IASB,
2007). This ‘opening up’ in the accounting system has important effects on the economic
evaluation of a company and on its ability to gain access to credit, in that it provides the
market, the institutional investors and the financial analysts very precious information
regarding the development of fundamental resources for the value creation process of a
firm.
Furthermore, performance management literature has highlighted the need for specific tools
for the measurement of internally-generated intangible assets, defined in managerial
literature as intellectual capital (IC) (Tayles et al., 2002). These tools have been shown to
greatly support management activity (Roos et al., 2005; Carlucci et al., 2004). As a matter of
fact, the integration of information related to company’s intellectual capital together with
quantitative information relative to the firm’s strategic policies, offers management a
display of important indicators for the definition and the control of corporate objectives.
Numerous intellectual capital frameworks have been proposed in the literature (e.g.
Edvinsson & Malone, 1997; Roos et al, 2005; Sveiby, 1997), however, further research is still
needed to investigate the challenges and opportunities of designing intellectual capital
measurement tools that are grounded in relevant measurement theory (Bollen, 1989;
M’Pherson & Pike, 2001).
20
AdvancesinMeasurementSystems492
The chapter we propose describes the development and implementation of an IC
measurement system within an Italian company that is leader in the agricultural food
product sector. Since IC creation and development is primarily founded on the actions and
capabilities of the employees (Roslender et al., 2006; Roslender & Fincham, 2001), the
individual employee has been used as the unit of analysis of this study. This element
constitutes an innovative factor with respect to other studies which instead use MBA
students (Bontis, 1998; Bontis et al., 2000), or adopt the managers’ perceptions as proxy of
the company they work for (Staples, 1999; Youndt & Snell, 2004). The measurement system
has been developed based on two surveys that were conducted in 2005 and 2006 on all the
employees of the 13 business units of the company. About 3,400 questionnaires were
distributed and, with an average redemption of 35%, the sample consists of 1,117
observations. Structural equations modelling (SEM) methodology was used to validate the
IC measurement model and to identify and test the effect that two specific company’s
human resource practices have on IC.
The chapter is structured as follows: next section describes the concept of intellectual capital
as emerges from academic and practitioners’ literature, followed by the theoretical model
we propose in this study. The third section illustrates the methodology adopted and the
data-gathering process and the following section presents the analyses of the data and the
results obtained. The managerial implications of our study, together with the limitations and
the future developments of the tool are described in the closing section.
2. Intellectual capital: definition and dimensions
Numerous studies have extensively reviewed and discussed the IC literature (Allee, 2000;
Andriessen, 2004; Hunter et al., 2005; Roos et al., 2005; Serenko & Bontis, 2004). Therefore,
the focus of this section will efficiently turn to defining the constructs we intend to measure.
The following definitions summarize some of the highlights of this field.
IC scholars have generally identified three main dimensions of IC that include human
capital, structural capital, and relational capital. Human capital represents the individual
knowledge stock of an organization as represented by its employees (Bontis, 2002).
Employees generate IC through their competence, in terms of skills and knowledge, and
their attitude, and in terms of the behavioural components of employees’ work (Roos et al.,
2005). Structural capital consists of mechanisms and organizational procedures which
support the employees in completing their tasks, and includes all non-human storehouses of
knowledge in organizations like databases, process manuals, routines, strategies, and
anything whose value to the company is higher than its material value (Bontis, 2000).
Relational capital is associated with the network of relations that the organization and its
members are able to establish both inside and outside the working environment. The
resources that emerge, that are transferred and are made connatural with these multifarious
relations constitute the relational capital of the organization (Adler & Kwon, 2002).
In developing a theoretical foundation for the three dimensions of IC, we have draw
primarily from human capital theory (e.g., Becker, 1964; Flamholtz & Lacey, 1981; Schultz,
1961), knowledge-based theory (eg., Grant, 1996; Polanyi, 1962; Spender, 1996), and social
capital theory (e.g., Jacobs, 1965; Loury, 1977; Baker, 1990). We have chosen these three
theories for their explicit theoretical relevance concerning IC. As a matter of fact, each
Amethodologyformeasuringintellectualcapital.Astructuralequationsmodellingapproach 493
perspective offers a different lens for understanding how firms can measure and manage
their IC, giving insights of each different dimension of the IC construct.
Below, we briefly discuss the contribution that each of the three theories gives to its
respective IC dimension. Specifically, we adopt the human capital theory to discuss the
human dimension of the IC construct, the knowledge-based theory to examine the structural
dimension, and the social capital theory to analyze the relational dimension.
2.1 Human capital
Human capital theory focuses on the concept that people possess skills, experience, and
knowledge that have economic value for firms. For the purpose of this study we propose
two arguments, previously discussed by Snell and Dean (1992), that expands on this
proposition.
The productivity argument emphasizes that employee skills and knowledge represent capital
because they enhance productivity, adding value to a firm. Even if part of this value is
tangible, in that it is created through the transformation of firm’s product, much of it is
intangible, and consist in problem solving skill, in the ability to identify the key aspects of
the work from those of less importance, and in the capability to be innovative and creative
in performing the job (Hitt et al., 2001; Nahapiet & Goshal, 1998). A firm can choose to
invest in human capital both internally developing employee skills or acquiring them on the
market (Hatch & Dyer, 2004; Lepak & Snell, 1999). Internalizing employment is more
desirable when firm can do so without investing in employee development, on the contrary,
if employee productivity is not expected to exceed investment costs, a firm will acquire
these skills on the labour market. Therefore, the decision to internalize or outsource human
capital is based on a comparison of the expected returns of employee productivity (Becker,
1964).
The transferability argument suggests that human capital has a price on the labour market
because it is valuable from other firms, and, more important, it is transferable. This
argument is based on the fact that firms don’t own human capital, because it is embodied in
employees, who are free to move from one firm to another (Becker, 1964; Hatch & Dyer,
2004). Low employee turnover therefore, represents an important element in the firm’s
value creating process in that secures the firm from loosing key skills, knowledge, and
expertise (Arthur, 1994; Hudson, 1993). Notwithstanding, even if employees stay with a
firm, their contribution depends on their willingness to perform. For this reason employee
satisfaction, motivation, and commitment are decisive components in the development of
human capital (Arthur, 1994; Lepak & Snell, 1999).
2.2 Structural capital
In their analysis of the intellectual capital concept, Nahapiet & Goshal (1998) clearly
distinguish between two types of knowledge that form the base of IC: the people knowledge
and the social knowledge. While the former represents a part of the human capital
dimension, and was discussed in the previous section, we delve into the latter in defining
the structural dimension of IC.
Knowledge management scholars (Polanyi, 1962; Weick & Roberts, 1993; Spender, 1996)
define social knowledge as the knowledge that is shared and embedded in the organization,
and suggest it comprises two elements: social explicit knowledge, and social tacit
AdvancesinMeasurementSystems494
knowledge. Social explicit knowledge, also called “objectified knowledge” (Spender, 1996),
corresponds to the shared corpus of knowledge of the organization, and it depends on
effective use of the institutional mechanisms, such as databases, patents, registered designs,
process manuals, and information systems, that contribute to distribute knowledge and
intellect (Youndt & Snell, 2004). As an evidence of the relevance of this element, Quinn,
Anderson and Finkelstein (1996) show that an increasing number of organizations make
major investments in the development of procedures and systems to pool and to leverage
such objectified knowledge.
Social tacit knowledge, also called “collective knowledge” (Spender, 1996), corresponds to
the knowledge that is embedded in the form of social practice and resides in the tacit
experience of the collective (Brown & Duguid, 1991). Nelson and Winter (1982) define this
form of knowledge as the organization’s genetic material that may reside in bureaucratic
and formal rules, or in organization’s norms and culture, and call it “routines”. This
collective knowledge is produced internally (Penrose, 1959) and may represents the
outcome of firm’s evolving methods and policies that: foster and support employees in the
development of new ideas and innovative approaches that give rise to extrarational learning
processes (Nelson, Winter, 1982); give emphasis to quality procedures; or contribute to align
employees and organizational goals (Schiemann, 2006).
2.3 Relational capital
Relational, or social
1
, capital is defined as the sum of actual and potential resources
embedded within, available through, and derived from the networking relationships
developed by an individual or an organization (Lin, 2001; Nahapiet & Goshal, 1998).
Therefore, social capital encompass both the network of relations and the assets that may be
mobilized through that network (Bourdieu, 1986; Burt, 1992). The networking relationships
provide value for actors (e.g. individuals or organizations) by allowing them to tap into the
resources embedded in such relationships for their benefit (Acquaah, 2007). Researchers at
organizational level have suggested that the greater the uncertainty in the firm’s business
environment, the more likely the firm will rely on networking relationships when entering
into economic exchange relations (Pfeffer & Salancik, 1978; Peng & Heath, 1996).
Dyer & Nobeoka (2000) propose that networking relationships between the firm and its
external stakeholders, such as customers, suppliers, and business partners, stimulate the
creation, acquisition, and exploitation of knowledge and IC. In particular, networking with
customers may develop both customer and brand loyalties (Park & Luo, 2001), those with
suppliers may give access to quality raw materials, better service, and fast and reliable
deliveries (Peng & Luo, 2000), while those with business partners reduce the possibility of
opportunistic behaviour (Pisano, 1989), increase inter-firm trust (Kale et al., 2000), and
enhance the evolution of inter-partner relationships in terms of freer and greater exchange
of information, skills and know-how, and of development of new competences (Kale et al.,
2000; Walker et al., 1997).
Also intra-firm relations, like teamwork and department integration, represent a source of
knowledge development and acquisition and, consequently, contribute to the development
of IC (Nahapiet & Goshal, 1998). Collaborations and teamwork have been shown to be
1
Accordingly to Kale, Singh & Perlmutter (2000), in this article we use relational capital and
social capital as synonyms.
Amethodologyformeasuringintellectualcapital.Astructuralequationsmodellingapproach 495
important elements for the development of collective and shared knowledge in
biotechnology firms (Zucker et al., 1996), and, in general, in knowledge-based firms (McGill
& Slocum, 1994). As a matter of fact, cooperation among employees, rather than
competition, contributes on open disclosure of information, and on building loyalty to the
firm (Starbuck, 1992).
2.4 The proposed model
In this chapter we first aim to develop an IC measurement model that is coherent with the
theoretical framework proposed. Secondly, we explore the effect that two specific human
resource (HR) policies pursued by the company we analyzed have on the IC dimensions.
The HR policies were identified by means of numerous focus groups conducted with a
panel of company managers. By means of an in-depth analysis of the firm’s vision and
mission we selected two strategic policies of the company that could have an effect on IC.
The first policy identified, which we define as stakeholder management policy, refers to the
numerous corporate social responsibility and stakeholder management activities and actions
that have been carried out by the firm in recent years with regard to its human resources.
The second policy identified, which we define as perception of customers/consumers policy,
represents the perception, held by the employees, of the role played by the company within
its own economic environment.
In relation to the internal strategic policy we propose the following hypothesis:
Hp1: Stakeholder management policy positively affects IC.
Which can be divided into the following:
H1a: Stakeholder management policy positively affects human capital;
H2b: Stakeholder management policy positively affects structural capital;
H3c: Stakeholder management policy positively affects relational capital.
In relation to the perception of customers/consumers policy we propose the following:
H2: Perception of customers/consumers policy positively affects IC.
Which can be divided into the following:
H2a: Perception of customers/consumers policy positively affects human capital;
H2b: perception of customers/consumers policy positively affects structural capital;
H2c: perception of customers/consumers policy positively affects relational capital.
Figure 1 shows the theoretical model proposed.
AdvancesinMeasurementSystems496
Fig. 1. The model proposed
3. Method
3.1 Measures
In order to measure intellectual capital at the individual level of analysis we employed
measurement scales that were already developed in the literature. Moreover, we specifically
developed two scales that measure the human resource practices adopted by the company
and that were suggested to affect intellectual capital dimensions. All the scales have been
fully discussed together with company management. Thirteen scales have thereby been
identified and the questionnaire that has been prepared comprises 58 items on a 5 point
Likert scale. Those interviewed were asked to express how they felt about the stated items,
which varied from “strongly disagree” (level 1 on the scale) to “strongly agree (level 5 on
the scale). The following scales were used in order to measure intellectual capital (Table 1):
Intellectual capital
dimensions
Scales Authors
Human capital Low turnover propensity Chalykoff and Kochan
(1989)
Job satisfaction Zeitz et al. (1997)
Intrinsic work reflection Holman et al. (2001)
Practical application Holman et al. (2001)
Structural capital Trust Zeitz et al. (1997)
Sense of belonging Kidwell and Robie (2003)
Responsibility George (1992)
Relational capital Ability to work in a group Kidwell and Robie (2003)
Networking and communication Zeitz et al. (1997)
HR practices Customers Developed by authors
Stakeholder management Developed by authors
Table 1. Measures
The following control variables were used in this study: professional category, seniority
within the company, gender, area of work, business unit.
Structural
cap
i
ta
l
Human
ca
p
ital
Relational
capital
Perception of
customers
Stakeholder
Management
H1a
H1b
H1c
H2a
H2c
H2a
Amethodologyformeasuringintellectualcapital.Astructuralequationsmodellingapproach 497
3.2 Sample
Two surveys were conducted in 2005 and in 2006 taking the employees of the company as
the unit of analysis. The questionnaire was sent to employees by putting it in with the
employees’ pay slips. Along with board managers was considered non opportune to count
in 2005 survey three business units acquired few months before the administration of the
survey; on the contrary these plants were included in 2006 survey. In 2005 a total of 1.310
questionnaires were sent out and 460 were returned which meant that a percentage of 35%
replied. In 2006, 1928 questionnaires were sent out and 657 were returned (34 percent). The
data collected are significant in that they are uniformly split up into production plants and
job levels in relation to the company’s population (Table 2 and Table 3).
Business
Unit (BU)
BU
Population
(2005)
Questionnaires
Returned
(2005)
Redemption
(%)
(2005)
BU
Population
(2006)
Questionnaires
Returned
(2006)
Redemption
(%)
(2006)
No. 1 427 176 41.2 479 145 30.3
No. 2 144 38 26.4 117 26 22.2
No. 3 47 14 29.8 48 21 43.8
No. 4 145 29 20.0 165 30 18.2
No. 5 61 20 32.8 60 8 13.3
No. 6 40 17 42.5 41 25 61.0
No. 7 208 57 27.4 194 50 25.8
No. 8 85 37 43.5 91 44 48.4
No. 9 28 6 21.4 22 3 13.6
No. 10 125 66 52.8 108 69 63.9
No. 11 - - - 362 100 27.6
No. 12 - - - 172 84 48.8
No. 13
-
-
-
69 52 75.4
Total 1310 460 35. 1 1928 657 34.1
Table 2. Survey redemption for each business unit
Job Level
Population
(2005)
Questionnaires
Returned
(2005)
Redemption
(%)
(2005)
Population
(2006)
Questionnaires
Returned
(2006)
Redemption
(%)
(2006)
Executives 40 10 25.0 47 15 31.9
Middle-
Managers
75 34 45.3 94 30 31.9
Office
workers
458 198 43.2 718 214 29.8
Manual
workers
737 201 27.3 1017 359 35.3
Total 1310 443 33.8 1928 617 32.0
Table 3. Survey redemption for each job level
AdvancesinMeasurementSystems498
4. Analyses and results
4.1 Validity and reliability of the scales
The development of the measurement system comprised four consecutive stages of analysis.
Using the data provided by the 2006 survey, an exploratory factor analysis was carried out
on the items relative to each established category of resources, in order to define the
measurement of all the constructs. We then adopted a confirmatory factor analysis, using
the same sample, to evaluate how the data supplied by the employees related to the second-
order measurement model composed of 11 first-order latent factors, representing the
measurement scales as proposed in Table 1, and 4 second-order factors that consists of
human, structural and relational capital constructs. The measurement properties of
convergent validity, discriminant validity and internal consistency were all supported
(analyses are available under request).
In the final step of the analyses, the adequacy of the model is formally cross-validated by
means of a confirmatory factor analysis, using the 2005 survey data. The confirmatory data
analysis was performed using LISREL, structural equation modelling program (Jöreskog &
Sörbom, 2004). The exploratory analysis reduced the number of items adopted from 58 to 50.
Tables 4 shows means, standard deviations and reliabilities for first-order latent variables
both for the 2005 and the 2006 sample.
2005 sample 2006 sample
Variables Means s.d.
Cronbach’s
alpha
Means s.d.
Cronbach’s
alpha
Sense of
Belonging
3.70 1.04 0.86 3.76 1.09 0.88
Trust 3.09 1.31 0.81 3.25 1.31 0.80
Responsibility 4.03 0.99 0.62 4.01 0.90 0.79
Low turnover
propensity
2.93 0.94 0.80 3.90 0.98 0.78
Job satisfaction 2.26 1.09 0.87 2.39 1.22 0.90
Intrinsic work
reflection
3.94 0.80 0.76 3.91 0.88 0.79
Practical
application
3.38 0.90 0.48 3.33 0.99 0.60
Ability to work
in a group
3.26 1.00 0.93 3.40 1.01 0.89
Networking /
Communication
2.59 0.94 0.89 2.57 0.99 0.88
Stakeholder
management
2.66 0.93 0.90 2.81 0.97 0.91
Customers 3.30 0.94 0.86 3.62 0.92 0.84
Table 4. Means, standard deviations, and reliabilities
Amethodologyformeasuringintellectualcapital.Astructuralequationsmodellingapproach 499
4.2 The effect of human resource policies on IC
In order to understand the effect that the human resource practices and the control variables
have on intellectual capital dimensions, a hierarchical regression analysis was conducted in
two consecutives steps (George, 1992). This technique allowed us to calculate, separately,
the influence that the two groups of independent variables have on intellectual capital.
Tables 5 and 6 synthetically show the results of the regression analysis. The values given in
the column ∆R
2
indicate the variance explained by the groups of independent variables.
Step 1
Context factors
(∆R
2
)
Step 2
HR practices
(∆R
2
)
Sense of belonging 13% 24%
Trust 7% 48%
Responsibility 12% 14%
Low turnover propensity 7% 19%
Job satisfaction 7% 51%
Intrinsic work reflection 10% 16%
Pratical application 6% 5%
Ability to work in a group 7% 36%
Network and Communication 11% 63%
Table 5. Results of regression analysis using 2005 data
Step 1
Context factors
(∆R
2
)
Step 2
HR practices
(∆R
2
)
Sense of belonging 8% 30%
Trust 6% 46%
Responsibility 5% 19%
Low turnover propensity 6% 20%
Job satisfaction 6% 54%
Intrinsic work reflection 4% 16%
Pratical application 3% 10%
Ability to work in a group 5% 29%
Network and Communication 5% 64%
Table 6. Results of regression analysis using 2006 data
From the results it emerges that the human resource practices identified have a significant
effect, even though its intensity varies, on most of the intellectual capital resources, and in
particular on Trust, Job Satisfaction, Networking and Communication, and Ability to work in a
group. Moreover, no significant differences have been found between the 2005 and the 2006
values and this further strengthens the results obtained. Figure 1 illustrates the placing of
the intellectual capital resources and the impact of the company’s human resource practices
on the same in terms of variance explained.