Recent Advances in Biomedical Engineering 2011 Part 14 pdf
Bạn đang xem bản rút gọn của tài liệu. Xem và tải ngay bản đầy đủ của tài liệu tại đây (7.97 MB, 40 trang )
Linear and Nonlinear Synchronization Analysis
and Visualization during Altered States of Consciousness 509
1 2
'
, ,
1
| |
1
( | |) ( | |)
'
N
i y i i j x i i j
j
w i j w
SL
N
y y x x
(31)
Here, N’=2(w
2
-w
1
-1)P
ref
,
is the Euclidean distance and θ is the Heaviside step function,
θ(x)=0 if x≤0 and θ(x)=1 otherwise. w
1
is the Theiler correction for autocorrelation effects and
w
2
is a window that sharpens the time resolution of the synchronization measure and is
chosen such that w
1
<<w
2
<<N (Theiler, 1986). When no synchronization exists between x and
y, SL
i
will be equal to the likelihood that random vectors y
i
and y
j
are closer than ε
y
; thus
SL
i
=p
ref
. In the case of complete synchronization SL
i
=1. Intermediate coupling is reflected by
p
ref
< SL
i
<1. Finally, SL is defined as the time average of the SL
i
values.
i
x
y
r
x
r
i
y
N(x
i
)
N(y
i
)
X
Y
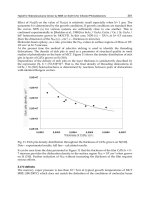
Fig. 3. Scheme representation of the basic idea of the synchronization method described by
Stam et al. (2002). SL expresses the chance that if the distance between x
i
and x
j
(neighboring delay vectors) is less than r
x
, the distance (r
y
) between the corresponding
vectors y
i
and y
j
in the state space will also be very small.
4. Surrogate time series analysis
So far we have discussed about linear and nonlinear methods for detecting synchronization
in bivariate EEG signals. But how can one decide on whether a linear or nonlinear model
better describes the data under study? A possible answer lies in the surrogate data testing
method. In other words, to demonstrate that the synchronization methods addressed are
sensitive in detecting nonlinear structures and thus reliable, surrogate data testing is used.
The surrogate data method was introduced about a decade ago and the basic idea is to
compute a nonlinear statistic Q for the original data under study, as well as for an ensemble
of realizations of a linear stochastic process, which mimics “linear properties” of the studied
data the surrogate data (Theiler, Eubank et al. 1992). If the computed nonlinear statistic for
the original dataset is significantly different from the values obtained from the surrogate set,
one can infer that the data is not generated by a linear process; otherwise the null
hypothesis, that a linear model fully explains the data is accepted.
The surrogating procedure preserves both the autocorrelation of the signals and their linear
cross-correlation, but the nonlinear individual structure of the individual signals, as well as
their nonlinear interdependence, if any, is destroyed. This simply means that an ensemble of
“surrogate data” has the same linear characteristics (power spectrum and coherence) as the
experimental data, but is otherwise random.
In practice, a set of p time series (surrogates) is constructed, which share the same
characteristics, but lack the property we want to test, the nonlinearity in our case. Using the
newly created surrogates the same index Q
surrogates
is repeatedly calculated leading to p+1
estimations of this. This procedure allows testing of the null hypothesis H
0
that the original
value of the statistic belongs to the distribution of the surrogates, hence H
0
is true. In other
words, one has to determine whether H
0
can be rejected at the desired level of confidence.
By estimating the mean and the standard deviation of the distribution of the statistic from
the surrogates and then comparing them with its value from the original signals Z-score is
calculated:
surrogates
surrogates
Q Q
Z
(32)
Z-score reveals the number of standard deviations Q is away from the mean Qs of the
surrogates. Assuming that Q is approximately normally distributed in the surrogates
ensemble, H
0
is rejected at the p<0.05 significance level when Z>1.96 (one-sided test). If, in
addition, no other possible causes of such a result can be accounted for, then it is reasonable
to conclude that the tested measure accounts for any nonlinear phenomena.
However, it should be noted that, although the above surrogating procedure preserves both
the autocorrelation of the signals and their linear cross-correlation, the nonlinear individual
structure of the individual signals, if any, is also destroyed. In other words, any nonlinearity
not only between but also within the signals is not present in the surrogates. Therefore,
these surrogates only test the hypothesis that the data are bivariate stochastic time series
with an arbitrary degree of linear auto and cross-correlation (Andrzejak, Kraskov et al.
2003). Nevertheless, if the two signals studied do have any nonlinear structure, it is not
possible to ascribe a rejection of the hypothesis that the interdependence is nonlinear due to
the nonlinearity of the interdependence, because the nonlinearity of the individual signals
may also play a role. Hence, the generation of surrogate data preserving all the individual
structure but destroying only the nonlinear part of the interdependence is currently one of
the most challenging tasks in the field, and it is a subject of ongoing research (Andrzejak,
Kraskov et al. 2003; Dolan 2004).
Pure nonlinear interdependence can contribute to linear correlations, but cannot be detected
by linear methods alone. It signifies the formation of macroscopic, dynamic neural cell
assemblies and transient low-dimensional interactions between them. Nonlinear
interdependence informs that the underlying dynamics are governed by nonlinear
processes, or that they are linear but evolving in the vicinity of a non-linear instability and
driving noise. Nonlinearities generate correlations that cannot be generated by stochastic
processes, such as coupling between oscillations with different frequencies (Friston 1997;
Breakspear and Terry 2002).
The most widely used method to obtain surrogate data is to randomize the phases of the
signal in the Fourier domain (Theiler, Eubank et al. 1992). Recent advances such as
employing iterative loops (Schreiber and Schmitz 1996), simulated annealing (Schreiber
1998) and others (Schreiber and Schmitz 2000) are all aimed to improve the goodness of the
fit between the linear properties of the experimental data and surrogate ensemble.
Recent Advances in Biomedical Engineering510
Unforunately, as noted beforehand, no surrogate technique is perfect (Schreiber and Schmitz
2000).
To conclude the whole nonlinearity section it should be stressed that even nonlinear
techniques look promising one should be cautious in practice. Many findings may have
been premature in that apparent nonlinear effects were in fact caused by limitations of the
data such as the sample length (Ruelle 1990). During the previous years there was a general
notion that EEG is chaotic, but nowadays there is a wide consensus and it is certainly no
longer generally accepted that the healthy EEG is a chaotic signal.
5. Graph Theory in EEG analysis
An alternative approach to the characterization of complex networks is the use of graph
theory (Strogatz 2001; Sporns, Chialvo et al. 2004; Sporns and Zwi 2004). A graph is a basic
representation of a network, which is essentially reduced to nodes (vertices) and
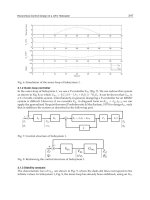
connections (edges) as illustrated in Fig. 4. Both local and long distance functional
connectivity in complex networks may alternatively be evaluated using measures and
visualizations derived from graph theory. Special interest in using graph theory to study
neural networks has been in focus recently, since it offers a unique perspective of studying
local and distributed brain interactions (Varela, Lachaux et al. 2001; Fingelkurts, Fingelkurts
et al. 2005).
Using the interdependence methods and measures analyzed in the previous sections one is
able to measure (in terms of 0 to 1) the coupling between different channels. If such
interdependence measures are constructed for every possible channel pair a coherence
matrix (CM) (i.e. 30x30, if 30 channels are used) with elements ranging from 0 to 1. Next, in
order to obtain a graph from a CM we need to convert it into an NxN binary adjacency
Fig. 4. A “healthy” network (left graph) appears to exhibit strong lateralization compared
to the “alcoholic” one (right graph) which exhibits interhemispheric symmetry, when the
broadband signals are analyzed.
matrix, A. To achieve that we define a variable called threshold T, such that
0,1T . The
value A(i,j) is either 1 or 0, indicating the presence or absence of an edge between nodes i
and j, respectively. Namely, A(i,j)=1 if C(i,j)≥T, otherwise A(i,j)=0. Thus we define a graph
for each value of T, i.e., for the purposes of our work, we defined 1000 such graphs, one for
every thousandth of T (Sakkalis et al., 2006a). After constructing A, one is able to compute
various properties of the resulting graph. These include the average degree K, the clustering
coefficient C and the average shortest path length L of our graph, which will be presented in
the next section. Figure 4 illustrates an example graph that resembles a “healthy” network
(left graph) compared to the “alcoholic” one, in both broadband and lower beta frequency
bands (Sakkalis et al., 2007).
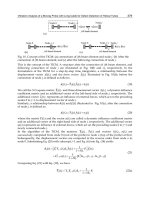
Another study (Sakkalis et al., 2008b) was able to identify and visualize the established brain
networks in gamma band by means of both linear and nonlinear synchrony measures, in
working memory paradigm. The nonlinear GS method was initially applied on all the actual
electrode recordings. The scalp map obtained (Fig. 5a) identified a network tendency to
localize synchronization activity mostly at frontal and occipitoparietal regions. However, no
linking between the two regions is evident. When we focus on the independent components
(instead of the actual electrodes themselves), the prominent inter-region connectivity in
gamma band between the prefrontal and occipital brain areas becomes evident (Fig. 5b).
a
Fp1Fp2
F7F8
AF1AF2
Fz
F4 F3
FC6 FC5
FC2 FC1
T8 T7Cz C3C4
CP5CP6
CP1CP2
P3P4
Pz
P8 P7
PO2 PO1
O2 O1
AF7AF8
F5F6
FT7FT8
Fpz
FC4 FC3
C6 C5
F2 F1
TP8 TP7
AFz
CP3CP4
P5P6
C1C2
PO7PO8
FCz
POz
Oz
P2 P1
CPz
b
c
Fig. 5. a) Aerial view of the scalp with the position of electrodes. The depicted average
network reflects a local prefrontal and occipitoparietal synchrony, as identified in gamma
band using the nonlinear synchronization method on the actual electrode signals in a
working memory paradigm. The next parts of this figure (b, c) are considering cross-
regional synchrony. b) The nonlinear synchronization method is applied in gamma band
ICs reflecting the underlying activity in the different brain regions (prefrontal (upper node),
temporal (left and right lateral nodes), parietal (lower middle node) and occipital (lowest
central node)). This figure focuses on the inter-region connectivity between the prefrontal
and occipital brain areas. c) Similarly to the middle graph but using PDC; again ICs in
gamma band exhibit significant linear coupling between the prefrontal and occipital areas,
as well as between the occipital and parietal areas. Directionality is also identified. The
apparent bidirectional coupling indicates no single influence between the “cause” and
“effect” relationship. The illustrated graphs are averaged over all subjects.
Linear and Nonlinear Synchronization Analysis
and Visualization during Altered States of Consciousness 511
Unforunately, as noted beforehand, no surrogate technique is perfect (Schreiber and Schmitz
2000).
To conclude the whole nonlinearity section it should be stressed that even nonlinear
techniques look promising one should be cautious in practice. Many findings may have
been premature in that apparent nonlinear effects were in fact caused by limitations of the
data such as the sample length (Ruelle 1990). During the previous years there was a general
notion that EEG is chaotic, but nowadays there is a wide consensus and it is certainly no
longer generally accepted that the healthy EEG is a chaotic signal.
5. Graph Theory in EEG analysis
An alternative approach to the characterization of complex networks is the use of graph
theory (Strogatz 2001; Sporns, Chialvo et al. 2004; Sporns and Zwi 2004). A graph is a basic
representation of a network, which is essentially reduced to nodes (vertices) and
connections (edges) as illustrated in Fig. 4. Both local and long distance functional
connectivity in complex networks may alternatively be evaluated using measures and
visualizations derived from graph theory. Special interest in using graph theory to study
neural networks has been in focus recently, since it offers a unique perspective of studying
local and distributed brain interactions (Varela, Lachaux et al. 2001; Fingelkurts, Fingelkurts
et al. 2005).
Using the interdependence methods and measures analyzed in the previous sections one is
able to measure (in terms of 0 to 1) the coupling between different channels. If such
interdependence measures are constructed for every possible channel pair a coherence
matrix (CM) (i.e. 30x30, if 30 channels are used) with elements ranging from 0 to 1. Next, in
order to obtain a graph from a CM we need to convert it into an NxN binary adjacency
Fig. 4. A “healthy” network (left graph) appears to exhibit strong lateralization compared
to the “alcoholic” one (right graph) which exhibits interhemispheric symmetry, when the
broadband signals are analyzed.
matrix, A. To achieve that we define a variable called threshold T, such that
0,1T . The
value A(i,j) is either 1 or 0, indicating the presence or absence of an edge between nodes i
and j, respectively. Namely, A(i,j)=1 if C(i,j)≥T, otherwise A(i,j)=0. Thus we define a graph
for each value of T, i.e., for the purposes of our work, we defined 1000 such graphs, one for
every thousandth of T (Sakkalis et al., 2006a). After constructing A, one is able to compute
various properties of the resulting graph. These include the average degree K, the clustering
coefficient C and the average shortest path length L of our graph, which will be presented in
the next section. Figure 4 illustrates an example graph that resembles a “healthy” network
(left graph) compared to the “alcoholic” one, in both broadband and lower beta frequency
bands (Sakkalis et al., 2007).
Another study (Sakkalis et al., 2008b) was able to identify and visualize the established brain
networks in gamma band by means of both linear and nonlinear synchrony measures, in
working memory paradigm. The nonlinear GS method was initially applied on all the actual
electrode recordings. The scalp map obtained (Fig. 5a) identified a network tendency to
localize synchronization activity mostly at frontal and occipitoparietal regions. However, no
linking between the two regions is evident. When we focus on the independent components
(instead of the actual electrodes themselves), the prominent inter-region connectivity in
gamma band between the prefrontal and occipital brain areas becomes evident (Fig. 5b).
a
Fp1Fp2
F7F8
AF1AF2
Fz
F4 F3
FC6 FC5
FC2 FC1
T8 T7Cz C3C4
CP5CP6
CP1CP2
P3P4
Pz
P8 P7
PO2 PO1
O2 O1
AF7AF8
F5F6
FT7FT8
Fpz
FC4 FC3
C6 C5
F2 F1
TP8 TP7
AFz
CP3CP4
P5P6
C1C2
PO7PO8
FCz
POz
Oz
P2 P1
CPz
b
c
Fig. 5. a) Aerial view of the scalp with the position of electrodes. The depicted average
network reflects a local prefrontal and occipitoparietal synchrony, as identified in gamma
band using the nonlinear synchronization method on the actual electrode signals in a
working memory paradigm. The next parts of this figure (b, c) are considering cross-
regional synchrony. b) The nonlinear synchronization method is applied in gamma band
ICs reflecting the underlying activity in the different brain regions (prefrontal (upper node),
temporal (left and right lateral nodes), parietal (lower middle node) and occipital (lowest
central node)). This figure focuses on the inter-region connectivity between the prefrontal
and occipital brain areas. c) Similarly to the middle graph but using PDC; again ICs in
gamma band exhibit significant linear coupling between the prefrontal and occipital areas,
as well as between the occipital and parietal areas. Directionality is also identified. The
apparent bidirectional coupling indicates no single influence between the “cause” and
“effect” relationship. The illustrated graphs are averaged over all subjects.
Recent Advances in Biomedical Engineering512
Finally, a similar network topology is also derived by the linear PDC method (Fig. 5c). The
latter method is able to derive additional information on the “driver and response”
significant relationship between observations, denoted by arrows in Fig. 5c. However, the
bidirectional arrows denote no single one-way interconnection, but a significant pathway
connecting the prefrontal and occipital areas, as well as the occipital and parietal areas, is
identified (Fig. 5c).
Graph theory is for sure an emerging field in EEG analysis and coupling visualization.
Recent articles illustrate that graph properties maybe of particular value in certain
pathologies, i.e., alcoholism (Sakkalis et al., 2007) and Alzheimer disease (Stam, Jones et al.
2006).
6. Conclusion
Throughout this chapter both linear and nonlinear interdependence measures are discussed.
Even if the complex nature of EEG signals justify the use of nonlinear methods there is no
evidence to support and prejudge that such methods are superior to linear ones. On the
contrary, the information provided by nonlinear analysis does not necessarily coincide with
that of the linear methods. In fact, both approaches should be regarded as complementary in
the sense that they are able to assess different properties of interdependence between the
signals. In addition the linear ones most of the times appear to be robust against noise,
whereas nonlinear measures are found to be rather unstable. Stationarity is again a main
concern, since it is a prerequisite which is not satisfied in practice. The selection of an
adequate method will depend on the type of signal to be studied and on the questions
expected to be answered. One should also bear in mind that all nonlinear methods
presented require stationary signals. If this is not the case, one is better off using a linear
alternative like wavelet coherence, due to its inherent adaptive windowing scaling. Another
alternative is phase synchronization calculation, PLV method in specific, which requires
neither stationarity nor increases with amplitude covariance like coherence. In addition,
since phase-locking on its own is adequate to indicate brain lobe interactions, PLV is
superior because it is only based on the phase and does not consider the amplitude of the
signals. However, an interesting extension in identifying the most significant regions, in
terms of increased coherence, as compared to background signals is possible using the
significant wavelet coherence.
Visual ways to illustrate the results and possibly fuse them together are the topographic
maps and graphs. Topographic colour maps may be used in visualizing the power spectral-
based estimations, where different colourings reflect altering brain activity. In addition,
interdependencies may be illustrated using graph visualizations, where channel pairwise
coupling is visualized using edges of increasing thickness with respect to increasing
coupling strength.
As noted throughout this chapter most of the methods presented, traditional linear or
nonlinear, must assume some kind of stationarity. Therefore, changes in the dynamics
during the measurement period usually constitute an undesired complication of the
analysis, which in EEG may represent the most interesting structure in identifying
dynamical changes in the state of the brain. Hence, a fundamental topic for further research
should be the formation of a powerful test for stationarity able to indicate and reject, with
increased certainty, the sections of the EEG raw signal that experience stationary behavior.
Another active research direction focuses on extending current interdependence analysis
from bivariate to multivariate signals. This is important since pairwise analysis is likely to
find plasmatic correlations in special cases where one driver drives two responses. In this
case both responses may found to have a common driver component, even if the responses
might be fully independent.
7. References
Accardo A, Affinito M, Carrozzi M, Bouquet F. Use of the fractal dimension for the analysis
of EEG time series. Biol. Cybern. 1997; 77: 339-350.
Afraimovich VS, Verichev NN, Rabinovich MI. Stochastic synchronization of oscillations in
dissipative systems. Radiophys. Quantum Electron. 1986; 29: 795.
Andrzejak RG, Kraskov A, Stogbauer H, Mormann F, Kreuz T. Bivariate surrogate
techniques: necessity, strengths, and caveats. Phys. Rev. E 2003; 68: 066202.
Angelini L, de Tommaso M, Guido M, Hu K, Ivanov P, Marinazzo D, et al. Steady-state
visual evoked potentials and phase synchronization in migraine patients. Phys Rev
Lett 2004; 93: 038103.
Arnhold J, Lehnertz K, Grassberger P, Elger CE. A robust method for detecting
interdependences: Application to intracranially recorded EEG. Physica D 1999; 134:
419.
Baccala L, Sameshima K, Takahashi DY. Generalized partial directed coherence. 15th Intern.
Conf. Digital Signal Processing 2007, 163-166.
Baccala LA, Sameshima K. Partial directed coherence: a new concept in neural structure
determination. Biological Cybernetics 2001, 84(6): 463-474.
Bhattacharya J, Petsche H. Musicians and the gamma band: a secret affair? Neuroreport
2001; 12: 371-4.
Bendat JS, Piersol AG. Engineering applications of correlation and spectral analysis. New
York: J. Wiley, 1993.
Brazier MA. Spread of seizure discharges in epilepsy: anatomical and electrophysiological
considerations. Exp Neurol 1972; 36: 263-72.
Brazier MA, Casby JU. Cross-correlation and autocorrelation studies of
electroencephalographic potentials. Electroencephalogr Clin Neurophysiol Suppl
1952; 4: 201-11.
Cao L. Practical method for determining the minimum embedding dimension of a scalar
time series. Physica D 1997; 110: 43-50.
Dolan K. Surrogate analysis of multichannel data with frequency dependant time lag. Fluct.
Noise Lett. 2004; 4: L75-L81.
Dumermuth G, Molinari I. Relationships among signals: cross-spectral analysis of the EEG.
In: Weitkunat R, editor. Digital Biosignal Processing. Vol 5. Amsterdam: Elsevier
Science Publishers, 1991: 361-398.
Feldmann U, Bhattacharya J. Predictability improvement as an asymmetrical measure of
interdependence in bivariate time series. Int. J. of Bifurcation and Chaos 2004; 14:
505-514.
Fell J, Klaver P, Elfadil H, Schaller C, Elger CE, Fernandez G. Rhinal-hippocampal theta
coherence during declarative memory formation: interaction with gamma
synchronization? Eur J Neurosci 2003; 17: 1082-8.
Linear and Nonlinear Synchronization Analysis
and Visualization during Altered States of Consciousness 513
Finally, a similar network topology is also derived by the linear PDC method (Fig. 5c). The
latter method is able to derive additional information on the “driver and response”
significant relationship between observations, denoted by arrows in Fig. 5c. However, the
bidirectional arrows denote no single one-way interconnection, but a significant pathway
connecting the prefrontal and occipital areas, as well as the occipital and parietal areas, is
identified (Fig. 5c).
Graph theory is for sure an emerging field in EEG analysis and coupling visualization.
Recent articles illustrate that graph properties maybe of particular value in certain
pathologies, i.e., alcoholism (Sakkalis et al., 2007) and Alzheimer disease (Stam, Jones et al.
2006).
6. Conclusion
Throughout this chapter both linear and nonlinear interdependence measures are discussed.
Even if the complex nature of EEG signals justify the use of nonlinear methods there is no
evidence to support and prejudge that such methods are superior to linear ones. On the
contrary, the information provided by nonlinear analysis does not necessarily coincide with
that of the linear methods. In fact, both approaches should be regarded as complementary in
the sense that they are able to assess different properties of interdependence between the
signals. In addition the linear ones most of the times appear to be robust against noise,
whereas nonlinear measures are found to be rather unstable. Stationarity is again a main
concern, since it is a prerequisite which is not satisfied in practice. The selection of an
adequate method will depend on the type of signal to be studied and on the questions
expected to be answered. One should also bear in mind that all nonlinear methods
presented require stationary signals. If this is not the case, one is better off using a linear
alternative like wavelet coherence, due to its inherent adaptive windowing scaling. Another
alternative is phase synchronization calculation, PLV method in specific, which requires
neither stationarity nor increases with amplitude covariance like coherence. In addition,
since phase-locking on its own is adequate to indicate brain lobe interactions, PLV is
superior because it is only based on the phase and does not consider the amplitude of the
signals. However, an interesting extension in identifying the most significant regions, in
terms of increased coherence, as compared to background signals is possible using the
significant wavelet coherence.
Visual ways to illustrate the results and possibly fuse them together are the topographic
maps and graphs. Topographic colour maps may be used in visualizing the power spectral-
based estimations, where different colourings reflect altering brain activity. In addition,
interdependencies may be illustrated using graph visualizations, where channel pairwise
coupling is visualized using edges of increasing thickness with respect to increasing
coupling strength.
As noted throughout this chapter most of the methods presented, traditional linear or
nonlinear, must assume some kind of stationarity. Therefore, changes in the dynamics
during the measurement period usually constitute an undesired complication of the
analysis, which in EEG may represent the most interesting structure in identifying
dynamical changes in the state of the brain. Hence, a fundamental topic for further research
should be the formation of a powerful test for stationarity able to indicate and reject, with
increased certainty, the sections of the EEG raw signal that experience stationary behavior.
Another active research direction focuses on extending current interdependence analysis
from bivariate to multivariate signals. This is important since pairwise analysis is likely to
find plasmatic correlations in special cases where one driver drives two responses. In this
case both responses may found to have a common driver component, even if the responses
might be fully independent.
7. References
Accardo A, Affinito M, Carrozzi M, Bouquet F. Use of the fractal dimension for the analysis
of EEG time series. Biol. Cybern. 1997; 77: 339-350.
Afraimovich VS, Verichev NN, Rabinovich MI. Stochastic synchronization of oscillations in
dissipative systems. Radiophys. Quantum Electron. 1986; 29: 795.
Andrzejak RG, Kraskov A, Stogbauer H, Mormann F, Kreuz T. Bivariate surrogate
techniques: necessity, strengths, and caveats. Phys. Rev. E 2003; 68: 066202.
Angelini L, de Tommaso M, Guido M, Hu K, Ivanov P, Marinazzo D, et al. Steady-state
visual evoked potentials and phase synchronization in migraine patients. Phys Rev
Lett 2004; 93: 038103.
Arnhold J, Lehnertz K, Grassberger P, Elger CE. A robust method for detecting
interdependences: Application to intracranially recorded EEG. Physica D 1999; 134:
419.
Baccala L, Sameshima K, Takahashi DY. Generalized partial directed coherence. 15th Intern.
Conf. Digital Signal Processing 2007, 163-166.
Baccala LA, Sameshima K. Partial directed coherence: a new concept in neural structure
determination. Biological Cybernetics 2001, 84(6): 463-474.
Bhattacharya J, Petsche H. Musicians and the gamma band: a secret affair? Neuroreport
2001; 12: 371-4.
Bendat JS, Piersol AG. Engineering applications of correlation and spectral analysis. New
York: J. Wiley, 1993.
Brazier MA. Spread of seizure discharges in epilepsy: anatomical and electrophysiological
considerations. Exp Neurol 1972; 36: 263-72.
Brazier MA, Casby JU. Cross-correlation and autocorrelation studies of
electroencephalographic potentials. Electroencephalogr Clin Neurophysiol Suppl
1952; 4: 201-11.
Cao L. Practical method for determining the minimum embedding dimension of a scalar
time series. Physica D 1997; 110: 43-50.
Dolan K. Surrogate analysis of multichannel data with frequency dependant time lag. Fluct.
Noise Lett. 2004; 4: L75-L81.
Dumermuth G, Molinari I. Relationships among signals: cross-spectral analysis of the EEG.
In: Weitkunat R, editor. Digital Biosignal Processing. Vol 5. Amsterdam: Elsevier
Science Publishers, 1991: 361-398.
Feldmann U, Bhattacharya J. Predictability improvement as an asymmetrical measure of
interdependence in bivariate time series. Int. J. of Bifurcation and Chaos 2004; 14:
505-514.
Fell J, Klaver P, Elfadil H, Schaller C, Elger CE, Fernandez G. Rhinal-hippocampal theta
coherence during declarative memory formation: interaction with gamma
synchronization? Eur J Neurosci 2003; 17: 1082-8.
Recent Advances in Biomedical Engineering514
Fell J, Klaver P, Lehnertz K, Grunwald T, Schaller C, Elger CE, et al. Human memory
formation is accompanied by rhinal-hippocampal coupling and decoupling. Nat
Neurosci 2001; 4: 1259-64.
Fell J, Roschke J, Beckmann P. Deterministic chaos and the first positive Lyapunov
exponent: a nonlinear analysis of the human electroencephalogram during sleep.
Biol Cybern 1993; 69: 139-46.
Fingelkurts AA, Fingelkurts AA, Kahkonen S. Functional connectivity in the brain is it an
elusive concept? Neurosci Biobehav Rev 2005; 28: 827-36.
French CC, Beaumont JG. A critical review of EEG coherence studies of hemisphere
function. Int J Psychophysiol 1984; 1: 241-54.
Friston KJ, Stephan KM, Frackowiak RSJ. Transient phase-locking and dynamic correlations:
Are they the same thing? Human Brain Mapping 1997; 5: 48-57.
Fujisaka H, Yamada T. Stability theory of synchronized motion in coupled dynamical
systems. Prog. Theor. Phys. 1983; 69: 32-47.
Gallez D, Babloyantz A. Predictability of human EEG: a dynamical approach. Biol. Cybern.
1991; 64: 381-391.
Garcia Dominguez L, Wennberg RA, Gaetz W, Cheyne D, Snead OCa, Perez Velazquez JL.
Enhanced synchrony in epileptiform activity? Local versus distant phase
synchronization in generalized seizures. J Neurosci 2005; 25: 8077-8084.
Gevins AS. Overview of computer analysis. In: Gevins AS and Rémond A, editors.
Handbook of electroencephalography and clinical neurophysiology ; rev. ser., v. 1.
Vol I. NY, USA: Elsevier, 1987: 31-83.
Granger J. Investigating causal relations by econometric models and cross-spectral methods.
Econometrica 1969, 37(3): 424-438.
Gregson RA, Britton LA, Campbell EA, Gates GR. Comparisons of the nonlinear dynamics
of electroencephalograms under various task loading conditions: a preliminary
report. Biol Psychol 1990; 31: 173-91.
Grinsted A, Moore JC, Jevrejeva S. Application of the cross wavelet transform and wavelet
coherence to geophysical time series. Nonlinear Processes in Geophysics 2004; 11:
561-566.
Guevara MA, Lorenzo I, Arce C, Ramos J, Corsi-Cabrera M. Inter- and intrahemispheric
EEG correlation during sleep and wakefulness. Sleep 1995; 18: 257-65.
Hunt BR, Ott E, Yorke JA. Differentiable generalized synchronization of chaos. Phys. Rev. E
1997; 55: 4029-4034.
Huygens C. Horoloquium Oscilatorium. Paris, 1673.
Jenkins GM, Watts DG. Spectral Analysis and Its Applications. San Francisco, CA: Holden-
Day, Inc., 1968.
Koskinen M, Seppanen T, Tuukkanen J, Yli-Hankala A, Jantti V. Propofol anesthesia induces
phase synchronization changes in EEG. Clin Neurophysiol 2001; 112: 386-92.
Lachaux JP, Lutz A, Rudrauf D, Cosmelli D, Le Van Quyen M, Martinerie J, et al. Estimating
the time-course of coherence between single-trial brain signals: an introduction to
wavelet coherence. Neurophysiol Clin 2002; 32: 157-74.
Lachaux JP, Rodriguez E, Martinerie J, Varela FJ. Measuring phase synchrony in brain
signals. Hum Brain Mapp 1999; 8: 194-208.
Lehnertz K, Arnhold J, Grassberger P, Elger C. Chaos in Brain? World Scientific. Singapore,
2000.
Le Van Quyen M, Soss J, Navarro V, Robertson R, Chavez M, Baulac M, et al. Preictal state
identification by synchronization changes in long-term intracranial EEG recordings.
Clin Neurophysiol 2005; 116: 559-68.
Lee D-S, Kye W-H, Rim S, Kwon T-Y, Kim C-M. Generalized phase synchronization in
unidirectionally coupled chaotic oscillators. Physical Review E 2003; 67: 045201.
Lopes da Silva FH. EEG Analysis: theory and practice. In: Niedermeyer E and Lopes da
Silva FH, editors. Electroencephalography : basic principles, clinical applications,
and related fields. Baltimore: Williams & Wilkins, 1999: 1097-1123.
Lorenz EN. Deterministic non-periodic flow. J. Atmos. Sci. 1963; 20: 130.
Lutzenberger W, Birbaumer N, Flor H, Rockstroh B, Elbert T. Dimensional analysis of the
human EEG and intelligence. Neurosci Lett 1992; 143: 10-4.
Mayer-Kress G, Layne S. Dimensionality of the human EEG. Annals New York Acad. Sci.
1987; 504: 62-87.
Mormann F, Lehnertz K, David P, Elger CE. Mean phase coherence as a measure for phase
synchronization and its application to the EEG of epilepsy patients. Phys. D 2000;
144: 358 369.
Niedermeyer E, Lopes da Silva FH. Electroencephalography : basic principles, clinical
applications, and related fields. Baltimore: Williams & Wilkins, 1999.
Nunez PL. Quantitative states of neocortex. In: Nunez PL, editor. Neocortical Dynamics and
Human EEG Rhythms. Oxford ; New York: Oxford University Press, 1995: 33-39.
Pecora LM, Carroll TL. Synchronization in chaotic systems. Phys. Rev. Lett. 1990; 64: 821.
Pereda E, Quiroga RQ, Bhattacharya J. Nonlinear multivariate analysis of
neurophysiological signals. Prog Neurobiol 2005; 77: 1-37.
Pikovsky A, Rosenblum M, Kurths J. Synchronization : a universal concept in nonlinear
sciences. Cambridge: Cambridge University Press, 2001.
Pikovsky AS. On the interaction of strange attractors. Z. Phys. B: Condens Matter 1984;
55(2): 149.
Pritchard W, Duke D. Dimensional analysis of no-task human EEG using the Grassberger-
Procaccia method. Psychophysiol. 1992; 29: 182-192.
Pyragas K. Weak and strong synchronization of chaos. Phys. Rev. E 1996; 54: 4508-4511.
Quian Quiroga R, Arnhold J, Grassberger P. Learning driver-response relationships from
synchronization patterns. Physical Review E 2000; 61: 5142.
Quian Quiroga R, Kraskov A, Kreuz T, Grassberger P. Performance of different
synchronization measures in real data: a case study on electroencephalographic
signals. Phys Rev E Stat Nonlin Soft Matter Phys 2002; 65: 041903.
Rosenblum MG, Pikovsky AS, Kurths J. Phase synchronization of chaotic oscillators.
Physical Review Letters 1996; 76: 1804-1807.
Ruelle D. Deterministic chaos: The science and the fiction. Proc. of the Royal Society of
London 1990; 427A: 241-248.
Rulkov NF, Sushchik MM, Tsimring LS, Abarbanel HDI. Generalized synchronization of
chaos in directionally coupled chaotic systems. Phys. Rev. E 1995; 51(2): 980-994.
Sakkalis V, Giurcăneanu CD, Xanthopoulos P, Zervakis M, Tsiaras V, Yang Y,
Micheloyannis S. Assessment of linear and nonlinear synchronization measures for
analyzing EEG in a mild epileptic paradigm. IEEE Trans. Inf. Tech. 2009; 13(4):433-
441 (DOI: 10.1109/TITB.2008.923141).
Linear and Nonlinear Synchronization Analysis
and Visualization during Altered States of Consciousness 515
Fell J, Klaver P, Lehnertz K, Grunwald T, Schaller C, Elger CE, et al. Human memory
formation is accompanied by rhinal-hippocampal coupling and decoupling. Nat
Neurosci 2001; 4: 1259-64.
Fell J, Roschke J, Beckmann P. Deterministic chaos and the first positive Lyapunov
exponent: a nonlinear analysis of the human electroencephalogram during sleep.
Biol Cybern 1993; 69: 139-46.
Fingelkurts AA, Fingelkurts AA, Kahkonen S. Functional connectivity in the brain is it an
elusive concept? Neurosci Biobehav Rev 2005; 28: 827-36.
French CC, Beaumont JG. A critical review of EEG coherence studies of hemisphere
function. Int J Psychophysiol 1984; 1: 241-54.
Friston KJ, Stephan KM, Frackowiak RSJ. Transient phase-locking and dynamic correlations:
Are they the same thing? Human Brain Mapping 1997; 5: 48-57.
Fujisaka H, Yamada T. Stability theory of synchronized motion in coupled dynamical
systems. Prog. Theor. Phys. 1983; 69: 32-47.
Gallez D, Babloyantz A. Predictability of human EEG: a dynamical approach. Biol. Cybern.
1991; 64: 381-391.
Garcia Dominguez L, Wennberg RA, Gaetz W, Cheyne D, Snead OCa, Perez Velazquez JL.
Enhanced synchrony in epileptiform activity? Local versus distant phase
synchronization in generalized seizures. J Neurosci 2005; 25: 8077-8084.
Gevins AS. Overview of computer analysis. In: Gevins AS and Rémond A, editors.
Handbook of electroencephalography and clinical neurophysiology ; rev. ser., v. 1.
Vol I. NY, USA: Elsevier, 1987: 31-83.
Granger J. Investigating causal relations by econometric models and cross-spectral methods.
Econometrica 1969, 37(3): 424-438.
Gregson RA, Britton LA, Campbell EA, Gates GR. Comparisons of the nonlinear dynamics
of electroencephalograms under various task loading conditions: a preliminary
report. Biol Psychol 1990; 31: 173-91.
Grinsted A, Moore JC, Jevrejeva S. Application of the cross wavelet transform and wavelet
coherence to geophysical time series. Nonlinear Processes in Geophysics 2004; 11:
561-566.
Guevara MA, Lorenzo I, Arce C, Ramos J, Corsi-Cabrera M. Inter- and intrahemispheric
EEG correlation during sleep and wakefulness. Sleep 1995; 18: 257-65.
Hunt BR, Ott E, Yorke JA. Differentiable generalized synchronization of chaos. Phys. Rev. E
1997; 55: 4029-4034.
Huygens C. Horoloquium Oscilatorium. Paris, 1673.
Jenkins GM, Watts DG. Spectral Analysis and Its Applications. San Francisco, CA: Holden-
Day, Inc., 1968.
Koskinen M, Seppanen T, Tuukkanen J, Yli-Hankala A, Jantti V. Propofol anesthesia induces
phase synchronization changes in EEG. Clin Neurophysiol 2001; 112: 386-92.
Lachaux JP, Lutz A, Rudrauf D, Cosmelli D, Le Van Quyen M, Martinerie J, et al. Estimating
the time-course of coherence between single-trial brain signals: an introduction to
wavelet coherence. Neurophysiol Clin 2002; 32: 157-74.
Lachaux JP, Rodriguez E, Martinerie J, Varela FJ. Measuring phase synchrony in brain
signals. Hum Brain Mapp 1999; 8: 194-208.
Lehnertz K, Arnhold J, Grassberger P, Elger C. Chaos in Brain? World Scientific. Singapore,
2000.
Le Van Quyen M, Soss J, Navarro V, Robertson R, Chavez M, Baulac M, et al. Preictal state
identification by synchronization changes in long-term intracranial EEG recordings.
Clin Neurophysiol 2005; 116: 559-68.
Lee D-S, Kye W-H, Rim S, Kwon T-Y, Kim C-M. Generalized phase synchronization in
unidirectionally coupled chaotic oscillators. Physical Review E 2003; 67: 045201.
Lopes da Silva FH. EEG Analysis: theory and practice. In: Niedermeyer E and Lopes da
Silva FH, editors. Electroencephalography : basic principles, clinical applications,
and related fields. Baltimore: Williams & Wilkins, 1999: 1097-1123.
Lorenz EN. Deterministic non-periodic flow. J. Atmos. Sci. 1963; 20: 130.
Lutzenberger W, Birbaumer N, Flor H, Rockstroh B, Elbert T. Dimensional analysis of the
human EEG and intelligence. Neurosci Lett 1992; 143: 10-4.
Mayer-Kress G, Layne S. Dimensionality of the human EEG. Annals New York Acad. Sci.
1987; 504: 62-87.
Mormann F, Lehnertz K, David P, Elger CE. Mean phase coherence as a measure for phase
synchronization and its application to the EEG of epilepsy patients. Phys. D 2000;
144: 358 369.
Niedermeyer E, Lopes da Silva FH. Electroencephalography : basic principles, clinical
applications, and related fields. Baltimore: Williams & Wilkins, 1999.
Nunez PL. Quantitative states of neocortex. In: Nunez PL, editor. Neocortical Dynamics and
Human EEG Rhythms. Oxford ; New York: Oxford University Press, 1995: 33-39.
Pecora LM, Carroll TL. Synchronization in chaotic systems. Phys. Rev. Lett. 1990; 64: 821.
Pereda E, Quiroga RQ, Bhattacharya J. Nonlinear multivariate analysis of
neurophysiological signals. Prog Neurobiol 2005; 77: 1-37.
Pikovsky A, Rosenblum M, Kurths J. Synchronization : a universal concept in nonlinear
sciences. Cambridge: Cambridge University Press, 2001.
Pikovsky AS. On the interaction of strange attractors. Z. Phys. B: Condens Matter 1984;
55(2): 149.
Pritchard W, Duke D. Dimensional analysis of no-task human EEG using the Grassberger-
Procaccia method. Psychophysiol. 1992; 29: 182-192.
Pyragas K. Weak and strong synchronization of chaos. Phys. Rev. E 1996; 54: 4508-4511.
Quian Quiroga R, Arnhold J, Grassberger P. Learning driver-response relationships from
synchronization patterns. Physical Review E 2000; 61: 5142.
Quian Quiroga R, Kraskov A, Kreuz T, Grassberger P. Performance of different
synchronization measures in real data: a case study on electroencephalographic
signals. Phys Rev E Stat Nonlin Soft Matter Phys 2002; 65: 041903.
Rosenblum MG, Pikovsky AS, Kurths J. Phase synchronization of chaotic oscillators.
Physical Review Letters 1996; 76: 1804-1807.
Ruelle D. Deterministic chaos: The science and the fiction. Proc. of the Royal Society of
London 1990; 427A: 241-248.
Rulkov NF, Sushchik MM, Tsimring LS, Abarbanel HDI. Generalized synchronization of
chaos in directionally coupled chaotic systems. Phys. Rev. E 1995; 51(2): 980-994.
Sakkalis V, Giurcăneanu CD, Xanthopoulos P, Zervakis M, Tsiaras V, Yang Y,
Micheloyannis S. Assessment of linear and nonlinear synchronization measures for
analyzing EEG in a mild epileptic paradigm. IEEE Trans. Inf. Tech. 2009; 13(4):433-
441 (DOI: 10.1109/TITB.2008.923141).
Recent Advances in Biomedical Engineering516
Sakkalis V, Oikonomou T, Pachou E, Tollis I, Micheloyannis S, Zervakis M. Time-significant
Wavelet Coherence for the Evaluation of Schizophrenic Brain Activity using a
Graph theory approach. Engineering in Medicine and Biology Society (EMBC
2006). New York, USA, 2006a.
Sakkalis V, Zervakis M, Micheloyannis S. Significant EEG Features Involved in
Mathematical Reasoning: Evidence from Wavelet Analysis. Brain Topography
2006b; 19: 53-60.
Sakkalis V, Cassar T, Zervakis M, Camilleri KP, Fabri SG, Bigan C, Karakonstantaki E,
Micheloyannis S. Time-Frequency Analysis and Modelling of EEGs for the
evaluation of EEG activity in Young Children with controlled epilepsy. Comput
Intell Neurosci. CIN 2008a: 462593 (DOI: 10.1155/2008/462593).
Sakkalis V, Tsiaras V, Michalopoulos K, Zervakis M. Assessment of neural dynamic
coupling and causal interactions between independent EEG components from
cognitive tasks using linear and nonlinear methods. 30th IEEE-EMBS, Engineering
in Medicine and Biology Society (EMBC 2008), Vancouver, Canada, August 20-24.
2008b.
Sakkalis V, Tsiaras V, Zervakis M, Tollis I. Optimal brain network synchrony visualization:
Application in an alcoholism paradigm. 29th IEEE-EMBS, Engineering in Medicine
and Biology Society (EMBC 2007), Lyon, France, August 23-26, 2007.
Schiff SJ, So P, Chang T, Burke RE, Sauer T. Detecting dynamical interdependence and
generalized synchrony through mutual prediction in a neural ensemble. Physical
Review E 1996; 54: 6708.
Schmitz A. Measuring statistical dependence and coupling of subsystems. Physical Review
E 2000; 62: 7508.
Schnitzler A, Gross J. Normal and pathological oscillatory communication in the brain. Nat
Rev Neurosci 2005; 6: 285-96.
Schreiber T. Constrained randomization of time series data. Phys. Rev. Lett. 1998; 80: 2105-
2108.
Schreiber T, Schmitz A. Improved surrogate data for nonlinearity tests. Phys. Rev. Lett.
1996; 77: 635-638.
Schreiber T, Schmitz A. Surrogate time series. Physica, D 2000; 142: 346-382.
Shaw JC. An introduction to the coherence function and its use in EEG signal analysis. J
Med Eng Technol 1981; 5: 279-88.
Shaw JC. Correlation and coherence analysis of the EEG: a selective tutorial review. Int J
Psychophysiol 1984; 1: 255-66.
Soong A, Stuart C. Evidence of chaotic dynamics underlying the human alpharhythm
electroencephalogram. Biol. Cybern. 1989; 42: 55-62.
Sporns O, Chialvo DR, Kaiser M, Hilgetag CC. Organization, development and function of
complex brain networks. Trends Cogn Sci 2004; 8: 418-25.
Sporns O, Zwi JD. The small world of the cerebral cortex. Neuroinformatics 2004; 2: 145-62.
Stam CJ. Nonlinear dynamical analysis of EEG and MEG: review of an emerging field. Clin
Neurophysiol 2005; 116: 2266-301.
Stam CJ, Jones BF, Nolte G, Breakspear M, Scheltens P. Small-World Networks and
Functional Connectivity in Alzheimer's Disease. Cereb Cortex 2006.
Stam CJ, van Dijk BW. Synchronization likelihood: an unbiased measure of generalized
synchronization in multivariate data sets. Physica D: Nonlinear Phenomena 2002;
163: 236-251.
Strogatz SH. Exploring complex networks. Nature 2001; 410: 268-76.
Takens F. Detecting strange attractors in turbulence. In: Rand D and Young L, editors.
Dynamical Systems and Turbulence. Vol 898. Warwick: Springer-Verlag, 1980: 366-
381.
Tallon-Baudry C, Bertrand O, Fischer C. Oscillatory synchrony between human extrastriate
areas during visual short-term memory maintenance. J Neurosci 2001; 21: RC177.
Terry J, Breakspear M. An improved algorithm for the detection of dynamical
interdependence in bivariate time-series. Biol Cybern. 2003; 88: 129-136.
Thatcher RW, Krause PJ, Hrybyk M. Cortico-cortical associations and EEG coherence: a two-
compartmental model. Electroencephalogr. Clin. Neurophysiol. 1986; 64: 123-143.
Theiler J. Spurious dimension from correlation algorithms applied to limited time-series
data. Phys. Rev. A 1986; 34: 2427.
Theiler J, Eubank S, Longtin A, Galdrikian B, Farmer J. Testing for nonlinearity in time
series: the method of surrogate data. Physica D 1992; 58: 77-94.
Theiler J, Rapp P. Re-examination of the evidence for low-dimensional, nonlinear structure
in the human EEG. Electroenceph. Clin. Neurophysiol. 1996; 98: 213-222.
Tononi G, Edelman GM. Consciousness and complexity. Science 1998; 282: 1846-51.
Torrence C, Compo G. A practical Guide to Wavelet Analysis. Bull. Am. Meteorol. Soc. 1998;
79: 61-78.
Trujillo LT, Peterson MA, Kaszniak AW, Allen JJ. EEG phase synchrony differences across
visual perception conditions may depend on recording and analysis methods. Clin
Neurophysiol 2005; 116: 172-89.
Varela F, Lachaux JP, Rodriguez E, Martinerie J. The brainweb: phase synchronization and
large-scale integration. Nat Rev Neurosci 2001; 2: 229-39.
Zaveri HP, Williams WJ, Sackellares JC, Beydoun A, Duckrow RB, Spencer SS. Measuring
the coherence of intracranial electroencephalograms. Clin. Neurophysiol. 1999; 110:
1717-1725.
Zheng Z, Hu G. Generalized synchronization versus phase synchronization. Phys. Rev. E
2000; 62: 7882-7885.
Linear and Nonlinear Synchronization Analysis
and Visualization during Altered States of Consciousness 517
Sakkalis V, Oikonomou T, Pachou E, Tollis I, Micheloyannis S, Zervakis M. Time-significant
Wavelet Coherence for the Evaluation of Schizophrenic Brain Activity using a
Graph theory approach. Engineering in Medicine and Biology Society (EMBC
2006). New York, USA, 2006a.
Sakkalis V, Zervakis M, Micheloyannis S. Significant EEG Features Involved in
Mathematical Reasoning: Evidence from Wavelet Analysis. Brain Topography
2006b; 19: 53-60.
Sakkalis V, Cassar T, Zervakis M, Camilleri KP, Fabri SG, Bigan C, Karakonstantaki E,
Micheloyannis S. Time-Frequency Analysis and Modelling of EEGs for the
evaluation of EEG activity in Young Children with controlled epilepsy. Comput
Intell Neurosci. CIN 2008a: 462593 (DOI: 10.1155/2008/462593).
Sakkalis V, Tsiaras V, Michalopoulos K, Zervakis M. Assessment of neural dynamic
coupling and causal interactions between independent EEG components from
cognitive tasks using linear and nonlinear methods. 30th IEEE-EMBS, Engineering
in Medicine and Biology Society (EMBC 2008), Vancouver, Canada, August 20-24.
2008b.
Sakkalis V, Tsiaras V, Zervakis M, Tollis I. Optimal brain network synchrony visualization:
Application in an alcoholism paradigm. 29th IEEE-EMBS, Engineering in Medicine
and Biology Society (EMBC 2007), Lyon, France, August 23-26, 2007.
Schiff SJ, So P, Chang T, Burke RE, Sauer T. Detecting dynamical interdependence and
generalized synchrony through mutual prediction in a neural ensemble. Physical
Review E 1996; 54: 6708.
Schmitz A. Measuring statistical dependence and coupling of subsystems. Physical Review
E 2000; 62: 7508.
Schnitzler A, Gross J. Normal and pathological oscillatory communication in the brain. Nat
Rev Neurosci 2005; 6: 285-96.
Schreiber T. Constrained randomization of time series data. Phys. Rev. Lett. 1998; 80: 2105-
2108.
Schreiber T, Schmitz A. Improved surrogate data for nonlinearity tests. Phys. Rev. Lett.
1996; 77: 635-638.
Schreiber T, Schmitz A. Surrogate time series. Physica, D 2000; 142: 346-382.
Shaw JC. An introduction to the coherence function and its use in EEG signal analysis. J
Med Eng Technol 1981; 5: 279-88.
Shaw JC. Correlation and coherence analysis of the EEG: a selective tutorial review. Int J
Psychophysiol 1984; 1: 255-66.
Soong A, Stuart C. Evidence of chaotic dynamics underlying the human alpharhythm
electroencephalogram. Biol. Cybern. 1989; 42: 55-62.
Sporns O, Chialvo DR, Kaiser M, Hilgetag CC. Organization, development and function of
complex brain networks. Trends Cogn Sci 2004; 8: 418-25.
Sporns O, Zwi JD. The small world of the cerebral cortex. Neuroinformatics 2004; 2: 145-62.
Stam CJ. Nonlinear dynamical analysis of EEG and MEG: review of an emerging field. Clin
Neurophysiol 2005; 116: 2266-301.
Stam CJ, Jones BF, Nolte G, Breakspear M, Scheltens P. Small-World Networks and
Functional Connectivity in Alzheimer's Disease. Cereb Cortex 2006.
Stam CJ, van Dijk BW. Synchronization likelihood: an unbiased measure of generalized
synchronization in multivariate data sets. Physica D: Nonlinear Phenomena 2002;
163: 236-251.
Strogatz SH. Exploring complex networks. Nature 2001; 410: 268-76.
Takens F. Detecting strange attractors in turbulence. In: Rand D and Young L, editors.
Dynamical Systems and Turbulence. Vol 898. Warwick: Springer-Verlag, 1980: 366-
381.
Tallon-Baudry C, Bertrand O, Fischer C. Oscillatory synchrony between human extrastriate
areas during visual short-term memory maintenance. J Neurosci 2001; 21: RC177.
Terry J, Breakspear M. An improved algorithm for the detection of dynamical
interdependence in bivariate time-series. Biol Cybern. 2003; 88: 129-136.
Thatcher RW, Krause PJ, Hrybyk M. Cortico-cortical associations and EEG coherence: a two-
compartmental model. Electroencephalogr. Clin. Neurophysiol. 1986; 64: 123-143.
Theiler J. Spurious dimension from correlation algorithms applied to limited time-series
data. Phys. Rev. A 1986; 34: 2427.
Theiler J, Eubank S, Longtin A, Galdrikian B, Farmer J. Testing for nonlinearity in time
series: the method of surrogate data. Physica D 1992; 58: 77-94.
Theiler J, Rapp P. Re-examination of the evidence for low-dimensional, nonlinear structure
in the human EEG. Electroenceph. Clin. Neurophysiol. 1996; 98: 213-222.
Tononi G, Edelman GM. Consciousness and complexity. Science 1998; 282: 1846-51.
Torrence C, Compo G. A practical Guide to Wavelet Analysis. Bull. Am. Meteorol. Soc. 1998;
79: 61-78.
Trujillo LT, Peterson MA, Kaszniak AW, Allen JJ. EEG phase synchrony differences across
visual perception conditions may depend on recording and analysis methods. Clin
Neurophysiol 2005; 116: 172-89.
Varela F, Lachaux JP, Rodriguez E, Martinerie J. The brainweb: phase synchronization and
large-scale integration. Nat Rev Neurosci 2001; 2: 229-39.
Zaveri HP, Williams WJ, Sackellares JC, Beydoun A, Duckrow RB, Spencer SS. Measuring
the coherence of intracranial electroencephalograms. Clin. Neurophysiol. 1999; 110:
1717-1725.
Zheng Z, Hu G. Generalized synchronization versus phase synchronization. Phys. Rev. E
2000; 62: 7882-7885.
Recent Advances in Biomedical Engineering518
RFId technologies for the hospital. How to choose the right one and plan the right solution? 519
RFId technologies for the hospital. How to choose the right one and plan
the right solution?
Ernesto Iadanza
X
RFId technologies for the hospital. How to
choose the right one and plan
the right solution?
Ernesto Iadanza
Department of Electronics and Telecommunications – Università degli Studi di Firenze
Italy
1. Introduction
RFId is an acronym for Radio Frequency Identification. Many different technologies are
gathered under this abbreviation, each optimized for some particular tasks. Factories can
take advantage of RFId for managing and optimizing their supply-chains, inspecting the
content of a pack without actually opening it. Stores use RFId as a substitute to barcode
labels because it works even without any lines of sight. Many offices and car parks use some
RFId based solutions to allow the access for authorized people only. Recently, RFId
technology has been used to implement fast and secure payment services, using disposable
wristbands that stop functioning once removed from the wrist and cannot be put back
together.
Besides military systems, the first spread use of RFId technology dates back to the late 1960s,
when the first Electronic Article Surveillance (EAS) systems where implemented against
shopliftings. They were based on simple transponders transmitting a single bit just to signal
their presence.
We must wait for the 1990s to see some modern RFId equipments, thanks to the great
miniaturization of the electronics and to the resulting reduced power requirements.
Nowadays, also the healthcare world is rapidly approaching to RFId, both for increasing the
automation level and for reducing the overall clinical risk for patients. Following, a few
examples.
Passive RFId tags are used on surgical tools to read the composition of a sterile surgical kit
prior to start the operation.
RFId wristbands can be worn by patients for reducing identification errors and for tracking
their therapies or treatments. If the wristbands are equipped with active RFId tags, the
patient position inside the hospital can also be easily monitored and tracked: this is
particularly useful to caregivers for managing children or patients with reduced cognitive
functions.
Blood transfusion errors can be heavily reduced by using RFId in the blood supply chain:
patients and bags of blood can be tagged to make sure every patient receives the right blood
product.
26
Recent Advances in Biomedical Engineering520
Similarly, the pharmaceutical supply chain could take advantage of RFId technology both
for replacing barcodes and for implementing single-dose delivery automated systems.
2. RFId technology
An RFId system is typically composed by at least two components: tag and reader. In the
simplest functioning mode, when the reader “wakes up” the tag (forward link), this
responds by transmitting its own unique ID code (reverse link). If the tag is passive, i.e. is
not provided with a battery power, the reader itself must energize the tag. The
communication between the reader and the tag can hence be only initiated by the reader.
Fig. 1. A simple RFId system
A simple reader can be made by the following parts:
- rx/tx antenna
- modulator, used to query or to transfer data to the tag
- demodulator, to decode the received data
- control unit, a microcontroller used to manage the link with the tag and to transfer the
read data to some external devices like a PC
- power adaptor or battery
The tag, or transponder, incorporates at least the following four components:
- antenna, used both to receive the power by the reader (if the tag is not provided with
a battery) and to exchange data with the reader
- microchip, that is used to manage the data link implementing the desired protocol,
frequency and modulation.
- memory (sometimes internal to the microchip)
- package, that keeps together and protects all the components; this part can be very
variant depending on the intended use of the tag (labels, wristbands, glass cylinders,
etc.)
The tag types are usually classified basing upon their powering modes: passive, semi-
passive and active tags.
2.1 Passive tags
Passive tags are fed directly by the reader. This can be achieved by using an inductive
coupling (LF or HF) or even a backscatter coupling (UHF).
In the first case, both the reader and the tag are provided with coil antennas. The inductive
coupling between the two antennas, assimilable to the primary and the secondary coils in an
electric transformer, transfers energy to the tag for the operation of the microchip. This can
happen if the two devices are close enough: the tag must be within 0.16 meters from the
reader’s antenna in order to be in the near field region. Typical frequencies used are 13.56
MHz and 135KHz, hence the wavelengths are much greater than the distance between the
reader's coil antenna and the tag (22.109 m for 13.56 MHz; 2220.7 m for 135 KHz systems).
Therefore the electro-magnetic field may be treated as a simple magnetic alternating field.
An alternate voltage is generated by induction in the tag’s coil antenna leadings, and is then
rectified by means of a simple diode and used to power up to the microchip. The antenna
coil inductance is used, together with a capacitor connected in parallel, to obtain an LC
parallel resonant circuit. The resonant frequency is chosen same as the reader’s transmission
frequency.
The reverse link communication is obtained modulating the voltage of the tag’s antenna by
switching on and off a load resistance with a very high frequency f
S
(load modulation). These
controlled variations create two spectral lines at a distance of ± f
S
around the transmission
frequency of the reader and are reflected as an amplitude modulation of the subcarrier f
S
to
the “primary coil” on the reader. This method can be used to send back data from the
transponder to the reader. [www.rfid-handbook.com]
Fig. 2. Inductive coupling (LF and HF)
RFId technologies for the hospital. How to choose the right one and plan the right solution? 521
Similarly, the pharmaceutical supply chain could take advantage of RFId technology both
for replacing barcodes and for implementing single-dose delivery automated systems.
2. RFId technology
An RFId system is typically composed by at least two components: tag and reader. In the
simplest functioning mode, when the reader “wakes up” the tag (forward link), this
responds by transmitting its own unique ID code (reverse link). If the tag is passive, i.e. is
not provided with a battery power, the reader itself must energize the tag. The
communication between the reader and the tag can hence be only initiated by the reader.
Fig. 1. A simple RFId system
A simple reader can be made by the following parts:
- rx/tx antenna
- modulator, used to query or to transfer data to the tag
- demodulator, to decode the received data
- control unit, a microcontroller used to manage the link with the tag and to transfer the
read data to some external devices like a PC
- power adaptor or battery
The tag, or transponder, incorporates at least the following four components:
- antenna, used both to receive the power by the reader (if the tag is not provided with
a battery) and to exchange data with the reader
- microchip, that is used to manage the data link implementing the desired protocol,
frequency and modulation.
- memory (sometimes internal to the microchip)
- package, that keeps together and protects all the components; this part can be very
variant depending on the intended use of the tag (labels, wristbands, glass cylinders,
etc.)
The tag types are usually classified basing upon their powering modes: passive, semi-
passive and active tags.
2.1 Passive tags
Passive tags are fed directly by the reader. This can be achieved by using an inductive
coupling (LF or HF) or even a backscatter coupling (UHF).
In the first case, both the reader and the tag are provided with coil antennas. The inductive
coupling between the two antennas, assimilable to the primary and the secondary coils in an
electric transformer, transfers energy to the tag for the operation of the microchip. This can
happen if the two devices are close enough: the tag must be within 0.16 meters from the
reader’s antenna in order to be in the near field region. Typical frequencies used are 13.56
MHz and 135KHz, hence the wavelengths are much greater than the distance between the
reader's coil antenna and the tag (22.109 m for 13.56 MHz; 2220.7 m for 135 KHz systems).
Therefore the electro-magnetic field may be treated as a simple magnetic alternating field.
An alternate voltage is generated by induction in the tag’s coil antenna leadings, and is then
rectified by means of a simple diode and used to power up to the microchip. The antenna
coil inductance is used, together with a capacitor connected in parallel, to obtain an LC
parallel resonant circuit. The resonant frequency is chosen same as the reader’s transmission
frequency.
The reverse link communication is obtained modulating the voltage of the tag’s antenna by
switching on and off a load resistance with a very high frequency f
S
(load modulation). These
controlled variations create two spectral lines at a distance of ± f
S
around the transmission
frequency of the reader and are reflected as an amplitude modulation of the subcarrier f
S
to
the “primary coil” on the reader. This method can be used to send back data from the
transponder to the reader. [www.rfid-handbook.com
]
Fig. 2. Inductive coupling (LF and HF)
Recent Advances in Biomedical Engineering522
UHF passive RFId systems use dipole antennas both on the tag and on the reader. The
typical work frequencies are 868MHz (EU), 915MHz (US) and above (microwave). Since the
higher is the frequency the smaller is the wavelength, these system make it simple to design
smaller antennas. These are called long-range systems since the distance between the reader
and the tag can be greater than 1m. The tag is fed by the reader using electromagnetic
coupling.
A backscattering phenomenon is used to allow the tag to perform the reverse link. Here is
how it works: a fraction of the power that comes from the reader is reflected by the
transponder dipole antenna back to the reader depending on the tag’s antenna reflection
cross-section. This characteristic parameter can be altered by switching on and off a load
resistor connected in parallel to the transponder antenna. You can take advantage of this
phenomenon to transmit data from the tag to the reader by modulating the power fraction
reflected back.
Fig. 3. Backscattering coupling (UHF)
2.2 Semi-passive tags
These tags are in all similar to passive ones, but are provided with an onboard battery used
for feeding some sensors (accelerometers, temperature sensors, pressure sensors, etc.).
Anyway, the battery is not used to feed the tag microchip or antenna; this means that these
transponders cannot start a communication autonomously. The reliability is of course
affected by the presence of the battery itself.
2.3 Active tags
An RFID tag is called “active” when it is equipped with a battery, to be used to feed the tag's
microchip and antenna and also as a source of power for onboard sensors. These tags are
proper transceivers, therefore they are able to start a transmission even if not queried by any
readers.
Some typical work frequencies are 433MHz, 868MHz, 915MHz, 2.45GHz and 5.8GHz. The
higher bandwidth gives you the chance to implement a real complete communication
system.
The maximum communication distance can reach tens or even hundreds of meters,
according to the work frequency used and to the output power (according to national
regulations).
Active RFId technology gives you the opportunity to implement a real tracking system,
provided that the tag’s spatial position can be calculated using some RTLS (Real Time
Location System) algorithm or some other source of spatial information.
The main drawbacks are the transponder end user price, tens of times higher if compared to
passive tags, the increased size and weight, and the necessity for maintenance.
Fig. 4. Active RFId system (courtesy of AME, www.ameol.it)
RFId technologies for the hospital. How to choose the right one and plan the right solution? 523
UHF passive RFId systems use dipole antennas both on the tag and on the reader. The
typical work frequencies are 868MHz (EU), 915MHz (US) and above (microwave). Since the
higher is the frequency the smaller is the wavelength, these system make it simple to design
smaller antennas. These are called long-range systems since the distance between the reader
and the tag can be greater than 1m. The tag is fed by the reader using electromagnetic
coupling.
A backscattering phenomenon is used to allow the tag to perform the reverse link. Here is
how it works: a fraction of the power that comes from the reader is reflected by the
transponder dipole antenna back to the reader depending on the tag’s antenna reflection
cross-section. This characteristic parameter can be altered by switching on and off a load
resistor connected in parallel to the transponder antenna. You can take advantage of this
phenomenon to transmit data from the tag to the reader by modulating the power fraction
reflected back.
Fig. 3. Backscattering coupling (UHF)
2.2 Semi-passive tags
These tags are in all similar to passive ones, but are provided with an onboard battery used
for feeding some sensors (accelerometers, temperature sensors, pressure sensors, etc.).
Anyway, the battery is not used to feed the tag microchip or antenna; this means that these
transponders cannot start a communication autonomously. The reliability is of course
affected by the presence of the battery itself.
2.3 Active tags
An RFID tag is called “active” when it is equipped with a battery, to be used to feed the tag's
microchip and antenna and also as a source of power for onboard sensors. These tags are
proper transceivers, therefore they are able to start a transmission even if not queried by any
readers.
Some typical work frequencies are 433MHz, 868MHz, 915MHz, 2.45GHz and 5.8GHz. The
higher bandwidth gives you the chance to implement a real complete communication
system.
The maximum communication distance can reach tens or even hundreds of meters,
according to the work frequency used and to the output power (according to national
regulations).
Active RFId technology gives you the opportunity to implement a real tracking system,
provided that the tag’s spatial position can be calculated using some RTLS (Real Time
Location System) algorithm or some other source of spatial information.
The main drawbacks are the transponder end user price, tens of times higher if compared to
passive tags, the increased size and weight, and the necessity for maintenance.
Fig. 4. Active RFId system (courtesy of AME, www.ameol.it
)
Recent Advances in Biomedical Engineering524
2.4 UWB (Ultra Wide Band)
UWB (Ultra Wide Band) is a technique that makes use of a broad frequency range (3,1 GHz -
10,6 GHz). This is often obtained by using radiofrequency impulses with a very low time
duration, few tens of picoseconds, that translates in a very wide spectrum. Also, since the
time-pulse is so short, the UWB is slightly sensible to interferences caused by wave
reflections. The energy needed to generate such narrow time-pulses is very low: this is a
great plus of this technology because it can at once save the tag’s battery life and generate
few electromagnetic interferences.
All this makes UWB very good for use in “noisy” environments like factories or hospitals.
This technology has been widely used in military field, in the last 20 years for
telecommunications and geolocalization. After 2004 US government has allowed the use of
UWB for civil scopes.
UWB can show its potential in healthcare applications, because of the following issues:
- the short duration of time pulses reduces the possible interferences due to reflected
signals, since such a short signal is correctly received and processed before any
mirrored out-of-phase signals can be;
- tag battery life is preserved since tag’s total power consumption (Tx+Rx) is reduced
down to 1 mW;
- reduced or no interferences at all with other narrow band communications in the
same range (3,1 GHz - 10,6 GHz);
- if combined to recent powerful Real Time Location System algorithms (RTLS), UWB
allows for very good performances in locating assets, patients or personnel, in terms
of precision and accuracy;
- high data rates
- high insensitivity to obstacles, fluids and metals if compared to other narrow band
active RFId systems
- simplified tag circuitry, compared to narrow band RFIds: pure digital signals can be
generated and transmitted by UWB transponders without having any DAC/ADC
onboard or any analog modulators/demodulators.
Fig. 5. Narrowband vs UWB functioning principles
3. Applications of RFId in healthcare
This paragraph summarizes some applications of RFId to healthcare. The listed experiences
are an abstract of the investigation performed by the author together with Dr. Roberto
Bonaiuti, former member of his research team.
3.1 Drugs management
RFId technologies, alone or combined with others like barcodes, are used for the automation
of the drugs management process. Many steps can be managed: drugs production and
packaging inside the factories, deliveries to the hospital pharmacy, automation of the
pharmacy storage and retrieval, patient’s bedside therapy preparation and tracking.
The Ospedale “G.B.Morgagni-L.Pierantoni“ di Forlì is an Italian public owned hospital
(Azienda Unità Sanitaria Locale di Forlì, Servizio Sanitario Regionale Emilia-Romagna)
counting about 550 beds. It has been equipped with a Pillpick system by Swisslog
(www.swisslog.com).
The solution consists of an automated management of the pharmacy, combined with an
interface to the prescription software (CPOE - Computerized physician order entry) and to
the Hospital Information System and an unit dose process in the wards. The drugs are
placed in holders tagged with RFId and managed using an automated robot. The data
recorded in the tag are about operator, drug type and posology, drug’s expiring date and
more. These data are read by nurses at the bedside using handheld passive RFId readers;
then this data are coupled with patient’s ID using barcode wristbands. (Bianchi, 2008)
3.2 Tracking of biopsic specimens
The Mayo Clinic (www.mayoclinic.com Rochester, MN, USA) uses passive RFId tags to
track biological gastrointestinal tissue specimens, from their collection in one building to the
pathology laboratory in another.
The system has been developed by 3M ( It uses ISO
18000-3 compliant passive RFId tags operating at 13,56MHz attached to the sample holders.
Each tag’s unique ID is linked to patient’s data from the EPR in the HIS central database.
These data also include the sample coded description coming from a surgical database.
(Bacheldor, 2007 a)
3.3 Tracking of blood bags for transfusion
Blood bags for transfusion are an important field of application for RFId in healthcare. If fact
blood, plasma and blood products are stored at low temperatures for cryopreservation. This
causes ice on the bag’s surface. Therefore optical based identification technologies like
barcodes are useless for this scope.
The hospital of Saarbrüken (Germany) uses RFId to track blood bags, record transfusions
and perform a matching of patients and blood bags. Patients are provided with a passive
RFId wristband. Blood bags are tagged with self-adhesive passive RFId labels operating at
13,56MHz. The labels are equipped with a 2KB memory to store an unique ID and some
informations about the blood composition.
Both these tags are read using an handheld PDA equipped with a passive RFId reader. The
data matching is then verified by a central software. Hence, the operator is able to verify the
RFId technologies for the hospital. How to choose the right one and plan the right solution? 525
2.4 UWB (Ultra Wide Band)
UWB (Ultra Wide Band) is a technique that makes use of a broad frequency range (3,1 GHz -
10,6 GHz). This is often obtained by using radiofrequency impulses with a very low time
duration, few tens of picoseconds, that translates in a very wide spectrum. Also, since the
time-pulse is so short, the UWB is slightly sensible to interferences caused by wave
reflections. The energy needed to generate such narrow time-pulses is very low: this is a
great plus of this technology because it can at once save the tag’s battery life and generate
few electromagnetic interferences.
All this makes UWB very good for use in “noisy” environments like factories or hospitals.
This technology has been widely used in military field, in the last 20 years for
telecommunications and geolocalization. After 2004 US government has allowed the use of
UWB for civil scopes.
UWB can show its potential in healthcare applications, because of the following issues:
- the short duration of time pulses reduces the possible interferences due to reflected
signals, since such a short signal is correctly received and processed before any
mirrored out-of-phase signals can be;
- tag battery life is preserved since tag’s total power consumption (Tx+Rx) is reduced
down to 1 mW;
- reduced or no interferences at all with other narrow band communications in the
same range (3,1 GHz - 10,6 GHz);
- if combined to recent powerful Real Time Location System algorithms (RTLS), UWB
allows for very good performances in locating assets, patients or personnel, in terms
of precision and accuracy;
- high data rates
- high insensitivity to obstacles, fluids and metals if compared to other narrow band
active RFId systems
- simplified tag circuitry, compared to narrow band RFIds: pure digital signals can be
generated and transmitted by UWB transponders without having any DAC/ADC
onboard or any analog modulators/demodulators.
Fig. 5. Narrowband vs UWB functioning principles
3. Applications of RFId in healthcare
This paragraph summarizes some applications of RFId to healthcare. The listed experiences
are an abstract of the investigation performed by the author together with Dr. Roberto
Bonaiuti, former member of his research team.
3.1 Drugs management
RFId technologies, alone or combined with others like barcodes, are used for the automation
of the drugs management process. Many steps can be managed: drugs production and
packaging inside the factories, deliveries to the hospital pharmacy, automation of the
pharmacy storage and retrieval, patient’s bedside therapy preparation and tracking.
The Ospedale “G.B.Morgagni-L.Pierantoni“ di Forlì is an Italian public owned hospital
(Azienda Unità Sanitaria Locale di Forlì, Servizio Sanitario Regionale Emilia-Romagna)
counting about 550 beds. It has been equipped with a Pillpick system by Swisslog
(www.swisslog.com
).
The solution consists of an automated management of the pharmacy, combined with an
interface to the prescription software (CPOE - Computerized physician order entry) and to
the Hospital Information System and an unit dose process in the wards. The drugs are
placed in holders tagged with RFId and managed using an automated robot. The data
recorded in the tag are about operator, drug type and posology, drug’s expiring date and
more. These data are read by nurses at the bedside using handheld passive RFId readers;
then this data are coupled with patient’s ID using barcode wristbands. (Bianchi, 2008)
3.2 Tracking of biopsic specimens
The Mayo Clinic (www.mayoclinic.com
Rochester, MN, USA) uses passive RFId tags to
track biological gastrointestinal tissue specimens, from their collection in one building to the
pathology laboratory in another.
The system has been developed by 3M ( />). It uses ISO
18000-3 compliant passive RFId tags operating at 13,56MHz attached to the sample holders.
Each tag’s unique ID is linked to patient’s data from the EPR in the HIS central database.
These data also include the sample coded description coming from a surgical database.
(Bacheldor, 2007 a)
3.3 Tracking of blood bags for transfusion
Blood bags for transfusion are an important field of application for RFId in healthcare. If fact
blood, plasma and blood products are stored at low temperatures for cryopreservation. This
causes ice on the bag’s surface. Therefore optical based identification technologies like
barcodes are useless for this scope.
The hospital of Saarbrüken (Germany) uses RFId to track blood bags, record transfusions
and perform a matching of patients and blood bags. Patients are provided with a passive
RFId wristband. Blood bags are tagged with self-adhesive passive RFId labels operating at
13,56MHz. The labels are equipped with a 2KB memory to store an unique ID and some
informations about the blood composition.
Both these tags are read using an handheld PDA equipped with a passive RFId reader. The
data matching is then verified by a central software. Hence, the operator is able to verify the
Recent Advances in Biomedical Engineering526
correct coupling between patient and blood bag, thus reducing significantly the occurrence
of errors. (Wessel, 2006)
3.4 Asset tracking
The Harmon Medical Center (Las Vegas, NV, USA) uses an asset localization solution
developed by Exavera Technologies (www.exavera.com
).
The system makes use of active RFId tags and readers operating at 915MHz frequency. A
custom software lets you locate the assets using a cartographical map.
Every room is equipped with active readers that locate the assets and send their ID to the
central software via LAN. These data are then linked to the information coming from the
clinical engineering department like datasheets and maintenance operations performed.
(Bacheldor, 2007 b)
The Spartanburg Regional Medical Center (Spartanburg, SC, USA) uses an 802.11g solution
to locate more than 550 intravenous infusion pumps.
The system is developed by McKesson (www.mckesson.com
) using hardware and RTLS
(Real Time Location System) by Ekahau (www.ekahau.com
). The whole hospital is covered
using more than 300 Wi-Fi access points. The active tags “beep” once in an hour to
communicate their unique ID. Each time a tag detects a change of position, thanks to
movement sensors mounted onboard, it communicates its ID waiting just six seconds. This
behaviour lets the batteries go on for even two years.
A web based software shows the pump positions over a plan of the hospital. The system is
as well capable of sending alarms in case some pumps enter particular areas.
(Bacheldor, 2007 c)
The Washington Hospital Center (District of Columbia, USA) uses an UWB RFId system
from Parco (www.parcomergedmedia.com) to track and localize medical devices, mainly
devices used to move patients like litters, wheelchairs, wheel beds and portable
radiographs. The UWB transponders are shaped in cubes 2.5cm wide screwed or glued to
the device to be tracked. Tags can be located by readers within a 180m radius with a pretty
good accuracy of less than half meter. The tag’s battery can last 4 years with a pulse
frequency of 1 Hz. Every transponder is provided with a 32 bytes of data memory and is
capable of transmitting its ID number together with some more info about battery life and
manumissions.
A GIS software is included to show the position of every tag on a map of the hospital.
(Bacheldor, 2007 d)
4. RFId and electromagnetic interferences (EMI): case study
Radio Frequency Identification (RFId) technology is quickly entering hospitals, as shown in
the above chapter 3, often close to the patient himself.
Some of the outlined tasks can be done having recourse to simple passive RFId tags: mother-
baby matching with wristbands to avoid mix-ups; patient-drug tracking using RFId tagged
packaging; blood bags tracking; sterile surgical tools tracking, etc.
On the other hand, active RFId systems allow some tasks not achievable with passive ones
or using older technologies like barcodes, video-cameras or else. Some studies show that the
active technology is particularly suitable for tasks such as the location of patients or assets
(Iadanza, 2008; Fry, 2005; Davis, 2004; Wicks, 2006, Sangwan, 2005)
RFId use in healthcare is also receiving much attention to assess the implications in terms of
patient safety. (Ashar, 2007; Van der Togt, 2008)
The possible EMI on medical equipment is a concern, primarily when the life of the patient
is related to the medical device correct function. Some recent studies showed contrasting
results, pointing out the need for further investigations to be done case by case (Van der
Togt, 2008; Christe, 2008). The focus of this paragraph is examining the EMI between an
active RFId system and the critical care equipment in a children’s ICU.
As mentioned above, an active RFId system consists of three main devices: illuminator,
receiver and tag. The system is then connected to a data network and is managed by a
master software. The tag is battery-powered and is normally in stand-by mode; when
entering an illuminator field cone, it wakes up and it starts to transmit its ID code together
with the illuminator’s ID code to a receiver. The various systems on the market use many
different transmitting frequencies and modes of operation, also depending on the different
national regulations.
The electrical medical equipment must comply to UL/EN/IEC 60601 standard plus some
national deviations. In particular the collateral standard TE 60601-1-2 applies to
electromagnetic compatibility of medical electrical equipment and medical electrical
systems. Nevertheless many medical devices, still widely used in hospitals, only meet older
versions of the standard that required lower immunity test levels over the frequency range
26 MHz to 1 GHz.
Here is why it is important to test the RFId system for possible EMIs on the hospital medical
electrical equipment.
The tested RFId hardware is an active dual frequency system, LNX®, by Advanced
Microwave Engineering S.r.l. (www.ameol.it., Florence, Italy). The LNX system includes
three devices: the illuminator, the tag and the reader. (Iadanza, 2008)
The major EMI source in the system is the illuminator. The system is tested for its possible
use in a children’s hospital intensive care department.
In this application the footprint of its antenna is designed to cover a single ICU room. It
consists of a 2.45 MHz PLL oscillator cascaded with a OOK modulator and a medium power
MMIC amplifier. The radiation pattern of the antenna has 120 degrees –8 dB angular
aperture. Circular polarization is employed because the orientation of the tag, that uses a
linear polarized antenna, is unpredictable in many applications. The signal transmitted by
the illuminator provides a programmable ID code and few more setting commands that are
used for programming the operation mode of the tag entering its field pattern. The RF
output power of the illuminator can be set from 0 dBm to 20 dBm (Biffi Gentili, 2008). For
each test , the maximum power of 20dBm has been used.
The RFId tag is a battery-powered dual frequency device that can be activated and
programmed by the illuminator. It comes with a 4 Kbytes memory board and it is in a low
power consumption stand-by mode until it is activated. Then it transmits its own ID code
and the illuminator code to a receiver unit, using a 433 MHz centred band and a maximum
output power of 0 dBm.
RFId technologies for the hospital. How to choose the right one and plan the right solution? 527
correct coupling between patient and blood bag, thus reducing significantly the occurrence
of errors. (Wessel, 2006)
3.4 Asset tracking
The Harmon Medical Center (Las Vegas, NV, USA) uses an asset localization solution
developed by Exavera Technologies (www.exavera.com).
The system makes use of active RFId tags and readers operating at 915MHz frequency. A
custom software lets you locate the assets using a cartographical map.
Every room is equipped with active readers that locate the assets and send their ID to the
central software via LAN. These data are then linked to the information coming from the
clinical engineering department like datasheets and maintenance operations performed.
(Bacheldor, 2007 b)
The Spartanburg Regional Medical Center (Spartanburg, SC, USA) uses an 802.11g solution
to locate more than 550 intravenous infusion pumps.
The system is developed by McKesson (www.mckesson.com) using hardware and RTLS
(Real Time Location System) by Ekahau (www.ekahau.com). The whole hospital is covered
using more than 300 Wi-Fi access points. The active tags “beep” once in an hour to
communicate their unique ID. Each time a tag detects a change of position, thanks to
movement sensors mounted onboard, it communicates its ID waiting just six seconds. This
behaviour lets the batteries go on for even two years.
A web based software shows the pump positions over a plan of the hospital. The system is
as well capable of sending alarms in case some pumps enter particular areas.
(Bacheldor, 2007 c)
The Washington Hospital Center (District of Columbia, USA) uses an UWB RFId system
from Parco (www.parcomergedmedia.com) to track and localize medical devices, mainly
devices used to move patients like litters, wheelchairs, wheel beds and portable
radiographs. The UWB transponders are shaped in cubes 2.5cm wide screwed or glued to
the device to be tracked. Tags can be located by readers within a 180m radius with a pretty
good accuracy of less than half meter. The tag’s battery can last 4 years with a pulse
frequency of 1 Hz. Every transponder is provided with a 32 bytes of data memory and is
capable of transmitting its ID number together with some more info about battery life and
manumissions.
A GIS software is included to show the position of every tag on a map of the hospital.
(Bacheldor, 2007 d)
4. RFId and electromagnetic interferences (EMI): case study
Radio Frequency Identification (RFId) technology is quickly entering hospitals, as shown in
the above chapter 3, often close to the patient himself.
Some of the outlined tasks can be done having recourse to simple passive RFId tags: mother-
baby matching with wristbands to avoid mix-ups; patient-drug tracking using RFId tagged
packaging; blood bags tracking; sterile surgical tools tracking, etc.
On the other hand, active RFId systems allow some tasks not achievable with passive ones
or using older technologies like barcodes, video-cameras or else. Some studies show that the
active technology is particularly suitable for tasks such as the location of patients or assets
(Iadanza, 2008; Fry, 2005; Davis, 2004; Wicks, 2006, Sangwan, 2005)
RFId use in healthcare is also receiving much attention to assess the implications in terms of
patient safety. (Ashar, 2007; Van der Togt, 2008)
The possible EMI on medical equipment is a concern, primarily when the life of the patient
is related to the medical device correct function. Some recent studies showed contrasting
results, pointing out the need for further investigations to be done case by case (Van der
Togt, 2008; Christe, 2008). The focus of this paragraph is examining the EMI between an
active RFId system and the critical care equipment in a children’s ICU.
As mentioned above, an active RFId system consists of three main devices: illuminator,
receiver and tag. The system is then connected to a data network and is managed by a
master software. The tag is battery-powered and is normally in stand-by mode; when
entering an illuminator field cone, it wakes up and it starts to transmit its ID code together
with the illuminator’s ID code to a receiver. The various systems on the market use many
different transmitting frequencies and modes of operation, also depending on the different
national regulations.
The electrical medical equipment must comply to UL/EN/IEC 60601 standard plus some
national deviations. In particular the collateral standard TE 60601-1-2 applies to
electromagnetic compatibility of medical electrical equipment and medical electrical
systems. Nevertheless many medical devices, still widely used in hospitals, only meet older
versions of the standard that required lower immunity test levels over the frequency range
26 MHz to 1 GHz.
Here is why it is important to test the RFId system for possible EMIs on the hospital medical
electrical equipment.
The tested RFId hardware is an active dual frequency system, LNX®, by Advanced
Microwave Engineering S.r.l. (www.ameol.it., Florence, Italy). The LNX system includes
three devices: the illuminator, the tag and the reader. (Iadanza, 2008)
The major EMI source in the system is the illuminator. The system is tested for its possible
use in a children’s hospital intensive care department.
In this application the footprint of its antenna is designed to cover a single ICU room. It
consists of a 2.45 MHz PLL oscillator cascaded with a OOK modulator and a medium power
MMIC amplifier. The radiation pattern of the antenna has 120 degrees –8 dB angular
aperture. Circular polarization is employed because the orientation of the tag, that uses a
linear polarized antenna, is unpredictable in many applications. The signal transmitted by
the illuminator provides a programmable ID code and few more setting commands that are
used for programming the operation mode of the tag entering its field pattern. The RF
output power of the illuminator can be set from 0 dBm to 20 dBm (Biffi Gentili, 2008). For
each test , the maximum power of 20dBm has been used.
The RFId tag is a battery-powered dual frequency device that can be activated and
programmed by the illuminator. It comes with a 4 Kbytes memory board and it is in a low
power consumption stand-by mode until it is activated. Then it transmits its own ID code
and the illuminator code to a receiver unit, using a 433 MHz centred band and a maximum
output power of 0 dBm.
Recent Advances in Biomedical Engineering528
Fig. 6. LNX System working scheme
The tested critical care devices are a typical equipment for a children’s resuscitation. An ICU
room, away from the patients area, was set up with a moveable RFId illuminator and some
active RFId tags.
The medical equipment was operated by healthcare personnel, trained to manage it in
everyday use. Table 1 shows a list of the 16 devices, tested in two different times.
DEVICE N. OF DEVICES
Ventilator
4
Syringe pump
4
Volumetric Infusion pump
3
Defibrillator / Monitor
3
Multi-parametric monitor
2
Table 1. Tested critical care equipment
EMC assessment on all the medical equipment has been performed starting from their
documentation. For each medical device it has been developed a particular checklists
containing the tests to perform.
Only the two ventilators were compliant to the latest IEC 60601-1-2:2003 standard, that
specifies a general immunity test level to radiated RF noise of 10 V/m. The remaining 14
devices, according to their manuals, were compliant to previous versions of the same
standard, that required a level of immunity of just 3 V/m.
All the tests were performed switching on a single appliance at a time in a fully operating
critical care room without any patients.
The test method was based on the American National Standards Institute recommendation
ANSI C63.18 to assess the electromagnetic immunity of the medical devices by the RFId
illuminator and an active tag (IEEE; 1997). The standard has been integrated with checklists,
as stated above, designed for each medical device after the analysis of its operational and
maintenance documentation.
Each electrical medical device was first checked using its own internal test procedure and by
healthcare staff. If necessary the devices were connected to the provided simulators.
Then the illuminator was turned on. The distance between the illuminator and the device
was reduced, according to ANSI C63.18 standard, in three following steps from 2m to 0,6m
to 0.01m (indicating illuminator on top of the device, below the minimal distance for the RF
immunity tests imposed by IEC 60601-1-2). For each step the device was turned off and then
on, the device internal test procedures were performed and the performances were
evaluated by the healthcare personnel.
Each test was repeated having a battery powered transmitting tag attached to the device
body. At the minimal distance, the illuminator was moved in three different positions on the
axes x (frontal), y (lateral) and z (above the device).
No malfunctions spotted on the ventilators in Paw, flow, respiratory frequency or other
parameters for any of the tested modes:
1. IPPV (Intermittent Positive Pressure Ventilation);
2. SIMV (Synchronized Intermittent Mandatory Ventilation);
3. MMV (Mandatory Minute Volume Ventilation);
4. CPAP (Continous Positive Airway Pressure);
5. ASB (Assisted Spontaneous Breathing);
6. BIPAP (Biphasic Positive Airway Pressure);
7. APRV (Airway Pressure Release Ventilation);
8. PPS (Proportional Pressure Support).
No malfunctions in the alarms, tested simulating alert situations, neither for the older
devices of the set, that conformed just to the first version of the IEC 60601-1-2.
None of the tested pumps, set to give 5 mL/h, revealed malfunctions during the tests.
Alarms correct functioning was assessed by simulating an occlusion, then waiting for the
alarm beeps and for the error message, both disappeared as soon as the shrinkage was
eliminated.
No anomaly as well for the defibrillators. Tests were performed using device’s ‘User Test’
mode with no actual defibrillator shots. Also the ECG trace, obtained by connecting the
electrodes to a test subject, showed no errors: the ECG curve has not revealed distortions
and heart rate remained constant. The ‘signal absence alarm’ functioning was verified, after
removing an electrode. The alarm stopped as soon as the electrode was repositioned.
Also the Siemens multi-parametric monitors, tested detecting the ECG and the pulse
oximetry signal, worked properly during all the performed tests.
Eventually, our study found no evidence that the use of an active low power microwave
RFId system does affect the performances of the neighboring medical devices.
The set of devices tested does certainly not cover the broad spectrum of the devices on the
market. Nevertheless it is heterogeneous, composed by critical devices and containing many
outdated models.
Therefore it is feasible enough to extend these results to a generic hospital ward equipment.
RFId technologies for the hospital. How to choose the right one and plan the right solution? 529
Fig. 6. LNX System working scheme
The tested critical care devices are a typical equipment for a children’s resuscitation. An ICU
room, away from the patients area, was set up with a moveable RFId illuminator and some
active RFId tags.
The medical equipment was operated by healthcare personnel, trained to manage it in
everyday use. Table 1 shows a list of the 16 devices, tested in two different times.
DEVICE N. OF DEVICES
Ventilator
4
Syringe pump
4
Volumetric Infusion pump
3
Defibrillator / Monitor
3
Multi-parametric monitor
2
Table 1. Tested critical care equipment
EMC assessment on all the medical equipment has been performed starting from their
documentation. For each medical device it has been developed a particular checklists
containing the tests to perform.
Only the two ventilators were compliant to the latest IEC 60601-1-2:2003 standard, that
specifies a general immunity test level to radiated RF noise of 10 V/m. The remaining 14
devices, according to their manuals, were compliant to previous versions of the same
standard, that required a level of immunity of just 3 V/m.
All the tests were performed switching on a single appliance at a time in a fully operating
critical care room without any patients.
The test method was based on the American National Standards Institute recommendation
ANSI C63.18 to assess the electromagnetic immunity of the medical devices by the RFId
illuminator and an active tag (IEEE; 1997). The standard has been integrated with checklists,
as stated above, designed for each medical device after the analysis of its operational and
maintenance documentation.
Each electrical medical device was first checked using its own internal test procedure and by
healthcare staff. If necessary the devices were connected to the provided simulators.
Then the illuminator was turned on. The distance between the illuminator and the device
was reduced, according to ANSI C63.18 standard, in three following steps from 2m to 0,6m
to 0.01m (indicating illuminator on top of the device, below the minimal distance for the RF
immunity tests imposed by IEC 60601-1-2). For each step the device was turned off and then
on, the device internal test procedures were performed and the performances were
evaluated by the healthcare personnel.
Each test was repeated having a battery powered transmitting tag attached to the device
body. At the minimal distance, the illuminator was moved in three different positions on the
axes x (frontal), y (lateral) and z (above the device).
No malfunctions spotted on the ventilators in Paw, flow, respiratory frequency or other
parameters for any of the tested modes:
1. IPPV (Intermittent Positive Pressure Ventilation);
2. SIMV (Synchronized Intermittent Mandatory Ventilation);
3. MMV (Mandatory Minute Volume Ventilation);
4. CPAP (Continous Positive Airway Pressure);
5. ASB (Assisted Spontaneous Breathing);
6. BIPAP (Biphasic Positive Airway Pressure);
7. APRV (Airway Pressure Release Ventilation);
8. PPS (Proportional Pressure Support).
No malfunctions in the alarms, tested simulating alert situations, neither for the older
devices of the set, that conformed just to the first version of the IEC 60601-1-2.
None of the tested pumps, set to give 5 mL/h, revealed malfunctions during the tests.
Alarms correct functioning was assessed by simulating an occlusion, then waiting for the
alarm beeps and for the error message, both disappeared as soon as the shrinkage was
eliminated.
No anomaly as well for the defibrillators. Tests were performed using device’s ‘User Test’
mode with no actual defibrillator shots. Also the ECG trace, obtained by connecting the
electrodes to a test subject, showed no errors: the ECG curve has not revealed distortions
and heart rate remained constant. The ‘signal absence alarm’ functioning was verified, after
removing an electrode. The alarm stopped as soon as the electrode was repositioned.
Also the Siemens multi-parametric monitors, tested detecting the ECG and the pulse
oximetry signal, worked properly during all the performed tests.
Eventually, our study found no evidence that the use of an active low power microwave
RFId system does affect the performances of the neighboring medical devices.
The set of devices tested does certainly not cover the broad spectrum of the devices on the
market. Nevertheless it is heterogeneous, composed by critical devices and containing many
outdated models.
Therefore it is feasible enough to extend these results to a generic hospital ward equipment.
Recent Advances in Biomedical Engineering530
5. A multi-layer method to design a technical RFId solution for in-patients
tracking
In this paragraph we will discuss a design method to correctly identify the technical solution
that best responds to aims and imposed constraints. (Iadanza 2008)
The method consists in four consecutive steps. The first thing to do is to focus all the project
aims. This step has to be performed together with the client, that in this case is the top
management of the hospital. The higher is the position, on the hospital organization chart, of
your interlocutor, the best are the chances to spot the final wishes of the client.
The second step is addressed to the translation of the upper level aims in functional
requirements that the final system must satisfy. Also in this phase it is important to maintain
a close connection to the people that will actually take advantage of the system, like head of
department, caregivers or technical personnel.
Afterwards, the functional requirements must be transformed in technical constraints; this
step can be completely managed by the designer himself.
Eventually, many technical solutions are compared in order to assess which one best fits the
upper levels constraints.
Therefore, as in a four layer planning architecture, the top layer (layer I: “project aims”)
must be satisfied as much as possible be the lower layer (“functional requirement” - layer II).
Similarly, the “technical constraints” layer III is created to satisfy as much as possible its
upper level (layer II). Using this operating mode, the technical solution comes out very
coherently to the main project aims.
LAYER DESCRIPTION
LAYER I
PROJECT AIMS
LAYER II
FUNCTIONAL REQUIREMENTS
LAYER III
TECHNICAL CONSTRAINTS
LAYER IV
TECHNICAL SOLUTION
Table 2. The four layers in the proposed multilayer design method
5.1 Layer I: Project aims
Project aims can be divided in three main categories: functionality, economical efficiency,
compliance to standards and laws.
- Functional aims: the system must have both a good spatial and time resolution. It
must be thought to be used by medical and paramedical staff. It must ease the duty of
staff when they want to inform patient relatives about the progress of cares to their
kinsman (especially in wards like Emergency Department). It must be provided with
alarm procedures for danger situations in which the in-patient, possibly confused, could
be. It must be open to an interface towards Hospital information System (HIS).
- Economical aims: the system must provide a total cost reduction for patients
logistics management. It must lower costs due to clinical errors by reducing error
probability.
- Safety and laws: the system does not have to be an obstacle to clinical practice and
must guarantee a good cohabitation with EMI sensitive devices.
5.2 Layer II: Functional requirements
According to Layer I aims, 28 different requirements were spotted. Some of these are shown
here:
- real-time tracking
- indoor and outdoor tracking capability
- coverage range
- system-to-HIS integration
- alarms
- procedure to associate tag and patient
- design and ergonomics of tag support
- tag support resistance, cost efficiency and duration
- interaction with Medical Devices
- patient privacy
5.3 Layer III: Technical constraints
Technical specifications come directly from the upper layer II functional requirements and
are the base to assess the technological solution. Many specifications categories are provided
to cover the whole range of constraints just showed:
- Technology
i. Active RFId
ii. Functional range illuminator-tag > 10m
iii. Functional range tag-reader > 20 m;
iv. Each illuminator must define an area of interest
v. Site survey and plan of fixed devices location
vi. RFId provided with a robust anti-collision algorithm
vii. Not disposable reprogrammable tags
viii. 32 Kbit or more on the tag
ix. Frequency range: 433 MHz – 2,45 GHz, in compliance with Italian laws
x. Tag battery duration > 2 years
- Interface
i. Reader must become a node of the HIS (Hospital Information System) via
LAN or wireless-LAN
ii. Custom software to process tag information and show it on the hospital
floor plan;
iii. Critical areas recognition and link to some alarm system
- Standard and laws
i. Privacy protection
ii. accordance of the RFID system with electro-magnetic compatibility and
safety guidelines
RFId technologies for the hospital. How to choose the right one and plan the right solution? 531
5. A multi-layer method to design a technical RFId solution for in-patients
tracking
In this paragraph we will discuss a design method to correctly identify the technical solution
that best responds to aims and imposed constraints. (Iadanza 2008)
The method consists in four consecutive steps. The first thing to do is to focus all the project
aims. This step has to be performed together with the client, that in this case is the top
management of the hospital. The higher is the position, on the hospital organization chart, of
your interlocutor, the best are the chances to spot the final wishes of the client.
The second step is addressed to the translation of the upper level aims in functional
requirements that the final system must satisfy. Also in this phase it is important to maintain
a close connection to the people that will actually take advantage of the system, like head of
department, caregivers or technical personnel.
Afterwards, the functional requirements must be transformed in technical constraints; this
step can be completely managed by the designer himself.
Eventually, many technical solutions are compared in order to assess which one best fits the
upper levels constraints.
Therefore, as in a four layer planning architecture, the top layer (layer I: “project aims”)
must be satisfied as much as possible be the lower layer (“functional requirement” - layer II).
Similarly, the “technical constraints” layer III is created to satisfy as much as possible its
upper level (layer II). Using this operating mode, the technical solution comes out very
coherently to the main project aims.
LAYER DESCRIPTION
LAYER I
PROJECT AIMS
LAYER II
FUNCTIONAL REQUIREMENTS
LAYER III
TECHNICAL CONSTRAINTS
LAYER IV
TECHNICAL SOLUTION
Table 2. The four layers in the proposed multilayer design method
5.1 Layer I: Project aims
Project aims can be divided in three main categories: functionality, economical efficiency,
compliance to standards and laws.
- Functional aims: the system must have both a good spatial and time resolution. It
must be thought to be used by medical and paramedical staff. It must ease the duty of
staff when they want to inform patient relatives about the progress of cares to their
kinsman (especially in wards like Emergency Department). It must be provided with
alarm procedures for danger situations in which the in-patient, possibly confused, could
be. It must be open to an interface towards Hospital information System (HIS).
- Economical aims: the system must provide a total cost reduction for patients
logistics management. It must lower costs due to clinical errors by reducing error
probability.
- Safety and laws: the system does not have to be an obstacle to clinical practice and
must guarantee a good cohabitation with EMI sensitive devices.
5.2 Layer II: Functional requirements
According to Layer I aims, 28 different requirements were spotted. Some of these are shown
here:
- real-time tracking
- indoor and outdoor tracking capability
- coverage range
- system-to-HIS integration
- alarms
- procedure to associate tag and patient
- design and ergonomics of tag support
- tag support resistance, cost efficiency and duration
- interaction with Medical Devices
- patient privacy
5.3 Layer III: Technical constraints
Technical specifications come directly from the upper layer II functional requirements and
are the base to assess the technological solution. Many specifications categories are provided
to cover the whole range of constraints just showed:
- Technology
i. Active RFId
ii. Functional range illuminator-tag > 10m
iii. Functional range tag-reader > 20 m;
iv. Each illuminator must define an area of interest
v. Site survey and plan of fixed devices location
vi. RFId provided with a robust anti-collision algorithm
vii. Not disposable reprogrammable tags
viii. 32 Kbit or more on the tag
ix. Frequency range: 433 MHz – 2,45 GHz, in compliance with Italian laws
x. Tag battery duration > 2 years
- Interface
i. Reader must become a node of the HIS (Hospital Information System) via
LAN or wireless-LAN
ii. Custom software to process tag information and show it on the hospital
floor plan;
iii. Critical areas recognition and link to some alarm system
- Standard and laws
i. Privacy protection
ii. accordance of the RFID system with electro-magnetic compatibility and
safety guidelines
Recent Advances in Biomedical Engineering532
- Economics
i. Reusable tag (re-programming tag separable from the support);
- Device package
i. Both indoor and outdoor use
ii. Easily wearable tag (custom solutions also for children and injured
people)
iii. Use of an armlet as support for the tag (not for use in Neonatal Intensive
Care Units)
iv. Total weight ‘support + tag’ < 35 g
v. Cut-to-remove armlet
vi. Possibility to separate the tag from the support for sterilization purposes
Fig. 7. Patient Tracking Process flow chart
5.4 Layer IV: Technical solution and system configuration
The technical solution that best fits all the above constrains is the same as described in the
above section 4 and, therefore, is not described once more in this paragraph.
For patient tracking scope it comes useful a particular operational mode provided by the
system: the “beeper fast” operating mode. It allows you to implement a system not just
based on a “gate” working model but on an “area recognition” model. In beeper fast mode
the tag, once activated, transmits the same signal (tag factory code and illuminator area
code) at programmable intervals of time until it enters a different illuminator’s antenna lobe.
This functioning mode is useful to extend tag’s battery life: when the tag enters a closed area
(e.g. a room) it could be programmed to transmit once every 15 minutes or more to save
energy, whereas the owner patient can’t be but inside the room. Out of the room the tag will
be enlightened by a different illuminator: this will cause an immediate new transmission.
6. Case study: RFId for children and newborns in intensive care
This paragraph shows how to apply the above multilayer design method (see par. 5) in
designing a system to identify and know the actual position of patients in a children’s
Intensive Care Unit (ICU).
As a first step you must spot the system purposes. In this case the main objective is to
provide the ICU with a system to lower down the clinical risks related to misidentification
of patients or unintentional rooms swaps.
Still, this does not exhaust the correct definition of all the project scopes. In the first layer,
“project aims”, you must also take into account many aspects that are linked to functional
aims as well as to financial aspects and to quality and standards. The whole system must be
designed following standards and laws about privacy and data protection in healthcare.
Also, the technical solutions may be very different according to the patients type, age and
cognitive conditions and according to the hospital building types and shapes. A hospital
with separate pavilions requires solutions that may be very different from multilevel
monoblock buildings. Similarly, in designing a tracking solution for non cooperative
patients, you will face requirements very different from surgical patients or newborns.
Furthermore, if delicate healthcare tasks are involved in the process that the system is called
to manage, like drugs administrations and Electronic Medical Record (EMR) updates, it will
have to deal with many other requirements such as the drugs inventory system, the
identification of caregivers, the interface with the Hospital Information System (HIS).
(Iadanza 2008)
Children in a resuscitation ward have, in most cases, no cognitive abilities and a wide range
of variability in age, weight and dimensions (from newborns to overweight children). This
makes it hard their identification by healthcare personnel. They could have no alive parents
at all; newborns are often similar one to another; senseless patients simply cannot tell you
their name, etc.
The diagnostic and therapeutic process for these children involves frequent movements to
other hospital departments for diagnostic tests, surgeries or ward transfers. This raises the
risk of rooms misplacement when they come back to the ICU.
The described active RFId solution is intended to identify ward rooms, cradles/beds and
patients with unique ID numbers. It also lets the caregivers trace the patients movements on
a wide screen, giving warnings and alerts to the nurses in case of dangerous situations.
The proposed system addresses all the constraints induced by the particular environment.
Critical care children are of course stationary in their bed, but they can often be moved in a
new bed for many reasons (cleaning up, going out, coming from thermal cradle, etc.). They
are sometimes not well recognizable one from another, therefore if we use some RFId
identifying tags we must lower down as much as possible the need for tags removing and
replacement.
Wristbands are not a suitable solution, since these patients can be very weak, small and
delicate, hence we must be aware of it in designing the tag case.
The system is composed of five different hardware devices and a tracking software,
purposely designed and realized in collaboration with Advanced Microwave Engineering
(AME, www.ameol.it). (Biffi Gentili, 2008)
RFId technologies for the hospital. How to choose the right one and plan the right solution? 533
- Economics
i. Reusable tag (re-programming tag separable from the support);
- Device package
i. Both indoor and outdoor use
ii. Easily wearable tag (custom solutions also for children and injured
people)
iii. Use of an armlet as support for the tag (not for use in Neonatal Intensive
Care Units)
iv. Total weight ‘support + tag’ < 35 g
v. Cut-to-remove armlet
vi. Possibility to separate the tag from the support for sterilization purposes
Fig. 7. Patient Tracking Process flow chart
5.4 Layer IV: Technical solution and system configuration
The technical solution that best fits all the above constrains is the same as described in the
above section 4 and, therefore, is not described once more in this paragraph.
For patient tracking scope it comes useful a particular operational mode provided by the
system: the “beeper fast” operating mode. It allows you to implement a system not just
based on a “gate” working model but on an “area recognition” model. In beeper fast mode
the tag, once activated, transmits the same signal (tag factory code and illuminator area
code) at programmable intervals of time until it enters a different illuminator’s antenna lobe.
This functioning mode is useful to extend tag’s battery life: when the tag enters a closed area
(e.g. a room) it could be programmed to transmit once every 15 minutes or more to save
energy, whereas the owner patient can’t be but inside the room. Out of the room the tag will
be enlightened by a different illuminator: this will cause an immediate new transmission.
6. Case study: RFId for children and newborns in intensive care
This paragraph shows how to apply the above multilayer design method (see par. 5) in
designing a system to identify and know the actual position of patients in a children’s
Intensive Care Unit (ICU).
As a first step you must spot the system purposes. In this case the main objective is to
provide the ICU with a system to lower down the clinical risks related to misidentification
of patients or unintentional rooms swaps.
Still, this does not exhaust the correct definition of all the project scopes. In the first layer,
“project aims”, you must also take into account many aspects that are linked to functional
aims as well as to financial aspects and to quality and standards. The whole system must be
designed following standards and laws about privacy and data protection in healthcare.
Also, the technical solutions may be very different according to the patients type, age and
cognitive conditions and according to the hospital building types and shapes. A hospital
with separate pavilions requires solutions that may be very different from multilevel
monoblock buildings. Similarly, in designing a tracking solution for non cooperative
patients, you will face requirements very different from surgical patients or newborns.
Furthermore, if delicate healthcare tasks are involved in the process that the system is called
to manage, like drugs administrations and Electronic Medical Record (EMR) updates, it will
have to deal with many other requirements such as the drugs inventory system, the
identification of caregivers, the interface with the Hospital Information System (HIS).
(Iadanza 2008)
Children in a resuscitation ward have, in most cases, no cognitive abilities and a wide range
of variability in age, weight and dimensions (from newborns to overweight children). This
makes it hard their identification by healthcare personnel. They could have no alive parents
at all; newborns are often similar one to another; senseless patients simply cannot tell you
their name, etc.
The diagnostic and therapeutic process for these children involves frequent movements to
other hospital departments for diagnostic tests, surgeries or ward transfers. This raises the
risk of rooms misplacement when they come back to the ICU.
The described active RFId solution is intended to identify ward rooms, cradles/beds and
patients with unique ID numbers. It also lets the caregivers trace the patients movements on
a wide screen, giving warnings and alerts to the nurses in case of dangerous situations.
The proposed system addresses all the constraints induced by the particular environment.
Critical care children are of course stationary in their bed, but they can often be moved in a
new bed for many reasons (cleaning up, going out, coming from thermal cradle, etc.). They
are sometimes not well recognizable one from another, therefore if we use some RFId
identifying tags we must lower down as much as possible the need for tags removing and
replacement.
Wristbands are not a suitable solution, since these patients can be very weak, small and
delicate, hence we must be aware of it in designing the tag case.
The system is composed of five different hardware devices and a tracking software,
purposely designed and realized in collaboration with Advanced Microwave Engineering
(AME, www.ameol.it). (Biffi Gentili, 2008)