Recent Advances in Signal Processing 2011 Part 2 ppt
Bạn đang xem bản rút gọn của tài liệu. Xem và tải ngay bản đầy đủ của tài liệu tại đây (3.89 MB, 35 trang )
Recent Advances in Signal Processing22
interest of the combination of DIRECT with spline interpolation comes from the elevated
computational load of DIRECT. Details about DIRECT algorithm are available in (Jones et
al., 1993). Reducing the number of unknown values retrieved by DIRECT reduces drastically
its computational load. Moreover, in the considered application, spline interpolation
between these node values provides a continuous contour. This prevents the pixels of the
result contour from converging towards noisy pixels. The more interpolation nodes, the
more precise the estimation, but the slower the algorithm.
After considering linear and nearly linear contours, we focus on circular and nearly circular
contours.
4. Star-shape contour retrieval
Star-shape contours are those whose radial coordinates in polar coordinate system are
described by a function of angle values in this coordinate system. The simplest star-shape
contour is a circle, centred on the origin of the polar coordinate system.
Signal generation upon a linear antenna yields a linear phase signal when a straight line is
present in the image. While expecting circular contours, we associate a circular antenna with
the processed image. By adapting the antenna shape to the shape of the expected contour,
we aim at generating linear phase signals.
4.1 Problem setting and virtual signal generation
Our purpose is to estimate the radius of a circle, and the distortions between a closed
contour and a circle that fits this contour. We propose to employ a circular antenna that
permits a particular signal generation and yields a linear phase signal out of an image
containing a quarter of circle. In this section, center coordinates are supposed to be known,
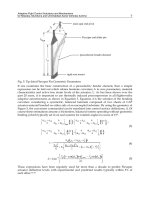
we focus on radius estimation, center coordinate estimation is explained further. Fig. 3(a)
presents a binary digital image
I . The object is close to a circle with radius value
r
and
center coordinates
cc
m,l . Fig. 3(b) shows a sub-image extracted from the original image,
such that its top left corner is the center of the circle. We associate this sub-image with a set
of polar coordinates
,
, such that each pixel of the expected contour in the sub-image is
characterized by the coordinates
,r , where
is the shift between the pixel of the
contour and the pixel of the circle that roughly approximates the contour and which has
same coordinate
. We seek for star-shaped contours, that is, contours that can be described
by the relation:
f where f is any function that maps
20,
to
R . The point with
coordinate 0
corresponds then to the center of gravity of the contour.
Generalized Hough transform estimates the radius of concentric circles when their center is
known. Its basic principle is to count the number of pixels that are located on a circle for all
possible radius values. The estimated radius values correspond to the maximum number of
pixels.
Fig. 3. (a) Circular-like contour, (b) Bottom right quarter of the contour and pixel
coordinates in the polar system
,
having its origin on the center of the circle.
r
is the
radius of the circle.
is the value of the shift between a pixel of the contour and the pixel
of the circle having same coordinate
Contours which are approximately circular are supposed to be made of more than one pixel
per row for some of the rows and more than one pixel per column for some columns.
Therefore, we propose to associate a circular antenna with the image which leads to linear
phase signals, when a circle is expected. The basic idea is to obtain a linear phase signal
from an image containing a quarter of circle. To achieve this, we use a circular antenna. The
phase of the signals which are virtually generated on the antenna is constant or varies
linearly as a function of the sensor index. A quarter of circle with radius
r
and a circular
antenna are represented on Fig.4. The antenna is a quarter of circle centered on the top left
corner, and crossing the bottom right corner of the sub-image. Such an antenna is adapted to
the sub-images containing each quarter of the expected contour (see Fig.4). In practice, the
extracted sub-image is possibly rotated so that its top left corner is the estimated center. The
antenna has radius
R so that
s
NR 2
where
s
N is the number of rows or columns in
the sub-image. When we consider the sub-image which includes the right bottom part of the
expected contour, the following relation holds:
ccs
mN,lNmaxN
where
c
l and
c
m
are the vertical and horizontal coordinates of the center of the expected contour in a
cartesian set centered on the top left corner of the whole processed image (see Fig.3).
Coordinates
c
l and
c
m are estimated by the method proposed in (Aghajan, 1995), or the
one that is detailed later in this paper.
Signal generation scheme upon a circular antenna is the following: the directions adopted
for signal generation are from the top left corner of the sub-image to the corresponding
sensor. The antenna is composed of S sensors, so there are S signal components.
About array processing methods for image segmentation 23
interest of the combination of DIRECT with spline interpolation comes from the elevated
computational load of DIRECT. Details about DIRECT algorithm are available in (Jones et
al., 1993). Reducing the number of unknown values retrieved by DIRECT reduces drastically
its computational load. Moreover, in the considered application, spline interpolation
between these node values provides a continuous contour. This prevents the pixels of the
result contour from converging towards noisy pixels. The more interpolation nodes, the
more precise the estimation, but the slower the algorithm.
After considering linear and nearly linear contours, we focus on circular and nearly circular
contours.
4. Star-shape contour retrieval
Star-shape contours are those whose radial coordinates in polar coordinate system are
described by a function of angle values in this coordinate system. The simplest star-shape
contour is a circle, centred on the origin of the polar coordinate system.
Signal generation upon a linear antenna yields a linear phase signal when a straight line is
present in the image. While expecting circular contours, we associate a circular antenna with
the processed image. By adapting the antenna shape to the shape of the expected contour,
we aim at generating linear phase signals.
4.1 Problem setting and virtual signal generation
Our purpose is to estimate the radius of a circle, and the distortions between a closed
contour and a circle that fits this contour. We propose to employ a circular antenna that
permits a particular signal generation and yields a linear phase signal out of an image
containing a quarter of circle. In this section, center coordinates are supposed to be known,
we focus on radius estimation, center coordinate estimation is explained further. Fig. 3(a)
presents a binary digital image
I . The object is close to a circle with radius value
r
and
center coordinates
cc
m,l . Fig. 3(b) shows a sub-image extracted from the original image,
such that its top left corner is the center of the circle. We associate this sub-image with a set
of polar coordinates
,
, such that each pixel of the expected contour in the sub-image is
characterized by the coordinates
,r
, where
is the shift between the pixel of the
contour and the pixel of the circle that roughly approximates the contour and which has
same coordinate
. We seek for star-shaped contours, that is, contours that can be described
by the relation:
f
where f is any function that maps
20,
to
R . The point with
coordinate 0
corresponds then to the center of gravity of the contour.
Generalized Hough transform estimates the radius of concentric circles when their center is
known. Its basic principle is to count the number of pixels that are located on a circle for all
possible radius values. The estimated radius values correspond to the maximum number of
pixels.
Fig. 3. (a) Circular-like contour, (b) Bottom right quarter of the contour and pixel
coordinates in the polar system
,
having its origin on the center of the circle.
r
is the
radius of the circle.
is the value of the shift between a pixel of the contour and the pixel
of the circle having same coordinate
Contours which are approximately circular are supposed to be made of more than one pixel
per row for some of the rows and more than one pixel per column for some columns.
Therefore, we propose to associate a circular antenna with the image which leads to linear
phase signals, when a circle is expected. The basic idea is to obtain a linear phase signal
from an image containing a quarter of circle. To achieve this, we use a circular antenna. The
phase of the signals which are virtually generated on the antenna is constant or varies
linearly as a function of the sensor index. A quarter of circle with radius
r
and a circular
antenna are represented on Fig.4. The antenna is a quarter of circle centered on the top left
corner, and crossing the bottom right corner of the sub-image. Such an antenna is adapted to
the sub-images containing each quarter of the expected contour (see Fig.4). In practice, the
extracted sub-image is possibly rotated so that its top left corner is the estimated center. The
antenna has radius
R so that
s
NR 2
where
s
N is the number of rows or columns in
the sub-image. When we consider the sub-image which includes the right bottom part of the
expected contour, the following relation holds:
ccs
mN,lNmaxN where
c
l and
c
m
are the vertical and horizontal coordinates of the center of the expected contour in a
cartesian set centered on the top left corner of the whole processed image (see Fig.3).
Coordinates
c
l and
c
m are estimated by the method proposed in (Aghajan, 1995), or the
one that is detailed later in this paper.
Signal generation scheme upon a circular antenna is the following: the directions adopted
for signal generation are from the top left corner of the sub-image to the corresponding
sensor. The antenna is composed of S sensors, so there are S signal components.
Recent Advances in Signal Processing24
Fig. 4. Sub-image, associated with a circular array composed of S sensors
Let us consider
i
D
, the line that makes an angle
i
with the vertical axis and crosses the top
left corner of the sub-image. The
th
i component
S, ,i 1
of the z generated out of the
image reads:
s
i
Nm,l
Dm,l
m,l
mljexpm,lIiz
1
22
(12)
The integer
l (resp.
m
) indexes the lines (resp. the columns) of the image. j stands for
1 .
µ
is the propagation parameter (Aghajan & Kailath, 1994). Each sensor indexed by i
is associated with a line
i
D having an orientation
S
i
i
2
1
. In Eq. (2), the term
m,l
means that only the image pixels that belong to
i
D are considered for the generation of the
th
i signal component. Satisfying the constraint
i
Dm,l , that is, choosing the pixels that
belong to the line with orientation
i
, is done in two steps: let setl be the set of indexes
along the vertical axis, and
setm the set of indexes along the horizontal axis. If
i
is less than
or equal to
4
,
s
N:setl 1 and
is
tan.N:setm
1 . If
i
is greater than
4
,
s
N:setm 1 and
is
tan.N:setl
2
1 . Symbol
. means integer part. The minimum
number of sensors that permits a perfect characterization of any possibly distorted contour
is the number of pixels that would be virtually aligned on a circle quarter having
radius
s
N2 . Therefore, the minimum number S of sensors is
s
N2 .
4.2 Proposed method for radius and distortion estimation
In the most general case there exists more than one circle for one center. We show how
several possibly close radius values can be estimated with a high-resolution method. For
this, we use a variable speed propagation scheme toward circular antenna. We propose a
method for the estimation of the number
d of concentric circles, and the determination of
each radius value. For this purpose we employ a variable speed propagation scheme
(Aghajan & Kailath, 1994). We set
1
iµ
, for each sensor indexed by S, ,i 1
. From Eq.
(12), the signal received on each sensor is:
d
k
k
S, ,i,inrijexpiz
1
11
(13)
where
d, ,k,r
k
1 are the values of the radius of each circle, and
in is a noise term that
can appear because of the presence of outliers. All components
iz
compose the
observation vector
z . TLS-ESPRIT method is applied to estimate d, ,k,r
k
1
, the number
of concentric circles
d is estimated by MDL (Minimum Description Length) criterion. The
estimated radius values are obtained with TLS-ESPRIT method, which also estimated
straight line orientations (see section 2.2).
To retrieve the distortions between an expected star-shaped contour and a fitting circle, we
work successively on each quarter of circle, and retrieve the distortions between one quarter
of the initialization circle and the part of the expected contour that is located in the same
quarter of the image. As an example, in Fig.3, the right bottom quarter of the considered
image is represented in Fig. 3(b). The optimization method that retrieves the shift values
between the fitting circle and the expected contour is the following:
A contour in the considered sub-image can be described in a set of polar coordinates by :
S, ,i,i,i 1
. We aim at estimating the S unknowns
S, ,i,i 1
that characterize
the contour, forming a vector:
T
S, ,,
21ρ
(14)
The basic idea is to consider that
ρ can be expressed as:
T
Sr, ,r,r
21ρ (see Fig. 3), where
r
is the radius of a circle that
approximates the expected contour.
5. Linear and circular array for signal generation: summary
In this section, we present the outline of the reviewed methods for contour estimation.
An outline of the proposed nearly rectilinear distorted contour estimation method is given
as follows:
Signal generation with constant parameter on linear antenna, using Eq. 1;
Estimation of the parameters of the straight lines that fit each distorted contour (see
subsection 3.1);
Distortion estimation for a given curve, estimation of x , applying gradient
algorithm to minimize a least squares criterion (see Eq. 11).
The proposed method for star-shaped contour estimation is summarized as follows:
Variable speed propagation scheme upon the proposed circular antenna :
Estimation of the number of circles by MDL criterion, estimation of the radius of
each circle fitting any expected contour (see Eqs. (12) and (13) or the axial
parameters of the ellipse;
Estimation of the radial distortions, in polar coordinate system, between any
expected contour and the circle or ellipse that fits this contour. Either the
About array processing methods for image segmentation 25
Fig. 4. Sub-image, associated with a circular array composed of S sensors
Let us consider
i
D
, the line that makes an angle
i
with the vertical axis and crosses the top
left corner of the sub-image. The
th
i component
S, ,i 1
of the z generated out of the
image reads:
s
i
Nm,l
Dm,l
m,l
mljexpm,lIiz
1
22
(12)
The integer
l (resp.
m
) indexes the lines (resp. the columns) of the image. j stands for
1 .
µ
is the propagation parameter (Aghajan & Kailath, 1994). Each sensor indexed by i
is associated with a line
i
D having an orientation
S
i
i
2
1
. In Eq. (2), the term
m,l
means that only the image pixels that belong to
i
D are considered for the generation of the
th
i signal component. Satisfying the constraint
i
Dm,l
, that is, choosing the pixels that
belong to the line with orientation
i
, is done in two steps: let setl be the set of indexes
along the vertical axis, and
setm the set of indexes along the horizontal axis. If
i
is less than
or equal to
4
,
s
N:setl 1
and
is
tan.N:setm
1
. If
i
is greater than
4
,
s
N:setm 1 and
is
tan.N:setl
2
1 . Symbol
. means integer part. The minimum
number of sensors that permits a perfect characterization of any possibly distorted contour
is the number of pixels that would be virtually aligned on a circle quarter having
radius
s
N2 . Therefore, the minimum number S of sensors is
s
N2 .
4.2 Proposed method for radius and distortion estimation
In the most general case there exists more than one circle for one center. We show how
several possibly close radius values can be estimated with a high-resolution method. For
this, we use a variable speed propagation scheme toward circular antenna. We propose a
method for the estimation of the number
d of concentric circles, and the determination of
each radius value. For this purpose we employ a variable speed propagation scheme
(Aghajan & Kailath, 1994). We set
1 iµ
, for each sensor indexed by S, ,i 1 . From Eq.
(12), the signal received on each sensor is:
d
k
k
S, ,i,inrijexpiz
1
11
(13)
where
d, ,k,r
k
1 are the values of the radius of each circle, and
in is a noise term that
can appear because of the presence of outliers. All components
iz
compose the
observation vector
z . TLS-ESPRIT method is applied to estimate d, ,k,r
k
1 , the number
of concentric circles
d is estimated by MDL (Minimum Description Length) criterion. The
estimated radius values are obtained with TLS-ESPRIT method, which also estimated
straight line orientations (see section 2.2).
To retrieve the distortions between an expected star-shaped contour and a fitting circle, we
work successively on each quarter of circle, and retrieve the distortions between one quarter
of the initialization circle and the part of the expected contour that is located in the same
quarter of the image. As an example, in Fig.3, the right bottom quarter of the considered
image is represented in Fig. 3(b). The optimization method that retrieves the shift values
between the fitting circle and the expected contour is the following:
A contour in the considered sub-image can be described in a set of polar coordinates by :
S, ,i,i,i 1
. We aim at estimating the S unknowns
S, ,i,i 1
that characterize
the contour, forming a vector:
T
S, ,,
21ρ
(14)
The basic idea is to consider that
ρ can be expressed as:
T
Sr, ,r,r
21ρ (see Fig. 3), where
r
is the radius of a circle that
approximates the expected contour.
5. Linear and circular array for signal generation: summary
In this section, we present the outline of the reviewed methods for contour estimation.
An outline of the proposed nearly rectilinear distorted contour estimation method is given
as follows:
Signal generation with constant parameter on linear antenna, using Eq. 1;
Estimation of the parameters of the straight lines that fit each distorted contour (see
subsection 3.1);
Distortion estimation for a given curve, estimation of x , applying gradient
algorithm to minimize a least squares criterion (see Eq. 11).
The proposed method for star-shaped contour estimation is summarized as follows:
Variable speed propagation scheme upon the proposed circular antenna :
Estimation of the number of circles by MDL criterion, estimation of the radius of
each circle fitting any expected contour (see Eqs. (12) and (13) or the axial
parameters of the ellipse;
Estimation of the radial distortions, in polar coordinate system, between any
expected contour and the circle or ellipse that fits this contour. Either the
Recent Advances in Signal Processing26
gradient method or the combination of DIRECT and spline interpolation may be
used to minimize a least-squares criterion.
Table 1 provides the steps of the algorithms which perform nearly straight and nearly
circular contour retrieval. Table 1 provides the directions for signal generation, the
parameters which characterize the initialization contour and the output of the optimization
algorithm.
Table 1. Nearly straight and nearly circular distorted contour estimation: algorithm steps.
The current section presented a method for the estimation of the radius of concentric circles
with
a priori knowledge of the center. In the next section we explain how to estimate the
center of groups of concentric circles.
6. Linear antenna for the estimation of circle center parameters
Usually, an image contains several circles which are possibly not concentric and have
different radii (see Fig. 5). To apply the proposed method, the center coordinates for each
feature are required. To estimate these coordinates, we generate a signal with constant
propagation parameter upon the image left and top sides. The
th
l signal component,
generated from the
th
l row, reads:
N
m
lin
jµmexpm,lIlz
1
where
µ
is the
propagation parameter. The non-zero sections of the signals, as seen at the left and top sides
of the image, indicate the presence of features. Each non-zero section width in the left
(respectively the top) side signal gives the height (respectively the width) of the
corresponding expected feature. The middle of each non-zero section in the left (respectively
the top) side signal yields the value of the center
c
l
(respectively
c
m
) coordinate of each
feature.
Fig. 5. Nearly circular or elliptic features.
r
is the circle radius, a and b are the axial
parameters of the ellipse.
7. Combination of linear and circular antenna for intersecting circle retrieval
We propose an algorithm which is based on the following remarks about the generated
signals. Signal generation on linear antenna yields a signal with the following
characteristics: The maximum amplitude values of the generated signal correspond to the
lines with maximum number of pixels, that is, where the tangent to the circle is either
vertical or horizontal. The signal peak values are associated alternatively with one circle and
another. Signal generation on circular antenna yields a signal with the following
characteristics: If the antenna is centered on the same center as a quarter of circle which is
present in the image, the signal which is generated on the antenna exhibits linear phase
properties (Marot & Bourennane, 2007b)
We propose a method that combines linear and circular antenna to retrieve intersecting
circles. We exemplify this method with an image containing two circles (see Fig. 6(a)). It falls
into the following parts:
Generate a signal on a linear antenna placed at the left and bottom sides of the
image;
Associate signal peak 1 (P1) with signal peak 3 (P3), signal peak 2 (P2) with signal
peak 4 (P4);
Diameter 1 is given by the distance P1-P3, diameter 2 is given by the distance P2-
P4;
Center 1 is given by the mid point between P1 and P3, center 2 is given by the mid
point between P2 and P4;
Associate the circular antenna with a sub-image containing center 1 and P1,
perform signal generation. Check the phase linearity of the generated signal;
Associate the circular antenna with a sub-image containing center 2 and P4,
perform signal generation. Check the linearity of the generated signal.
Fig. 6(a) presents, in particular, the square sub-image to which we associate a circular
antenna. Fig. 6(b) and (c) shows the generated signals.
About array processing methods for image segmentation 27
gradient method or the combination of DIRECT and spline interpolation may be
used to minimize a least-squares criterion.
Table 1 provides the steps of the algorithms which perform nearly straight and nearly
circular contour retrieval. Table 1 provides the directions for signal generation, the
parameters which characterize the initialization contour and the output of the optimization
algorithm.
Table 1. Nearly straight and nearly circular distorted contour estimation: algorithm steps.
The current section presented a method for the estimation of the radius of concentric circles
with
a priori knowledge of the center. In the next section we explain how to estimate the
center of groups of concentric circles.
6. Linear antenna for the estimation of circle center parameters
Usually, an image contains several circles which are possibly not concentric and have
different radii (see Fig. 5). To apply the proposed method, the center coordinates for each
feature are required. To estimate these coordinates, we generate a signal with constant
propagation parameter upon the image left and top sides. The
th
l signal component,
generated from the
th
l row, reads:
N
m
lin
jµmexpm,lIlz
1
where
µ
is the
propagation parameter. The non-zero sections of the signals, as seen at the left and top sides
of the image, indicate the presence of features. Each non-zero section width in the left
(respectively the top) side signal gives the height (respectively the width) of the
corresponding expected feature. The middle of each non-zero section in the left (respectively
the top) side signal yields the value of the center
c
l
(respectively
c
m
) coordinate of each
feature.
Fig. 5. Nearly circular or elliptic features.
r
is the circle radius, a and b are the axial
parameters of the ellipse.
7. Combination of linear and circular antenna for intersecting circle retrieval
We propose an algorithm which is based on the following remarks about the generated
signals. Signal generation on linear antenna yields a signal with the following
characteristics: The maximum amplitude values of the generated signal correspond to the
lines with maximum number of pixels, that is, where the tangent to the circle is either
vertical or horizontal. The signal peak values are associated alternatively with one circle and
another. Signal generation on circular antenna yields a signal with the following
characteristics: If the antenna is centered on the same center as a quarter of circle which is
present in the image, the signal which is generated on the antenna exhibits linear phase
properties (Marot & Bourennane, 2007b)
We propose a method that combines linear and circular antenna to retrieve intersecting
circles. We exemplify this method with an image containing two circles (see Fig. 6(a)). It falls
into the following parts:
Generate a signal on a linear antenna placed at the left and bottom sides of the
image;
Associate signal peak 1 (P1) with signal peak 3 (P3), signal peak 2 (P2) with signal
peak 4 (P4);
Diameter 1 is given by the distance P1-P3, diameter 2 is given by the distance P2-
P4;
Center 1 is given by the mid point between P1 and P3, center 2 is given by the mid
point between P2 and P4;
Associate the circular antenna with a sub-image containing center 1 and P1,
perform signal generation. Check the phase linearity of the generated signal;
Associate the circular antenna with a sub-image containing center 2 and P4,
perform signal generation. Check the linearity of the generated signal.
Fig. 6(a) presents, in particular, the square sub-image to which we associate a circular
antenna. Fig. 6(b) and (c) shows the generated signals.
Recent Advances in Signal Processing28
Fig. 6. (a) Two intersecting circles, sub-images containing center 1 and center 2; signals
generated on (b) the bottom of the image, (c) the left side of the image.
8. Results
The proposed star-shaped contour detection method is first applied to a very distorted
circle, and the results obtained are compared with those of the active contour method GVF
(gradient vector flow) (Xu & Prince, 1997). The proposed multiple circle detection method is
applied to several application cases: robotic vision, melanoma segmentation, circle detection
in omnidirectional vision images, blood cell segmentation. In the proposed applications, we
use GVF as a comparative method or as a complement to the proposed circle estimation
method. The values of the parameters for GVF method (Xianghua & Mirmehdi, 2004) are the
following. For the computation of the edge map: 100 iterations;
090,µ
GVF
(regularization
coefficient); for the snakes deformation: 100 initialization points and 50
iterations;
20.
GVF
(tension); 030.
GVF
(rigidity); 1
GVF
(regularization coefficient);
80.
GVF
(gradient strength coefficient). The value of the propagation parameter values
for signal generation in the proposed method are 1
µ and
3
105
.
8.1 Hand-made images
In this subsection we first remind a major result obtained with star-shaped contours, and
then proposed results obtained on intersecting circle retrieval.
8.1.1 Very distorded circles
The abilities of the proposed method to retrieve highly concave contours are illustrated in
Figs. 7 and 8. We provide the mean error value over the pixel radial coordinate
EM . We
notice that this value is higher when GVF is used, as when the proposed method is used.
Fig. 7. Examples of processed images containing the less (a) and the most (d) distorted
circles, initialization (b,e) and estimation using GVF method (c,f).
EM =1.4 pixel and 4.1
pixels.
Fig. 8. Examples of processed images containing the less (a) and the most (d) distorted
circles, initialization (b,e) and estimation using GVF method (c,f).
EM =1.4 pixel and 2.7
pixels.
About array processing methods for image segmentation 29
Fig. 6. (a) Two intersecting circles, sub-images containing center 1 and center 2; signals
generated on (b) the bottom of the image, (c) the left side of the image.
8. Results
The proposed star-shaped contour detection method is first applied to a very distorted
circle, and the results obtained are compared with those of the active contour method GVF
(gradient vector flow) (Xu & Prince, 1997). The proposed multiple circle detection method is
applied to several application cases: robotic vision, melanoma segmentation, circle detection
in omnidirectional vision images, blood cell segmentation. In the proposed applications, we
use GVF as a comparative method or as a complement to the proposed circle estimation
method. The values of the parameters for GVF method (Xianghua & Mirmehdi, 2004) are the
following. For the computation of the edge map: 100 iterations;
090,µ
GVF
(regularization
coefficient); for the snakes deformation: 100 initialization points and 50
iterations;
20.
GVF
(tension); 030.
GVF
(rigidity); 1
GVF
(regularization coefficient);
80.
GVF
(gradient strength coefficient). The value of the propagation parameter values
for signal generation in the proposed method are 1
µ and
3
105
.
8.1 Hand-made images
In this subsection we first remind a major result obtained with star-shaped contours, and
then proposed results obtained on intersecting circle retrieval.
8.1.1 Very distorded circles
The abilities of the proposed method to retrieve highly concave contours are illustrated in
Figs. 7 and 8. We provide the mean error value over the pixel radial coordinate
EM . We
notice that this value is higher when GVF is used, as when the proposed method is used.
Fig. 7. Examples of processed images containing the less (a) and the most (d) distorted
circles, initialization (b,e) and estimation using GVF method (c,f).
EM =1.4 pixel and 4.1
pixels.
Fig. 8. Examples of processed images containing the less (a) and the most (d) distorted
circles, initialization (b,e) and estimation using GVF method (c,f).
EM =1.4 pixel and 2.7
pixels.
Recent Advances in Signal Processing30
8.1.2 Intersecting circles
We first exemplify the proposed method for intersecting circle retrieval on the image of Fig.
9(a), from which we obtain the results of Fig. 9(b) and (c), which presents the signal
generated on both sides of the image. The signal obtained on left side exhibits only two peak
values, because the radius values are very close to each other. Therefore signal generation
on linear antenna provides a rough estimate of each radius, and signal generation on
circular antenna refines the estimation of both values.
The center coordinates of circles 1 and 2 are estimated as
4183
11
,m,l
cc
and
8483
22
,m,l
cc
. Radius 1 is estimated as 24
1
r , radius 2 is estimated as 30
2
r .
The computationally dominant operations while running the algorithm are signal
generation on linear and circular antenna. For this image and with the considered parameter
values, the computational load required for each step is as follows:
signal generation on linear antenna:
2
1083
. sec.;
signal generation on circular antenna:
1
1087
. sec.
So the whole method lasts
1
1018
.
sec. For sake of comparison, generalized Hough
transform with prior knowledge of the radius of the expected circles lasts 2.6 sec. for each
circle. Then it is 6.4 times longer than the proposed method.
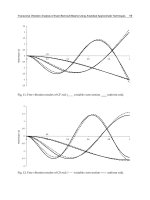
Fig. 9. (a) Processed image; signals generated on: (b) the bottom of the image; (c) the left side
of the image.
The case presented in Figs. 10(a) and 10(b), (c) illustrates the need for the last two steps of
the proposed algorithm. Indeed the signals generated on linear antenna present the same
peak coordinates as the signals generated from the image of Fig. 7(a). However, if a
subimage is selected, and the center of the circular antenna is placed such as in Fig. 7, the
phase of the generated signal is not linear. Therefore, for Fig. 10(a), we take as the diameter
values the distances P1-P4 and P2-P3. The center coordinates of circles 1 and 2 are estimated
as
5568
11
,m,l
cc
and
99104
22
,m,l
cc
. Radius of circle 1 is estimated as 87
1
r ,
radius of circle 2 is estimated as
27
2
r .
Fig. 10. (a) Processed image; signals generated on: (b) the bottom of the image; (c) the left
side of the image.
Here was exemplified the ability of the circular antenna to distinguish between ambiguous
cases.
Fig. 11 shows the results obtained with a noisy image. The percentage of noisy pixels is 15%,
and noise grey level values follow Gaussian distribution with mean 0.1 and standard
deviation 0.005. The presence of noisy pixels induces fluctuations in the generated signals,
Figs. 11(b) and 11(c) show that the peaks that permit to characterize the expected circles are
still dominant over the unexpected fluctuations. So the results obtained do not suffer the
influence of noise pixels. The center coordinates of circles 1 and 2 are estimated
as
88131
11
,m,l
cc
and
14453
22
,m,l
cc
. Radius of circle 1 is estimated as
67
1
r
,
radius of circle 2 is estimated as
40
2
r .
Fig. 11. (a) Processed image; signals generated on: (b) the bottom of the image; (c) the left
side of the image.
8.2 Robotic vision
We now consider a real-world image coming from biometrics (see Fig. 12(a)). This image
contains a contour with high concavity.
Fig. 12(b) gives the result of the initialization of our optimization method. Fig. 12(c) shows
that GVF fails to retrieve the furthest sections of the narrow and deep concavities of the
hand, that correspond to the two right-most fingers. Fig. 12(d) shows that the proposed
method for distortion estimation manages to retrieve all pixel shift values, even the elevated
About array processing methods for image segmentation 31
8.1.2 Intersecting circles
We first exemplify the proposed method for intersecting circle retrieval on the image of Fig.
9(a), from which we obtain the results of Fig. 9(b) and (c), which presents the signal
generated on both sides of the image. The signal obtained on left side exhibits only two peak
values, because the radius values are very close to each other. Therefore signal generation
on linear antenna provides a rough estimate of each radius, and signal generation on
circular antenna refines the estimation of both values.
The center coordinates of circles 1 and 2 are estimated as
4183
11
,m,l
cc
and
8483
22
,m,l
cc
. Radius 1 is estimated as 24
1
r , radius 2 is estimated as 30
2
r .
The computationally dominant operations while running the algorithm are signal
generation on linear and circular antenna. For this image and with the considered parameter
values, the computational load required for each step is as follows:
signal generation on linear antenna:
2
1083
. sec.;
signal generation on circular antenna:
1
1087
. sec.
So the whole method lasts
1
1018
.
sec. For sake of comparison, generalized Hough
transform with prior knowledge of the radius of the expected circles lasts 2.6 sec. for each
circle. Then it is 6.4 times longer than the proposed method.
Fig. 9. (a) Processed image; signals generated on: (b) the bottom of the image; (c) the left side
of the image.
The case presented in Figs. 10(a) and 10(b), (c) illustrates the need for the last two steps of
the proposed algorithm. Indeed the signals generated on linear antenna present the same
peak coordinates as the signals generated from the image of Fig. 7(a). However, if a
subimage is selected, and the center of the circular antenna is placed such as in Fig. 7, the
phase of the generated signal is not linear. Therefore, for Fig. 10(a), we take as the diameter
values the distances P1-P4 and P2-P3. The center coordinates of circles 1 and 2 are estimated
as
5568
11
,m,l
cc
and
99104
22
,m,l
cc
. Radius of circle 1 is estimated as 87
1
r ,
radius of circle 2 is estimated as
27
2
r .
Fig. 10. (a) Processed image; signals generated on: (b) the bottom of the image; (c) the left
side of the image.
Here was exemplified the ability of the circular antenna to distinguish between ambiguous
cases.
Fig. 11 shows the results obtained with a noisy image. The percentage of noisy pixels is 15%,
and noise grey level values follow Gaussian distribution with mean 0.1 and standard
deviation 0.005. The presence of noisy pixels induces fluctuations in the generated signals,
Figs. 11(b) and 11(c) show that the peaks that permit to characterize the expected circles are
still dominant over the unexpected fluctuations. So the results obtained do not suffer the
influence of noise pixels. The center coordinates of circles 1 and 2 are estimated
as
88131
11
,m,l
cc
and
14453
22
,m,l
cc
. Radius of circle 1 is estimated as
67
1
r
,
radius of circle 2 is estimated as
40
2
r .
Fig. 11. (a) Processed image; signals generated on: (b) the bottom of the image; (c) the left
side of the image.
8.2 Robotic vision
We now consider a real-world image coming from biometrics (see Fig. 12(a)). This image
contains a contour with high concavity.
Fig. 12(b) gives the result of the initialization of our optimization method. Fig. 12(c) shows
that GVF fails to retrieve the furthest sections of the narrow and deep concavities of the
hand, that correspond to the two right-most fingers. Fig. 12(d) shows that the proposed
method for distortion estimation manages to retrieve all pixel shift values, even the elevated
Recent Advances in Signal Processing32
ones. We also noticed that the computational time which is required to obtain this result
with GVF is 25-fold higher than the computational time required by the proposed method:
400 sec. are required by GVF, and 16 sec. are required by our method.
Fig. 12. Hand localization: (a) Processed image, (b) initialization, (c) final result obtained
with GVF, (d) final result obtained with the proposed method
8.3 Omnidirectionnal images
Figures 13(a), (b), (c) show three omnidirectional images, obtained with a hyperbolic mirror.
For some images it is useful to remove to parasite circles due to the acquisition system.
The experiment illustrated on Fig. 14 is an example of characterization of two circles that
overlap. Figures 14(a), (b), (c), show for one image the gradient image, the threshold image,
the signal generated on the bottom side of the image (Marot & Bourennane, 2008). The
samples for which the generated signal takes none zero values (see Fig. 14(c)) delimitate the
external circle of Fig. 13(a).
The diameter of the big circle is 485 pixels and the horizontal coordinate of its center is 252
pixels. This permits first to erase the external circle, secondly to characterize the intern circle
by the same method.
Fig. 13. Omnidirectional images
Fig. 14. Circle characterization by signal generation
8.4 Cell segmentation
Fig. 15 presents the case of a real-world image. It contains one red cell and one white cell.
Our goal in this application is to detect both cells. The minimum value in the signal
generated on bottom side of the image corresponds to the frontier between both cells. The
width of the non-zero sections on both sides of the minimum value is the diameter of each
cell. Each peak value in each generated signal provides one center coordinate.
Fig. 15. Blood cells: (a) processed image; (b) superposition processed image and result;
signals generated on: (c) the bottom of the image; (d) the left side of the image.
8.5 Melanoma segmentation
Fig. 16 concerns quantitative analysis in a medical application. More precisely, the purpose
of the experiment is to detect the frontier of a melanoma. The melanoma was chosen
randomly out of a database (Stolz et al., 2003).
About array processing methods for image segmentation 33
ones. We also noticed that the computational time which is required to obtain this result
with GVF is 25-fold higher than the computational time required by the proposed method:
400 sec. are required by GVF, and 16 sec. are required by our method.
Fig. 12. Hand localization: (a) Processed image, (b) initialization, (c) final result obtained
with GVF, (d) final result obtained with the proposed method
8.3 Omnidirectionnal images
Figures 13(a), (b), (c) show three omnidirectional images, obtained with a hyperbolic mirror.
For some images it is useful to remove to parasite circles due to the acquisition system.
The experiment illustrated on Fig. 14 is an example of characterization of two circles that
overlap. Figures 14(a), (b), (c), show for one image the gradient image, the threshold image,
the signal generated on the bottom side of the image (Marot & Bourennane, 2008). The
samples for which the generated signal takes none zero values (see Fig. 14(c)) delimitate the
external circle of Fig. 13(a).
The diameter of the big circle is 485 pixels and the horizontal coordinate of its center is 252
pixels. This permits first to erase the external circle, secondly to characterize the intern circle
by the same method.
Fig. 13. Omnidirectional images
Fig. 14. Circle characterization by signal generation
8.4 Cell segmentation
Fig. 15 presents the case of a real-world image. It contains one red cell and one white cell.
Our goal in this application is to detect both cells. The minimum value in the signal
generated on bottom side of the image corresponds to the frontier between both cells. The
width of the non-zero sections on both sides of the minimum value is the diameter of each
cell. Each peak value in each generated signal provides one center coordinate.
Fig. 15. Blood cells: (a) processed image; (b) superposition processed image and result;
signals generated on: (c) the bottom of the image; (d) the left side of the image.
8.5 Melanoma segmentation
Fig. 16 concerns quantitative analysis in a medical application. More precisely, the purpose
of the experiment is to detect the frontier of a melanoma. The melanoma was chosen
randomly out of a database (Stolz et al., 2003).
Recent Advances in Signal Processing34
Fig. 16. Melanoma segmentation: (a) processed image, (b) elliptic approximation by the
proposed array processing method, (c) result obtained by GVF.
The proposed array processing method detects a circular approximation of the melanoma
borders (Marot & Bourennane, 2007b; Marot & Bourennane, 2008) (see Fig 16(b)). A few
iterations of GVF method (Xu & Prince, 1997) yield the contour of the melanoma (see Fig
16(c)). Such a method can be used to control automatically the evolution of the surface of the
melanoma.
9. Conclusion
This chapter deals with contour retrieval in images. We review the formulation and
resolution of rectilinear or circular contour estimation. The estimation of the parameters of
rectilinear or circular contours is transposed as a source localization problem in array
processing. We presented the principles of SLIDE algorithm for the estimation of rectilinear
contours based on signal generation upon a linear antenna. In this frame, high-resolution
methods of array processing retrieve possibly close parameters of straight lines in images.
We explained the principles of signal generation upon a virtual circular antenna. The
circular antenna permits to generate linear phase signals out of an image containing circular
features. The same signal models as for straight line estimation are obtained, so high-
resolution methods of array processing retrieve possibly close radius values of concentric
circles. For the estimation of distorted contours, we adopted the same conventions for signal
generation, that is, either a linear or a circular antenna. For the first time, in this book
chapter, we propose an intersecting circle retrieval method, based on array processing
algorithms. Signal generation on a linear antenna yields the center coordinates and radii of
all circles. Circular antenna refines the estimation of the radii and distinguishes ambiguous
cases. The proposed star-shaped contour estimation method retrieves contours with high
concavities, thus providing a solution to Snakes based methods. The proposed multiple
circle estimation method retrieves intersecting circles, thus providing a solution to levelset-
type methods. We exemplified the proposed method on hand-made and real-world images.
Further topics to be studied are the robustness to various types of noise, such as correlated
Gaussian noise.
10. References
Abed-Meraim, K. & Hua, Y. (1997). Multi-line fitting and straight edge detection using
polynomial phase signals,
ASILOMAR31, Vol. 2, pp. 1720-1724, 1997.
Aghajan, H. K. & Kailath, T. (1992). A subspace Fitting Approach to Super Resolution Multi-
Line Fitting and Straight Edge Detection,
Proc. of IEEE ICASSP, vol. 3, pp. 121-124,
1992.
Aghajan, H. K. & Kailath, T. (1993a). Sensor array processing techniques for super resolution
multi-line-fitting and straight edge detection,
IEEE Trans. on IP, Vol. 2, No. 4, pp.
454-465, Oct. 1993.
Aghajan, H.K. & Kailath, T. (1993b). SLIDE: subspace-based line detection,
IEEE int. conf.
ASSP
, Vol. 5, pp. 89 - 92, April 27-30, 1993.
Aghajan, H. & Kailath, T. (1995). SLIDE: Subspace-based Line detection,
IEEE Trans. on
PAMI
, 16(11):1057-1073, Nov. 1994.
Aghajan, H.K. (1995). Subspace Techniques for Image Understanding and Computer Vision,
PhD Thesis, Stanford University, 1995
Bourennane, S. & Marot, J. (2005). Line parameters estimation by array processing methods,
IEEE ICASSP, Vol. 4, pp. 965-968, Philadelphie, Mar. 2005.
Bourennane, S. & Marot, J. (2006a). Estimation of straight line offsets by a high resolution
method,
IEE proceedings - Vision, Image and Signal Processing, Vol. 153, issue 2, pp.
224-229, 6 April 2006.
Bourennane, S. & Marot, J. (2006b). Optimization and interpolation for distorted contour
estimation,
IEEE-ICASSP, vol. 2, pp. 717-720, Toulouse, France, April 2006.
Bourennane, S. & Marot, J. (2006c). Contour estimation by array processing methods,
Applied signal processing, article ID 95634, 15 pages, 2006.
Bourennane, S.; Fossati, C. & Marot, J., (2008). About noneigenvector source localization
methods
EURASIP Journal on Advances in Signal Processing Vol. 2008, Article ID
480835, 13 pages doi:10.1155/2008/480835
Brigger, P. ; Hoeg, J. & Unser, M. (2000). B-Spline Snakes: A Flexible Tool for Parametric
Contour Detection,
IEEE Trans. on IP, vol. 9, No. 9, pp. 1484-96, 2000.
Cheng, J. & Foo, S. W. (2006). Dynamic directional gradient vector flow for snakes,
IEEE
Trans. on Image Processing
, vol. 15, no. 6, pp.1563-1571, June 2006.
Connell, S. D. & Jain, A. K. (2001). Template-based online character recognition,
Pattern
Rec.,
vol. 34, no 1, pp: 1-14, 2001.
Gander, W.; Golub, G.H. & Strebel, R. (1994). Least-squares fitting of circles and ellipses ,
BIT, n. 34, pp. 558-578, 1994.
Halder, B. ; Aghajan, H. & T. Kailath (1995). Propagation diversity enhancement to the
subspace-based line detection algorithm,
Proc. SPIE Nonlinear Image Processing VI
Vol. 2424, p. 320-328, pp. 320-328, March 1995.
Jones, D.R. ; Pertunen, C.D. & Stuckman, B.E. (1993). Lipschitzian optimization without the
Lipschitz constant,
Journal of Optimization and Applications, vol. 79, no. 157-181, 1993.
Karoui, I.; Fablet, R.; Boucher, J M. & Augustin, J M. (2006). Region-based segmentation
using texture statistics and level-set methods,
IEEE ICASSP, pp. 693-696, 2006.
Kass, M.; Witkin, A. & Terzopoulos, D. (1998). Snakes: Active Contour Model,
Int. J. of
Comp. Vis.
, pp.321-331, 1988
Kiryati, N. & Bruckstein, A.M. (1992). What's in a set of points? [straight line fitting],
IEEE
Trans. on PAMI
, Vol. 14, No. 4, pp.496-500, April 1992.
About array processing methods for image segmentation 35
Fig. 16. Melanoma segmentation: (a) processed image, (b) elliptic approximation by the
proposed array processing method, (c) result obtained by GVF.
The proposed array processing method detects a circular approximation of the melanoma
borders (Marot & Bourennane, 2007b; Marot & Bourennane, 2008) (see Fig 16(b)). A few
iterations of GVF method (Xu & Prince, 1997) yield the contour of the melanoma (see Fig
16(c)). Such a method can be used to control automatically the evolution of the surface of the
melanoma.
9. Conclusion
This chapter deals with contour retrieval in images. We review the formulation and
resolution of rectilinear or circular contour estimation. The estimation of the parameters of
rectilinear or circular contours is transposed as a source localization problem in array
processing. We presented the principles of SLIDE algorithm for the estimation of rectilinear
contours based on signal generation upon a linear antenna. In this frame, high-resolution
methods of array processing retrieve possibly close parameters of straight lines in images.
We explained the principles of signal generation upon a virtual circular antenna. The
circular antenna permits to generate linear phase signals out of an image containing circular
features. The same signal models as for straight line estimation are obtained, so high-
resolution methods of array processing retrieve possibly close radius values of concentric
circles. For the estimation of distorted contours, we adopted the same conventions for signal
generation, that is, either a linear or a circular antenna. For the first time, in this book
chapter, we propose an intersecting circle retrieval method, based on array processing
algorithms. Signal generation on a linear antenna yields the center coordinates and radii of
all circles. Circular antenna refines the estimation of the radii and distinguishes ambiguous
cases. The proposed star-shaped contour estimation method retrieves contours with high
concavities, thus providing a solution to Snakes based methods. The proposed multiple
circle estimation method retrieves intersecting circles, thus providing a solution to levelset-
type methods. We exemplified the proposed method on hand-made and real-world images.
Further topics to be studied are the robustness to various types of noise, such as correlated
Gaussian noise.
10. References
Abed-Meraim, K. & Hua, Y. (1997). Multi-line fitting and straight edge detection using
polynomial phase signals,
ASILOMAR31, Vol. 2, pp. 1720-1724, 1997.
Aghajan, H. K. & Kailath, T. (1992). A subspace Fitting Approach to Super Resolution Multi-
Line Fitting and Straight Edge Detection,
Proc. of IEEE ICASSP, vol. 3, pp. 121-124,
1992.
Aghajan, H. K. & Kailath, T. (1993a). Sensor array processing techniques for super resolution
multi-line-fitting and straight edge detection,
IEEE Trans. on IP, Vol. 2, No. 4, pp.
454-465, Oct. 1993.
Aghajan, H.K. & Kailath, T. (1993b). SLIDE: subspace-based line detection,
IEEE int. conf.
ASSP
, Vol. 5, pp. 89 - 92, April 27-30, 1993.
Aghajan, H. & Kailath, T. (1995). SLIDE: Subspace-based Line detection,
IEEE Trans. on
PAMI
, 16(11):1057-1073, Nov. 1994.
Aghajan, H.K. (1995). Subspace Techniques for Image Understanding and Computer Vision,
PhD Thesis, Stanford University, 1995
Bourennane, S. & Marot, J. (2005). Line parameters estimation by array processing methods,
IEEE ICASSP, Vol. 4, pp. 965-968, Philadelphie, Mar. 2005.
Bourennane, S. & Marot, J. (2006a). Estimation of straight line offsets by a high resolution
method,
IEE proceedings - Vision, Image and Signal Processing, Vol. 153, issue 2, pp.
224-229, 6 April 2006.
Bourennane, S. & Marot, J. (2006b). Optimization and interpolation for distorted contour
estimation,
IEEE-ICASSP, vol. 2, pp. 717-720, Toulouse, France, April 2006.
Bourennane, S. & Marot, J. (2006c). Contour estimation by array processing methods,
Applied signal processing, article ID 95634, 15 pages, 2006.
Bourennane, S.; Fossati, C. & Marot, J., (2008). About noneigenvector source localization
methods
EURASIP Journal on Advances in Signal Processing Vol. 2008, Article ID
480835, 13 pages doi:10.1155/2008/480835
Brigger, P. ; Hoeg, J. & Unser, M. (2000). B-Spline Snakes: A Flexible Tool for Parametric
Contour Detection,
IEEE Trans. on IP, vol. 9, No. 9, pp. 1484-96, 2000.
Cheng, J. & Foo, S. W. (2006). Dynamic directional gradient vector flow for snakes,
IEEE
Trans. on Image Processing
, vol. 15, no. 6, pp.1563-1571, June 2006.
Connell, S. D. & Jain, A. K. (2001). Template-based online character recognition,
Pattern
Rec.,
vol. 34, no 1, pp: 1-14, 2001.
Gander, W.; Golub, G.H. & Strebel, R. (1994). Least-squares fitting of circles and ellipses ,
BIT, n. 34, pp. 558-578, 1994.
Halder, B. ; Aghajan, H. & T. Kailath (1995). Propagation diversity enhancement to the
subspace-based line detection algorithm,
Proc. SPIE Nonlinear Image Processing VI
Vol. 2424, p. 320-328, pp. 320-328, March 1995.
Jones, D.R. ; Pertunen, C.D. & Stuckman, B.E. (1993). Lipschitzian optimization without the
Lipschitz constant,
Journal of Optimization and Applications, vol. 79, no. 157-181, 1993.
Karoui, I.; Fablet, R.; Boucher, J M. & Augustin, J M. (2006). Region-based segmentation
using texture statistics and level-set methods,
IEEE ICASSP, pp. 693-696, 2006.
Kass, M.; Witkin, A. & Terzopoulos, D. (1998). Snakes: Active Contour Model,
Int. J. of
Comp. Vis.
, pp.321-331, 1988
Kiryati, N. & Bruckstein, A.M. (1992). What's in a set of points? [straight line fitting],
IEEE
Trans. on PAMI
, Vol. 14, No. 4, pp.496-500, April 1992.
Recent Advances in Signal Processing36
Marot, J. & Bourennane, S. (2007a). Array processing and fast Optimization Algorithms
for Distorted Circular Contour Retrieval ,
EURASIP Journal on Advances in Signal
Processing
, Vol. 2007, article ID 57354, 13 pages, 2007.
Marot, J. & Bourennane, S. (2007b). Subspace-Based and DIRECT Algorithms for Distorted
Circular Contour Estimation,
IEEE Trans. On Image Processing, Vol. 16, No. 9, pp.
2369-2378, sept. 2007.
Marot, J., Bourennane, S. & Adel, M. (2007). Array processing approach for object
segmentation in images,
IEEE ICASSP'07, Vol. 1, pp. 621-24, April 2007.
Marot, J. & Bourennane, S. (2008). Array processing for intersecting circle retrieval,
EUSIPCO'08, 5 pages, Aug. 2008.
Marot, J.; Fossati, C.; & Bourennane, S. (2008) Fast subspace-based source localization
methods
IEEE-Sensor array multichannel signal processing workshop, Darmstadt
Germany, 07/ 2008
Osher, S. & Sethian, J. (1998). Fronts propagating with curvature-dependent speed:
algorithms based on Hamilton-Jacobi formulations,
J. Comput. Phys. , Vol. 79, pp.
12-49, 1988.
Paragios, N. & Deriche, R. (2002). Geodesic Active Regions and Level Set Methods for
Supervised Texture Segmentation,
Int'l Journal of Computer Vision, Vol. 46, No 3, pp.
223-247, Feb. 2002.
Pillai, S.U. & Kwon, B.H. (1989). Forward/backward spatial smoothing techniques for
coherent signal identification,
Proc. of IEEE trans. on ASSP, vol. 37 (1), pp. 8-15,
1989.
Precioso, F. ; Barlaud, M. ; Blu, T. & Unser, M. (2005). Robust Real-Time Segmentation of
Images and Videos Using a Smooth-Spline Snake-Based Algorithm,
IEEE Trans. on
IP
, Vol. 14, No. 7, pp. 910-924, July 2005.
Roy, R. & Kailath, T. (1989). ESPRIT: Estimation of signal parameters via rotational
invariance techniques,
IEEE Trans. on ASSP, vol. 37, no. 7, pp. 984-995, 1989.
Sheinvald, J. & Kiryati,N. (1997). On the Magic of SLIDE,
Machine Vision and Applications,
Vol. 9, pp. 251-261, 1997.
Stolz, W. ; Horsch, A. ; Pompl, R. ; Abmayr, W. ; Landthaler, M. (2003) Datensatz
Dermatology Skin Surface Microscopy Melanocytic Lesions 749, Version 1.0,
October 2003 (D-SSM-ML-749 V1.0).
Tufts, D.W. & Kumaresan, R. (1982). Estimation of frequencies of multiple sinusoids:
making linear prediction perform like maximum likelihood,
Proc. IEEE, vol. 70, pp.
975-989, sept. 1982.
Unser, M. ; Aldroubi, A. & Eden, M. (1993). B-spline signal processing: Part I-theory; part II-
efficient design and applications,
IEEE Trans. on SP, Vol. 41, No. 2, pp. 821-848, Feb.
1993.
Xianghua X. & Mirmehdi, M. (2004). RAGS: region-aided geometric snake ,
IEEE Trans. IP,
Vol. 13, no. 5, pp: 640-652, May 2004.
Xu, C. & Prince, J.L. (1997). Gradient vector flow: a new external force for snakes,
Proceeding
of IEEE Computer Society Conference on Computer
-Vision and Pattern Recognition pp.
66-71, Jun. 1997.
Zhu, S. C. & Yuille, A. (1996). Region Competition: Unifying Snakes, Region Growing, and
Bayes /MDL for Multiband Image Segmentation,
IEEE Trans. on PAMI, Vol. 18, No.
9, pp. 884-900, Sept. 1996.
Locally Adaptive Resolution (LAR) codec 37
Locally Adaptive Resolution (LAR) codec
François Pasteau, Marie Babel, Olivier Déforges,
Clément Strauss and Laurent Bédat
X
Locally Adaptive Resolution (LAR) codec
François Pasteau, Marie Babel, Olivier Déforges,
Clément Strauss and Laurent Bédat
IETR - INSA Rennes
France
1. Introduction
Despite many drawbacks and limitations, JPEG is still the most commonly-used
compression format in the world. JPEG2000 overcomes this old technique, particularly at
low bit rates, but at the expense of a significant increase in complexity. A new compression
format called JPEG XR has recently been developed with minimum complexity. However, it
does not outperform JPEG 2000 in most cases (De Simone et al., 2007) and does not offer
many new functionalities (Srinivasan et al., 2007). Therefore, the JPEG normalization group
has recently proposed a call for proposals on JPEG-AIC (Advanced Image Coding) in order
to look for new solutions for still image coding techniques (JPEG normalization group,
2007). Its requirements reflect the earlier ideas of Amir Said (Said & Pearlman, 1993) for a
good image coder i.e. compression efficiency, scalability, good quality at low bit rates,
flexibility and adaptability, rate and quality control, algorithm unicity (with/without
losses), reduced complexity, error robustness (for instance in wireless transmission) and
region of interest decoding at decoder level. Additional functionalities such as image
processing at region level, both in the coder or the decoder, could be explored. One other
important feature is complexity, in particular for embedded systems such as cameras or
mobile phones, in which power consumption restriction is more critical nowadays than
memory constraints. The reconfiguration ability of the coding sub-system can then be used
to dynamically adapt the complexity to the current consumption and processing power of
the system. In this context, we proposed the Locally Adaptive Resolution (LAR) codec as a
contribution to the relative call for technologies, since it suited all previous functionalities.
The related method is a coding solution that simultaneously proposes a relevant
representation of the image. This property is exploited through various complementary
coding schemes in order to design a highly scalable encoder.
The LAR method was initially introduced for lossy image coding. This efficient and original
image compression solution relies on a content-based system driven by a specific quadtree
representation, based on the assumption that an image can be represented as layers of basic
information and local texture. Multiresolution versions of this codec have shown their
efficiency, from low bit rates up to lossless compressed images. An original hierarchical self-
extracting region representation has also been elaborated, with a segmentation process
realized at both coder and decoder, leading to a free segmentation map. The map can then
be further exploited for color region encoding or image handling at region level. Moreover,
3
Recent Advances in Signal Processing38
the inherent structure of the LAR codec can be used for advanced functionalities such as
content securization purposes. In particular, dedicated Unequal Error Protection systems
have been produced and tested for transmission over the Internet or wireless channels.
Hierarchical selective encryption techniques have been adapted to our coding scheme. A
data hiding system based on the LAR multiresolution description allows efficient content
protection. Thanks to the modularity of our coding scheme, complexity can be adjusted to
address various embedded systems. For example, a basic version of the LAR coder has been
implemented onto an FPGA platform while respecting real-time constraints. Pyramidal LAR
solution and hierarchical segmentation processes have also been prototyped on
heterogeneous DSP architectures.
Rather than providing a comprehensive overview that covers all technical aspects of the
LAR codec design, this chapter focuses on a few representative features of its core coding
technology. Firstly, profiles will be introduced. Then functionalities such as scalability,
hierarchical region representation, adjustable profiles and complexity, lossy and lossless
coding will be explained. Services such as cryptography, steganography, error resilience,
hierarchical securized processes will be described. Finally application domains such as
natural images, medical images and art images will be described.
An extension of the LAR codec is being developed with a view to video coding , but this
chapter will not describe it and will stay focused on still image coding.
2. Design characteristics and profiles
The LAR codec tries to combine both efficient compression in a lossy or lossless context and
advanced functionalities and services as described before. To provide a codec which is
adaptable and flexible in terms of complexity and functionality, various tools have been
developed. These tools are then combined in three profiles in order to address such
flexibility features (Fig. 1).
Fig. 1. Specific coding parts for LAR profiles
Therefore, each profile corresponds to different functionalities and different complexities:
- Baseline profile: low complexity, low functionality,
- Pyramidal profile: higher complexity but new functionalities such as scalability and
rate control,
- Extended profile: higher complexity, but also includesscalable color region
representation and coding, cryptography, data hiding, unequal
error protection.
3. Technical features
3.1 Characteristics of the LAR encoding method
The LAR (Locally Adaptive Resolution) codec relies on a two-layer system (Fig. 2) (Déforges
et al., 2007). The first layer, called Flat coder, leads to the construction of a low bit-rate
version of the image with good visual properties. The second layer deals with the texture. It
is encoded through a texture coder, to achieve visual quality enhancement at medium/high
bit-rates. Therefore, the method offers a natural basic SNR scalability.
Fig. 2. General scheme of a two-layer LAR coder
The basic idea is that local resolution, in other words pixel size, can depend on local activity,
estimated through a local morphological gradient. This image decomposition into two sets
of data is thus performed in accordance with a specific quadtree data structure encoded in
the Flat coding stage. Thanks to this type of block decomposition, their size implicitly gives
the nature of the given block i.e. the smallest blocks are located at the edges whereas large
blocks map homogeneous areas. Then, the main feature of the FLAT coder consists of
preserving contours while smoothing homogeneous parts of the image (Fig. 3).
This quadtree partition is the key system of the LAR codec. Consequently, this coding part is
required whatever the chosen profile.
Fig. 3. Flat coding of “Lena” picture without post processing
Locally Adaptive Resolution (LAR) codec 39
the inherent structure of the LAR codec can be used for advanced functionalities such as
content securization purposes. In particular, dedicated Unequal Error Protection systems
have been produced and tested for transmission over the Internet or wireless channels.
Hierarchical selective encryption techniques have been adapted to our coding scheme. A
data hiding system based on the LAR multiresolution description allows efficient content
protection. Thanks to the modularity of our coding scheme, complexity can be adjusted to
address various embedded systems. For example, a basic version of the LAR coder has been
implemented onto an FPGA platform while respecting real-time constraints. Pyramidal LAR
solution and hierarchical segmentation processes have also been prototyped on
heterogeneous DSP architectures.
Rather than providing a comprehensive overview that covers all technical aspects of the
LAR codec design, this chapter focuses on a few representative features of its core coding
technology. Firstly, profiles will be introduced. Then functionalities such as scalability,
hierarchical region representation, adjustable profiles and complexity, lossy and lossless
coding will be explained. Services such as cryptography, steganography, error resilience,
hierarchical securized processes will be described. Finally application domains such as
natural images, medical images and art images will be described.
An extension of the LAR codec is being developed with a view to video coding , but this
chapter will not describe it and will stay focused on still image coding.
2. Design characteristics and profiles
The LAR codec tries to combine both efficient compression in a lossy or lossless context and
advanced functionalities and services as described before. To provide a codec which is
adaptable and flexible in terms of complexity and functionality, various tools have been
developed. These tools are then combined in three profiles in order to address such
flexibility features (Fig. 1).
Fig. 1. Specific coding parts for LAR profiles
Therefore, each profile corresponds to different functionalities and different complexities:
- Baseline profile: low complexity, low functionality,
- Pyramidal profile: higher complexity but new functionalities such as scalability and
rate control,
- Extended profile: higher complexity, but also includesscalable color region
representation and coding, cryptography, data hiding, unequal
error protection.
3. Technical features
3.1 Characteristics of the LAR encoding method
The LAR (Locally Adaptive Resolution) codec relies on a two-layer system (Fig. 2) (Déforges
et al., 2007). The first layer, called Flat coder, leads to the construction of a low bit-rate
version of the image with good visual properties. The second layer deals with the texture. It
is encoded through a texture coder, to achieve visual quality enhancement at medium/high
bit-rates. Therefore, the method offers a natural basic SNR scalability.
Fig. 2. General scheme of a two-layer LAR coder
The basic idea is that local resolution, in other words pixel size, can depend on local activity,
estimated through a local morphological gradient. This image decomposition into two sets
of data is thus performed in accordance with a specific quadtree data structure encoded in
the Flat coding stage. Thanks to this type of block decomposition, their size implicitly gives
the nature of the given block i.e. the smallest blocks are located at the edges whereas large
blocks map homogeneous areas. Then, the main feature of the FLAT coder consists of
preserving contours while smoothing homogeneous parts of the image (Fig. 3).
This quadtree partition is the key system of the LAR codec. Consequently, this coding part is
required whatever the chosen profile.
Fig. 3. Flat coding of “Lena” picture without post processing
Recent Advances in Signal Processing40
3.2 Baseline Profile
The baseline profile is dedicated to low bit-rate encoding (Déforges et al., 2007). As
previously mentioned, the quadtree partition builds a variable block size representation of
the image and the LAR low-resolution image is obtained when filling each block by its mean
luminance value. Moreover, in a lossy context, this semantic information controls a
quantization of the luminance. Large blocks require fine quantization (in uniform areas,
human vision is highly sensitive to brightness variations) while coarse quantization (low
sensitivity) is sufficient for small blocks. Block values are encoded through a DPCM scheme,
adapted to our block representation.
The flat LAR coder is clearly dedicated to low bit-rate image coding. To obtain higher image
quality, the texture (whole error image) can be encoded through the spectral coder (second
layer of the LAR coding scheme) which uses a DCT adaptive block size approach. In this
case, both the size and the DC components are provided by the flat coder. The use of
adapted block size naturally allows for a semantic scalable encoding process. For example,
edge enhancement can be achieved by only transmitting the AC coefficients of small blocks.
Further refinements can be envisaged by progressively sending larger block information.
With regard to the entropy coder, we simply adapted the classical Golomb-Rice coder for
low complex applications, and the arithmetic coder for better compression results.
3.3 Pyramidal Profile
To both increase scalability capacity and address lossless compression, we have proposed
multiresolution extensions of the basic LAR called Interleaved S+P (Babel et al., 2005) and
RWHaT+P (Déforges et al., 2005). The overall approach used in these two techniques is
identical; the only difference lies in the decomposition step. To fit the Quadtree partition,
dyadic decomposition is carried out. The first and second layers of the basic LAR are
replaced by two successive pyramidal decomposition processes. However the image
representation content is preserved. The first decomposition reconstructs the low-resolution
image (block image) while the second one processes local texture information (Fig. 2). These
methods provide both increasing scalability and an efficient lossy to lossless compression
solution.
Fig. 4. LAR pyramidal decomposition
In the pyramidal profile, we use mainly the arithmetic coding scheme for prediction error
encoding. The original structure of the LAR codec automatically produces context
modelling, reducing zeroth order entropy cost. By adding specific inter-classification
methods, the compression efficiency can be greatly increased (Pasteau et al.,2008);(Déforges
et al., 2008).
3.4 Hierarchical region representation and coding - Extended Profile
For color images, we have designed an original hierarchical region-based representation
technique adapted to the LAR coding method. An initial solution has already been proposed
in (Déforges et al., 2007). To avoid the prohibitive cost of region shape descriptions, the most
suitable solution consists of performing the segmentation directly, in both the coder and
decoder, using only a low bit-rate compressed image resulting from the flat coder (or first
partial pyramidal decomposition). Natural extensions of this particular process have also
made it possible to address medium and high quality encoding and the region-level
encoding of chromatic images. Another direct application for self-extracting region
representation is found in a coding scheme with local enhancement in Regions Of Interest
(ROI). Current work is aimed at providing a fully multiresolution version of our
segmentation process. Indeed, this region representation can be connected to the pyramidal
decomposition in order to build a highly scalable compression solution.
The extended profile also proposes the use of dedicated steganography and cryptography
processes, which will be presented in the next sections.
To sum up, the interoperability of coding and representation operations leads to an
interactive coding tool. The main features of the LAR coding parts are depicted on Fig. 5.
Fig. 5. Block diagram of extended profile of the LAR coder
4. Functionalities
4.1 Scalable lossy to lossless compression
The pyramidal description of the images resulting from Interleaved S+P or RWHaT+P
encoding provides various scalability levels. The
conditional decomposition (the constraint
of two successive descent processes by the initial quadtree partition of the image) provides a
highly scalable representation in terms of both resolution and quality.
This scalable solution allows compression from lossy up to lossless configuration. The
pyramidal profile codec has been tested and has shown its efficiency on natural images as
Locally Adaptive Resolution (LAR) codec 41
3.2 Baseline Profile
The baseline profile is dedicated to low bit-rate encoding (Déforges et al., 2007). As
previously mentioned, the quadtree partition builds a variable block size representation of
the image and the LAR low-resolution image is obtained when filling each block by its mean
luminance value. Moreover, in a lossy context, this semantic information controls a
quantization of the luminance. Large blocks require fine quantization (in uniform areas,
human vision is highly sensitive to brightness variations) while coarse quantization (low
sensitivity) is sufficient for small blocks. Block values are encoded through a DPCM scheme,
adapted to our block representation.
The flat LAR coder is clearly dedicated to low bit-rate image coding. To obtain higher image
quality, the texture (whole error image) can be encoded through the spectral coder (second
layer of the LAR coding scheme) which uses a DCT adaptive block size approach. In this
case, both the size and the DC components are provided by the flat coder. The use of
adapted block size naturally allows for a semantic scalable encoding process. For example,
edge enhancement can be achieved by only transmitting the AC coefficients of small blocks.
Further refinements can be envisaged by progressively sending larger block information.
With regard to the entropy coder, we simply adapted the classical Golomb-Rice coder for
low complex applications, and the arithmetic coder for better compression results.
3.3 Pyramidal Profile
To both increase scalability capacity and address lossless compression, we have proposed
multiresolution extensions of the basic LAR called Interleaved S+P (Babel et al., 2005) and
RWHaT+P (Déforges et al., 2005). The overall approach used in these two techniques is
identical; the only difference lies in the decomposition step. To fit the Quadtree partition,
dyadic decomposition is carried out. The first and second layers of the basic LAR are
replaced by two successive pyramidal decomposition processes. However the image
representation content is preserved. The first decomposition reconstructs the low-resolution
image (block image) while the second one processes local texture information (Fig. 2). These
methods provide both increasing scalability and an efficient lossy to lossless compression
solution.
Fig. 4. LAR pyramidal decomposition
In the pyramidal profile, we use mainly the arithmetic coding scheme for prediction error
encoding. The original structure of the LAR codec automatically produces context
modelling, reducing zeroth order entropy cost. By adding specific inter-classification
methods, the compression efficiency can be greatly increased (Pasteau et al.,2008);(Déforges
et al., 2008).
3.4 Hierarchical region representation and coding - Extended Profile
For color images, we have designed an original hierarchical region-based representation
technique adapted to the LAR coding method. An initial solution has already been proposed
in (Déforges et al., 2007). To avoid the prohibitive cost of region shape descriptions, the most
suitable solution consists of performing the segmentation directly, in both the coder and
decoder, using only a low bit-rate compressed image resulting from the flat coder (or first
partial pyramidal decomposition). Natural extensions of this particular process have also
made it possible to address medium and high quality encoding and the region-level
encoding of chromatic images. Another direct application for self-extracting region
representation is found in a coding scheme with local enhancement in Regions Of Interest
(ROI). Current work is aimed at providing a fully multiresolution version of our
segmentation process. Indeed, this region representation can be connected to the pyramidal
decomposition in order to build a highly scalable compression solution.
The extended profile also proposes the use of dedicated steganography and cryptography
processes, which will be presented in the next sections.
To sum up, the interoperability of coding and representation operations leads to an
interactive coding tool. The main features of the LAR coding parts are depicted on Fig. 5.
Fig. 5. Block diagram of extended profile of the LAR coder
4. Functionalities
4.1 Scalable lossy to lossless compression
The pyramidal description of the images resulting from Interleaved S+P or RWHaT+P
encoding provides various scalability levels. The
conditional decomposition (the constraint
of two successive descent processes by the initial quadtree partition of the image) provides a
highly scalable representation in terms of both resolution and quality.
This scalable solution allows compression from lossy up to lossless configuration. The
pyramidal profile codec has been tested and has shown its efficiency on natural images as
Recent Advances in Signal Processing42
depicted on Fig. 6 and Table 1, as well as medical images (Babel et al., 2008) and high
resolution art images (Babel et al., 2007).
Fig. 6. Objective comparisons of Jpeg, Jpeg2000 and LAR Interleaved S+P codec for WPSNR
PIX RGB metric (De Simone et al., 2008) on the lena image
Image RGB YDbDr JPEG 2000
Lena 13.21 bpp 13.22 bpp 13.67 bpp
Mandrill 17.98 bpp 17.99 bpp 18.18 bpp
Pimento 14.60 bpp 14.87 bpp 14.92 bpp
Fruit 10.42 bpp 10.46 bpp 9.58 bpp
Table 1. JPEG 2000 / LAR coder comparison of color lossless compression of natural images
with different color spaces.
4.2 Region level handling
Through the definition of a Region of Interest (ROI), images can be lossly compressed
overall and losslessly encoded locally as shown on Fig. 7. Combined with a progressive
encoding scheme, region scalability allows faster access to significant data. The LAR scheme
enables more flexible solutions in terms of ROI shape and size. Indeed, an ROI can be
simply described at both the coder and decoder as a set of blocks resulting from the
quadtree partition. As the ROI is built from the variable block size representation, its
enhancement (texture coding) is straightforward - it merely requires execution of the
Interleaved S+P or RWHaT codec for the validated blocks, i.e. ROI internal blocks. Unlike
traditional compression techniques, the LAR low resolution image does not introduce
strong distortions on the ROI contours. Such distortion usually makes the image too
unreliable to be used (Babel et al., 2007); (Babel et al., 2003).
Fig. 7. ROI enhancement scheme of LAR codec
4.3 Adjustable complexity
The modularity of our scheme produces a new level of scalability in terms of complexity,
closely related to the chosen profile. The IETR laboratory also aims to provide automatic
solutions of fast prototyping onto heterogeneous architecture (DSPs, FPGAs), using
Algorithm Architecture Matching methodology. Consequently, although the LAR codec has
been developed on PCs, we can easily implement various LAR versions on embedded
systems.
Previous work focused on fast development and the implementation of the distributed LAR
image compression framework on multi-components for flat LAR (Raulet et al., 2003), or for
extended profiles with the proper region description, using cosimulation approaches
(Flécher et al., 2007). For these embedded versions, we used the Golomb-Rice coder as the
entropy coder, because of its lower complexity.
We presented in (Déforges & Babel, 2008) a dedicated FPGA implementation of the FLAT
LAR image coder. This coding technique is particularly suitable for low bit-rate
compressions. From an image quality point of view, the FLAT LAR presents better results
than JPEG, while implementation resources requirements are similar. Internal architecture
has been designed as a set of parallel and pipelined stages, enabling full image processing
during a single regular scan. The architecture latency is extremely low as it is determined by
the data acquisition for one slice of 8 lines.
5. Services
5.1 Error resilience
Protecting the encoded bit-stream against error transmission is required when using
networks with no guaranteed quality of service (QoS). In particular, the availability of the
information can be ensured by the Internet protocol (IP). We focused our studies on two
topics, namely the loss of entire IP packets and transmission over wireless channels.
Locally Adaptive Resolution (LAR) codec 43
depicted on Fig. 6 and Table 1, as well as medical images (Babel et al., 2008) and high
resolution art images (Babel et al., 2007).
Fig. 6. Objective comparisons of Jpeg, Jpeg2000 and LAR Interleaved S+P codec for WPSNR
PIX RGB metric (De Simone et al., 2008) on the lena image
Image RGB YDbDr JPEG 2000
Lena 13.21 bpp 13.22 bpp 13.67 bpp
Mandrill 17.98 bpp 17.99 bpp 18.18 bpp
Pimento 14.60 bpp 14.87 bpp 14.92 bpp
Fruit 10.42 bpp 10.46 bpp 9.58 bpp
Table 1. JPEG 2000 / LAR coder comparison of color lossless compression of natural images
with different color spaces.
4.2 Region level handling
Through the definition of a Region of Interest (ROI), images can be lossly compressed
overall and losslessly encoded locally as shown on Fig. 7. Combined with a progressive
encoding scheme, region scalability allows faster access to significant data. The LAR scheme
enables more flexible solutions in terms of ROI shape and size. Indeed, an ROI can be
simply described at both the coder and decoder as a set of blocks resulting from the
quadtree partition. As the ROI is built from the variable block size representation, its
enhancement (texture coding) is straightforward - it merely requires execution of the
Interleaved S+P or RWHaT codec for the validated blocks, i.e. ROI internal blocks. Unlike
traditional compression techniques, the LAR low resolution image does not introduce
strong distortions on the ROI contours. Such distortion usually makes the image too
unreliable to be used (Babel et al., 2007); (Babel et al., 2003).
Fig. 7. ROI enhancement scheme of LAR codec
4.3 Adjustable complexity
The modularity of our scheme produces a new level of scalability in terms of complexity,
closely related to the chosen profile. The IETR laboratory also aims to provide automatic
solutions of fast prototyping onto heterogeneous architecture (DSPs, FPGAs), using
Algorithm Architecture Matching methodology. Consequently, although the LAR codec has
been developed on PCs, we can easily implement various LAR versions on embedded
systems.
Previous work focused on fast development and the implementation of the distributed LAR
image compression framework on multi-components for flat LAR (Raulet et al., 2003), or for
extended profiles with the proper region description, using cosimulation approaches
(Flécher et al., 2007). For these embedded versions, we used the Golomb-Rice coder as the
entropy coder, because of its lower complexity.
We presented in (Déforges & Babel, 2008) a dedicated FPGA implementation of the FLAT
LAR image coder. This coding technique is particularly suitable for low bit-rate
compressions. From an image quality point of view, the FLAT LAR presents better results
than JPEG, while implementation resources requirements are similar. Internal architecture
has been designed as a set of parallel and pipelined stages, enabling full image processing
during a single regular scan. The architecture latency is extremely low as it is determined by
the data acquisition for one slice of 8 lines.
5. Services
5.1 Error resilience
Protecting the encoded bit-stream against error transmission is required when using
networks with no guaranteed quality of service (QoS). In particular, the availability of the
information can be ensured by the Internet protocol (IP). We focused our studies on two
topics, namely the loss of entire IP packets and transmission over wireless channels.
Recent Advances in Signal Processing44
Limited bandwidth and distortions are the main features of a wireless channel. Therefore,
both compression and secured transmission of sensitive data are simultaneously required.
The pyramidal version of the LAR method and an Unequal Error Protection strategy are
applied respectively to compress and protect the original image. The UEP strategy takes
account of the sensitivity of the substreams requiring protection then optimizes the
redundancy rate. In our application, we used the Reed Solomon Error Correcting Code RS-
ECC, combined with symbol block interleaving for simulated transmission over the COST27
TU channel (W. Hamidouche et al., 2009). When comparing this to the JPWL system, we
show that the proposed layout is better than the JPWL system, especially when transmission
conditions are poor (SNR<21 dB).
With regard to the other topic, compensating IP packet loss also requires an UEP process.
This is done by using an exact and discrete Radon transform, the Mojette transform (Babel et
al., 2008). The frame-like definition of this transform allows redundancies that can be further
used for image description and image communication (Fig. 8), for QoS purposes.
Fig. 8. General joint LAR-Mojette coding scheme
5.2 Content securization: cryptography and steganography
Besides watermarking, steganography, and techniques for assessing data integrity and
authenticity, providing confidentiality and privacy for visual data is one of the most
important topics in the area of multimedia security. Our research focuses on fast encryption
procedures specifically tailored to the target environment. For that purpose, we use the
pyramidal profile with Interleaved S+P configuration.
As the representation relies entirely on knowledge of the quadtree partition, this partition
needs to be transmitted without any error. Previous work on error resilience dealt with that
aspect and has shown that the decoder was still able to decode erroneous bit-streams. In that
case, visual quality was very poor as depicted on Fig. 10, even when only a few bits of the
quadtree were wrongly transmitted. Consequently, we propose to encrypt different levels of
the quadtree partition description, as depicted on Fig. 9 (Fonteneau et al., 2008). This
scheme is equivalent to a selective encryption process. Indeed, the encryption of a given
level of the partition prevents the recovery of any additional visually-significant data. From
a distortion point of view, it appears that encrypting higher levels (smaller blocks) increases
the PSNR, and at the same time, the encrypting cost. From a security point of view, as the
level increases, so the search space for a brute force attack increases drastically.
Moreover, we propose a method based on using the quadtree decomposition as a way to
protect the content of the image. The main idea is to transmit the data without quadtree
decomposition, using the quadtree as the key to decrypt the image (Motsch et al., 2006). This
system has the following properties: embedded in the original bit-stream at no cost,
allowing multilevel access authorization combined with state-of-the-art still picture codec.
Multilevel quadtree decomposition provides a way to select the quality of the picture
decoded.
Fig. 9. LAR hierarchical selective encryption principle
Fig. 10: RC4 encryption of partition from highest level to full resolution of the lena image
For the steganography point of view, we have adapted a fast and efficient reversible data
embedding algorithm for the LAR-Interleaved S+P compression framework, namely the
Difference Expansion, as the two techniques are based on the S-transform. Both this codec
and the data embedding algorithm explore the redundancy in the digital picture to achieve
either better than state-of-the-art compression rates or reversible data embedding
respectively. The resultant capacity-distortion rates for embedded images were among the
best in the literature on lossless data embedding (Motsch et al., 2009),(Fig. 11).
a) Original image b) Data embedded image
Fig. 11. Data embedding of 100,000 bits in the lena image
Locally Adaptive Resolution (LAR) codec 45
Limited bandwidth and distortions are the main features of a wireless channel. Therefore,
both compression and secured transmission of sensitive data are simultaneously required.
The pyramidal version of the LAR method and an Unequal Error Protection strategy are
applied respectively to compress and protect the original image. The UEP strategy takes
account of the sensitivity of the substreams requiring protection then optimizes the
redundancy rate. In our application, we used the Reed Solomon Error Correcting Code RS-
ECC, combined with symbol block interleaving for simulated transmission over the COST27
TU channel (W. Hamidouche et al., 2009). When comparing this to the JPWL system, we
show that the proposed layout is better than the JPWL system, especially when transmission
conditions are poor (SNR<21 dB).
With regard to the other topic, compensating IP packet loss also requires an UEP process.
This is done by using an exact and discrete Radon transform, the Mojette transform (Babel et
al., 2008). The frame-like definition of this transform allows redundancies that can be further
used for image description and image communication (Fig. 8), for QoS purposes.
Fig. 8. General joint LAR-Mojette coding scheme
5.2 Content securization: cryptography and steganography
Besides watermarking, steganography, and techniques for assessing data integrity and
authenticity, providing confidentiality and privacy for visual data is one of the most
important topics in the area of multimedia security. Our research focuses on fast encryption
procedures specifically tailored to the target environment. For that purpose, we use the
pyramidal profile with Interleaved S+P configuration.
As the representation relies entirely on knowledge of the quadtree partition, this partition
needs to be transmitted without any error. Previous work on error resilience dealt with that
aspect and has shown that the decoder was still able to decode erroneous bit-streams. In that
case, visual quality was very poor as depicted on Fig. 10, even when only a few bits of the
quadtree were wrongly transmitted. Consequently, we propose to encrypt different levels of
the quadtree partition description, as depicted on Fig. 9 (Fonteneau et al., 2008). This
scheme is equivalent to a selective encryption process. Indeed, the encryption of a given
level of the partition prevents the recovery of any additional visually-significant data. From
a distortion point of view, it appears that encrypting higher levels (smaller blocks) increases
the PSNR, and at the same time, the encrypting cost. From a security point of view, as the
level increases, so the search space for a brute force attack increases drastically.
Moreover, we propose a method based on using the quadtree decomposition as a way to
protect the content of the image. The main idea is to transmit the data without quadtree
decomposition, using the quadtree as the key to decrypt the image (Motsch et al., 2006). This
system has the following properties: embedded in the original bit-stream at no cost,
allowing multilevel access authorization combined with state-of-the-art still picture codec.
Multilevel quadtree decomposition provides a way to select the quality of the picture
decoded.
Fig. 9. LAR hierarchical selective encryption principle
Fig. 10: RC4 encryption of partition from highest level to full resolution of the lena image
For the steganography point of view, we have adapted a fast and efficient reversible data
embedding algorithm for the LAR-Interleaved S+P compression framework, namely the
Difference Expansion, as the two techniques are based on the S-transform. Both this codec
and the data embedding algorithm explore the redundancy in the digital picture to achieve
either better than state-of-the-art compression rates or reversible data embedding
respectively. The resultant capacity-distortion rates for embedded images were among the
best in the literature on lossless data embedding (Motsch et al., 2009),(Fig. 11).
a) Original image b) Data embedded image
Fig. 11. Data embedding of 100,000 bits in the lena image
Recent Advances in Signal Processing46
5.3 Client-server application and hierarchical access policy
In France, the C2RMF laboratory connected to the Louvre museum has digitized more than
300,000 documents taken from French museums, in high resolution (up to 20000 × 30000
pixels). The resulting EROS database is, for the moment, only accessible to researchers
whose work is connected with the C2RMF. The TSAR project (Secure Transmission of high-
Resolution Art images) is supported by the French National Research Agency. The idea is to
integrate another scalable coding solution able to achieve a high lossy and lossless
compression ratio. A second area of research concerns the secure access of images. The
objective is to design an art image database accessible through a client-server process that
includes and combines a hierarchical description of images and a hierarchical secured
access.
Fig. 12. Exchange protocol for client-server application
We are currently working on a corresponding client-server application (Babel et al., 2007).
Every client will be authorized to browse the low-resolution image database and the server
application will verify the user access level for each image and ROI request. If a client
application sends a request that does not match the user access level, the server application
will reduce the image resolution according to access policy. The exchange protocol is
depicted in Fig. 12.
6. Conclusion
In this chapter, we focused on a few representative features of the LAR coding technology
and its preliminary associated performances. This algorithm fulfills different functionalities
and services, such as scalability, region-level handling, steganography, cryptography,
robustness and adjustable complexity. These functionalities have yet to be evaluated with
ad-hoc tools that have to be defined in the JPEG-AIC context. Furthermore, some of the
results presented have revealed better than state-of-the-art performances.
As the LAR coder provides good results in terms of both compression, representation and
functionnalities, an extension of the LAR codec aimed at video compression with associated
services is being worked on.
7. References
Babel, M.; Déforges, O. & Ronsin, J. (2003). Adaptive Multiresolution Scheme for Efficient
Image Compression, Proceedings of Picture Coding Symposium, April, 2003, pp. 23-25.
Babel, M.; Déforges, O. & Ronsin, J. (2005). Interleaved S+P pyramidal decomposition with
refined prediction model, Proceedings of Image Processing, ICIP 2005, IEEE
International Conference on, pp. II-750-3, 0-7803-9134-9, Genova Swiss, September
2005, Genova.
Babel, M.; Déforges, O.; Bédat, L. & Motsch, J. (2007). Context-Based Scalable Coding and
Representation of High Resolution Art Pictures for Remote Data Access, Multimedia
and Expo, 2007 IEEE International Conference on, 2007, pp. 460-463.
Babel, M.; Parrein, B.; Déforges, O.; Normand, N.; Guédon, J. & Coat V. (2008). Joint source-
channel coding: Secured and progressive transmission of compressed medical
images on the Internet, In: Computerized Medical Imaging and Graphics, vol. 32, June.
2008, pp. 258-269.
Déforges, O.; Babel, M. & Motsch, J. (2006). The RWHT+P for an improved lossless
multiresolution coding, proceedings of EUSIPCO 2006, August 2006, p. nc ,
Florence Italy
Déforges, O.; Babel, M.; Bédat, L. & Ronsin, J. (2007). Color LAR Codec: A Color Image
Representation and Compression Scheme Based on Local Resolution Adjustment
and Self-Extracting Region Representation, Circuits and Systems for Video Technology
, IEEE Transactions on, Vol. 17, Issue. 8, August 2007, 974-987, 1051-8215
Déforges, O.; Babel, M.; Bédat, L. & Coat, V. (2008). Scalable lossless and lossy image coding
based on the RWHaT+P pyramid and the inter-coefficient classification method,
Proceedings of Multimedia and Expo, 2008 IEEE International Conference on, pp. 185-
188, 978-1-4244-2570-9, Hanover Germany, June 2008,Hanover.
Déforges O. & Babel M. (2008). LAR method: from algorithm to synthesis for an embedded
low complexity image coder, 3rd International Design and Test Workshop 3rd
International Design and Test Workshop, IDT'08 , Monastir Tunisia : 2008, pp. 1-4 .
De Simone, F.; Ticca, D.; Dufaux, F.; Ansorge, M.; Ebrahimi, T. (2008). A comparative study
of color image compression standards using perceptually driven quality metrics,
Proceedings of SPIE 2008, vol. 7073, San Diego, CA USA, August 11-14, 2008.