Báo cáo hóa học: "Research Article Intersubject Differences in False Nonmatch Rates for a Fingerprint-Based Authentication System" potx
Bạn đang xem bản rút gọn của tài liệu. Xem và tải ngay bản đầy đủ của tài liệu tại đây (2.99 MB, 9 trang )
Hindawi Publishing Corporation
EURASIP Journal on Advances in Signal Processing
Volume 2009, Article ID 896383, 9 pages
doi:10.1155/2009/896383
Research Article
Intersubject Differences in False Nonmatch Rates for
a Fingerprint-Based Authentication System
Jeroen Breebaart, Ton Akkermans, and Emile Kelkboom
Philips Research, HTC 34 MS61, 5656 AE Eindhoven, The Netherlands
Correspondence should be addressed to Jeroen Breebaart,
Received 4 September 2008; Accepted 7 July 2009
Recommended by Jonathon Phillips
The intersubject dependencies of false nonmatch r ates were investigated for a minutiae-based biometric authentication process
using single enrollment and verification measurements. A large number of genuine comparison scores were subjected to statistical
inference tests that indicated that the number of false nonmatches depends on the subject and finger under test. This result was also
observed if subjects associated with failures to enroll were excluded from the test set. The majority of the population (about 90%)
showed a false nonmatch rate that was considerably smaller than the average false nonmatch rate of the complete population.
The remaining 10% could be characterized as “goats” due to their relatively high probability for a false nonmatch. The image
quality reported by the template extraction module only weakly correlated with the genuine comparison scores. When multiple
verification attempts were investigated, only a limited benefit was obser ved for “goats,” since the conditional probability for a false
nonmatch given earlier nonsuccessful attempts increased with the number of attempts. These observations suggest that (1) there
is a need for improved identification of “goats” during enrollment (e.g., using dedicated signal-driven analysis and classification
methods and/or the use of multiple enrollment i mages) and (2) there should be alternative means for identity verification in the
biometric system under test in case of two subsequent false nonmatches.
Copyright © 2009 Jeroen Breebaart et al. This is an open access article distributed under the Creative Commons Attribution
License, which permits unrestricted use, distribution, and reproduction in any medium, provided the original work is properly
cited.
1. Introduction
The use of biometric characteristics for identity verification
has been described as security enhancement on top of
something one has (e.g., a card) and/or something one
knows (e.g., a password) in many publications. The main
reason for biometrics-enhanced identity management in
such two or three-factor authentication approach is to reduce
the risk of identity theft by increasing the difficulty of
impersonation. In less critical applications, biometrics have
also been proposed as replacement for passwords. With
the ever-increasing number of login codes, passwords, and
personal identification numbers (PINs), there is a strong
need to reduce the amount of information that individuals
have to memorize. Biometrics could provide a convenient
solution for this increasing memory burden.
The use of biometrics in forensic context exists for a very
long time. Around 1880, Dr. Henry Faulds recognized the
importance of fingerprints for identification. In the 1890s,
Alphonse Bertillon, a French anthropologist and police desk
clerk used multiple body measurements to identify convicted
criminals. Later Richard Edward Henry of Scotland Yard
started to use fingerprints for the same purpose. These
early methods all employed manual measurement and
comparison for identification. Only during the last few
decades, automated biometric identity verification systems
have been introduced and have been subject to extensive
research. One of the leitmotifs in biometrics research is the
verificationperformance,expressedinaverageperformance
characteristics such as false acceptance rates (FARs), false
rejection rates (FRR), and equal error rates (EERs). In most
applications, the FAR and FRR are subject to a tradeoff;by
modifying a comparison threshold value, security (expressed
by the FAR) can be enhanced at the expense of a decreased
convenience (expressed by the FRR) and vice versa, result-
ing in a detection error tradeoff (DET) curve. Similarly,
performance tests on a subpopulation (excluding failures to
acquire or to enroll) are expressed in terms of false match
rates (FMRs) and false nonmatch rates (FNMR). In many
cases, a biometric verification performance is characterized
2 EURASIP Journal on Advances in Signal Processing
by an FRR (or FNMR) at a specific FAR (or FMR) which is
typically 0.01 or 0.001. These perform ance measures heavily
depend on the biometric modality, the sensor type, the type
of processing, and the corpus that is being used. As examples,
various systems for face and iris recognition report an FRR
in the ra nge of 0.005–0.05 at an FAR of 0.001 [1–3]; however,
significantly worse performance is also reported [4, 5]. For
fingerprints, best-in-class solutions typically provide an FRR
of approximately 0.04 at an FAR of 0.001 and about 0.03 for
anFARof0.01[6, 7].
Although the DET curve provides very meaningful
information on the average performance of a biometric
verification system given a certain population or corpus,
it does not describe possible intersubject dependencies in
verification performance. Subjects of a biometric system
have been categorized into “sheep,” “goats,” “lambs” and
“wolves,” depending on their average (intrasubject) genuine
and imposter scores [8]. This menagerie has been extended
with “worms,” “chameleons,” “phantoms,” and “doves” [9].
There is evidence that a number of these types indeed
exist for certain biometric modalities and corpora [8–11]
although the presence of “goats” in fingerprint corpora seems
subject to debate [12].
The“goats”representsubjectsthataredifficult to
recognize. They account for a disproportionate share of
false nonmatches. These false nonmatches may cause these
subjects to experience the system as being “inconvenient”
possibly resulting in a decreased trust in a certain application
which may also have negative consequences for their trust
in biometrics in general. As an example, it has been shown
that the age band has an effect on the performance of a
fingerprint-based biometric system [3, 13] which suggests
that elderly people may more often be associated with “goats”
than younger people.
Failures to enroll or acquire may also pose challenges
on biometric verification systems with regard to conve-
nience. Subjects may have unreliable or absent biometric
characteristics or b ody parts. It has often been assumed that
between one and three percent of the general public does not
have suitable biometric characteristics (cf. [2, 4]). A further
challenge is caused by subjects that refuse to enroll. Subjects
have in particular circumstances the right to object against
the processing of biometric data on compelling legitimate
grounds such as privacy concerns [14]. Other concerns may
comprise health effects induced by biometric measurements,
hygiene issues, the risk of stolen body parts containing a
biometric, or negative associations such as fingerprints and
crime. Surveys held in the US between 2001 and 2005
indicated that about 6–10% of the Americans found the use
of finger and hand scan biometrics for law enforcement and
governmental applications not acceptable [15, 16]. In the
commercial sector, a similar proportion of the population
found it not acceptable to use biometrics for credit card
transactions or Automated Teller Machines (ATMs). In
Europe, a majorit y of consumers (92%) now believe that a
fingerprint is more secure than a sig nature, and 84% believes
that biometrics are more secure than Chip and PIN [17].
Summarizing, failure of correct authentication in a
biometric system may be associated with subjects that do
not want to enroll, that cannot enroll, or that experience
problems during verification. It is rather obvious that sub-
jects belonging to the first two groups require an alternative
means for authentication that is not based on biometrics. For
the third group, the “goats,” the situation is somewhat more
subtle. This type is not easily detectable during enrollment
if only a single measurement is available. Depending on the
application, the difficulty to detect “goats” in an initial stage
may jeopardize the success of a biometric verification system.
For example, consider the case of biometrics-enabled ATMs.
With billions of ATM transactions per month, a typical false
nonmatch rate of 0.01 will result in a tremendous number
of complaints, help desk calls, and service costs. Hence an
FNMR of 0.01 will most likely not be acceptable for such
an application and it will be crucial to understand and
to mitigate the risk of false nonmatches. In conventional
ATMs based on PIN authentication, a subject has multiple
(typically 3) authentication attempts to resolve problems
related with erroneously entered PINs. It is of interest to
investigate the effect of such multiple verification attempts in
a biometric authentication scheme and its influence on the
resulting FNMR and FMR.
2. FNMR Analysis
Subject dependencies of FNMR have been found for speaker
recognition [8], face recognition [11], and fingerprint recog-
nition [9, 10, 12]. However, it has been argued that “hard-
to-match” fingerprints are resulting from properties of a
certain (low-quality) measurement, rather than resulting
from individual biometric characteristics themselves [12].
Furthermore, although the existence of subject interdepen-
dencies has been shown by statistical inference tests, most
studies do not provide a clear insight in the distribution of
intersubject FNMRs.
2.1. Fingerprint Corpus. An analysis of intersubject FNMRs
was carried out based on the Ministerio de Ciencia y
Te cnolog
´
ıa (MCYT) baseline fingerprint corpus [18]. This
database contains 12 images of all 10 fingers from 330
subjects that were located in four different institutions. All
combinations of image number, finger, and subject have been
measured using two acquisition devices: one optical sensor
(UareU from Digital Persona) and one capacitive sensor
(model 100SC from Precise Biometrics). Both sensors were
operating at a resolution of 500 dpi. All fingerprint capturing
was accomplished by the supervision of an operator using
three levels of control by the subject that differed in the
amount of visual feedback with respect to finger placement
provided on a computer screen. In a subjective quality assess-
ment on a subset of the data, 5% of the images was found to
be of very bad quality, 20% of low quality, 55% of medium
quality, and 20% of high quality (see [18] for details).
The total amount of fingerprint images amounts thus
330
× 10 × 12 × 2 = 79, 200 images. Since 12 measurements
are available for each subject, finger, and sensor, the
maximum number of unique genuine comparisons per
subject, finger, and sensor equals 66 (under the assumption
EURASIP Journal on Advances in Signal Processing 3
that for all images a suitable minutiae template could be
established). Hence for each finger and sensor, 66
× 330 =
21 780 genuine comparisons can in principle be obtained,
resulting in a total number of genuine comparisons per
sensor of 217 800, and 435 600 in total.
All 79 200 images were converted to minutiae templates
using a state-of-the-art commercially available minutiae-
extractor and comparator solution. The minutiae-extractor
also provides image quality r a tings; the corresponding
comparator solution operates symmetrically, that is, a com-
parison score of A with B is equal to B with A. Some of
the images could not be converted to minutiae templates
either due to a failure to acquire or a failure to enroll. Since
the employed solution does not indicate whether a failure
was due to acquisition or enrollment difficulties, we will
refertosuchfailuresasfailurestoenrollintheremainder
of this paper. For the capacitive sensor, the system could
not enroll one image for one finger of one subject. For four
other subjects, none of the images from any finger could be
enrolled. Hence out of the 39.600 images, 1 + 4
× 12 × 10 =
481 images resulted in a failure to enroll, corresponding to
a failure to enroll rate in terms o f the number of images
of 0.0121. For the optical sensor, 4 subjects could not be
enrolled for one finger and one image. One subject could
not enroll one image from two fingers. One subject could
not enroll any image from any finger. Hence, in total, 4 +
2 + 120
= 126 images resulted in a failure to enroll, w hich
corresponds to a rate of 0.0032.
From these data, two databases containing comparison
scores were constructed described as follows.
(1) A full database, containing all genuine comparison
scores within the same sensor, resulting in 435 600
genuine comparison scores in total (217 800 for each
sensor). Comparisons that involved an image that
caused a failure to enroll were set to a similarity score
of zero to ensure a reject irrespective of the (positive)
comparison threshold. The imposter comparisons
comprised a subset of 792 000 combinations. Tests
on this database describe the FAR-FRR tradeoff (i.e.,
including the effect of failure to enroll).
(2) A balanced database containing only subjects for
which all images could be enrolled. Hence the result-
ing database is fully balanced (i.e., the same number
of fingers and measur ements per finger for each
subject). This process resulted in 214 500 genuine
comparisons for the capacitive sensor (325 subjects),
and 213 840 genuine comparisons for the optical
sensor (324 subjects). The number of imposter
comparisons amounted to 384 000 and 381 720,
for the capacitive and optical sensors, respectively.
Performance tests on this database are more closely
related to FMRs and FNMRs, while minimizing the
effect of low-quality data that could result in failure
to enroll.
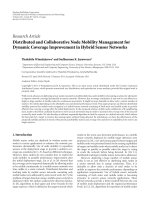
2.2. DET Curves. Separate DET curves were constructed
for the optical and capacitive sensors from the genuine
and imposter comparison scores. The results are visualized
Table 1: Error rates for the two sensors and the two databases (the
full database providing FRRs and the balanced database providing
FNMRs).
Sensor EER (full) EER (bal) (full)
(bal)
Capacitive 0.0240 0.0138 0.0295
0.0181
Optical 0.0064 0.0034 0.0075
0.0040
in Figure 1 for the full database. The solid line represents
the capacitive sensor, the dashed line represents the optical
sensor. The EER for the capacitive sensor amounts to 0.024;
the EER for the optical sensor amounts to 0.0064. At a FAR of
0.001, the FRR for the capacitive and optical sensors amounts
to 0.0295 and 0.0075, respectively. As can be observed,
the optical sensor performs significantly better than the
capacitive sensor: across the full DET curve, the FRR for the
optical sensor is almost 4 times smaller than the FRR of the
capacitive sensor for the same FAR. These results confirm
earlier statement on quality differences between optical and
capacitive sensors [19]. A similar analysis was performed for
the balanced database. A comparison between the full and
balanced database error rates is provided in Table 1 .Ascan
be observed, the EERs and FNMRs for the balanced database
are about twice as low as for the full database (FRRs).
2.3. Statistical Inferences. The existence of “goat-” like behav-
ior is investigated using statistical inference tests. The data is
tested to support the null-hypothesis that the genuine com-
parison scores do not depend on the subject or finger indices.
A nonparametric (Kruskal-Wallis) test was employed on the
genuine comparison scores from the balanced database. The
Kruskal-Wallis test can only be employed to investigate one
factor; hence, the test was performed four times to cover all
combinations of the two sensors and the two effects under
test (subject index and finger index). The results are provided
in Table 2 . All null hypotheses that the subject or finger index
did not have any effect on the comparison scores are rejected
based on the observed χ
2
values. Hence, it is concluded that
the false nonmatch rates are subject to “goat-” like behavior.
The comparison scores were also subjected to a two-
way analysis of variance (including interaction) with the
finger index and subject as main effects, and the comparison
score as dependent variable. The resulting F values and
the corresponding probability of falsely rejecting the null
hypothesis, that is, none of the effects or interactions is
significant, are provided in the last two columns of Tabl e 2.
In line with the results obtained from the Kruskal-Wallis
test, both factors and their interaction were found to have
a significant effect on the comparison scores. The same
analyses were also carried out on the full database which gave
the same qualitative result.
2.4. Intersubject Distribut ion of FNMR. Thepresenceof
significant effects of subject and finger index on the com-
parison scores for both sensors does not provide any insight
in the actual distribution of FNMRs across subjec ts or
fingers. To investigate the range of FNMRs between subjects,
4 EURASIP Journal on Advances in Signal Processing
Table 2: Results for the Kruskal-Wallis test and analysis of variance (ANOVA) test for the optical and capacitive sensors. The factors that
were taken into account were the subject index and the finger index. Tests were performed on the balanced database.
Sensor Effect df χ
2
p>χ
2
Fp>F
Capacitive Subject 324 68276.05 0 510.08 0
Capacitive Finger 9 5813.31 0 1621.18 0
Capacitive Interaction 2916 n/a n/a 44.62 0
Optical Subject 323 66894.26 0 552.18 0
Optical Finger 9 17047.04 0 5116.24 0
Optical Interaction 2907 n/a n/a 42.15 0
the number of false nonmatches within the set of all 66
genuine comparisons was computed for a threshold value
that resulted in a global FMR of 0.001. The threshold
was determined separately for each of the two sensors to
compensate for performance differences between the sensors
and was carried out on the balanced database.
In the following, the number of false nonmatches at a
false match rate φ
i
within a set of N genuine comparisons
is given by x
i, j,k
[φ
i
] for sensor i,subjectj,fingerk.Ifone
assumes that each of the N genuine comparisons for a given
sensor i has a constant probability for a false nonmatch that
only depends on the false match rate φ
i
, the expected number
μ
i
[φ
i
] of false nonmatches within a set of N = 66 genuine
comparisons would be given by
μ
i
φ
i
=
Nψ
i
φ
i
,(1)
with ψ
i
[φ
i
] the estimate of the probability of a false
nonmatch ψ
i
[φ
i
] for a false match rate φ
i
,givenby
ψ
i
φ
i
=
j
k
x
i, j,k
φ
i
JKN
. (2)
In the absence of any intersubject or finger index
dependencies, the variable x
i, j,k
[φ
i
] is then expected to follow
a binomial distribution with mean Nψ
i
[φ
i
]andvariance
Nψ
i
[φ
i
](1 − ψ
i
[φ
i
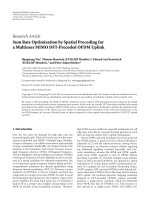
]). This expected distribution is visualized
in Figure 2 by the solid lines. Figure 2(a) represents the
capacitive sensor; the lower panel represents the optical
sensor. In both the upper and lower panels, the horizontal
axes indicate the number of nonmatches (in 66 attempts),
the vertical axes represent the population proportion. The
numbers inbetween the upper and lower panels represent the
FNMR corresponding to the number of false nonmatches
in 66 attempts. The capacitive sensor (Figure 2(a))hasa
maximum at one nonmatch out of 66 which corresponds
to the FNMR of 0.0181 at an FMR of 0.001 that was also
provided in Table 1. The optical sensor (Fihure 2(b)) has a
maximum at zero nonmatches which is caused by the smaller
overall FNMR of 0.0040. The far-most right point on the
curves represents 9 or more nonmatches out of 66. For the
capacitive sensor, the probability of finding 9 or more false
nonmatches out of 66 according to the binomial distribution
equals 3.01e
− 6; for the optical sensor this value equals to
7.7e
− 12 (not shown in the figure).
The observed FNMRs per subject based on an individual
comparison threshold for each sensor to result in an overall
10
−1
10
−2
10
−3
10
0
10
−1
10
−2
10
−3
FRR
10
−4
10
−5
10
−6
Capacitive
FAR
Optical
Figure 1: DET curves for the capacitive (solid line) and optical
(dashed line) sensors based on the full database (including failures
to enroll).
FMR of 0.001 are given by the dashed lines in Figure 2.
These curves represent the genuine comparisons for all
subjects and fingers, that is, different fingers of one subject
can be interpreted as additional subjects. All number of
observations are normalized to sum to +1 to allow direct
comparison with the binomial distribution given by the
solid line. Interestingly, the curve for the observed number
of false nonmatches is quite different from the binomial
distributions, for both the capacitive and optical sensors.
Two trends can be observed: (1) the number of subjects
with zero false nonmatches is larger than expected based
on a binomial distribution, and (2) the number of subjects
with 9 or more false nonmatches is also significantly larger
than expected. The proportion of subjects that obtained 9 or
more false nonmatches (which corresponds to an FNMR of
0.136 or more) equals 0.0505 and 0.0145, for the capacitive
and optical sensors, respectively. The proportion of subjects
with 23 or more nonmatches (an FNMR of 0.33 or larger)
amounted 0.0120 and 0.0006, for the capacitive and optical
sensors. Hence, the observed frequencies of finding 23 or
more nonmatches in a trial of 66 is 3 to 7 orders of magnitude
larger than is expected based on a binomial distribution.
EURASIP Journal on Advances in Signal Processing 5
10
0
10
−2
10
−4
10
−6
0123
4
567
8
9+
FNMR: 0 0.02 0.03 0.05 0.06 0.08 0.09 0.11 0.12 0.14
Population proportion
Capacitive sensor
Number of false non-matches
(a)
10
0
10
−2
10
−4
10
−6
0123
4
567
8
9+
Population proportion
Number of false non-matches
Expected
Observed
Optical sensor
(b)
Figure 2: Distribution of the expected (solid lines) and observed
(dashed lines) number of false nonmatches across subjects and
fingers for the capacitive sensor (a) and the optical sensor (b).
The numbers in between panels represent the corresponding false
nonmatch rates.
0123
456789+
FNMR: 0 0.02 0.03 0.05 0.06 0.08 0.09 0.11 0.12 0.14
Population proportion
Number of false non-matches
10
0
10
−2
10
−4
10
−6
Optical
Expected
Observed
Figure 3: Distribution of expected (solid lines) and observed
(dotted and dashed lines) number of false nonmatches across
subjects for the capacitive sensor (dashed line) and the optical
sensor (dotted line) based on a threshold to result in a mean FNMR
of 0.02.
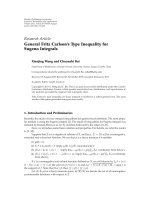
One possible reason for finding a relatively large pop-
ulation of subjects with a high FNMR is that these could
be resulting from “weak” fingers that more often causes
nonmatches. To investigate the distribution of interclass
FNMRs when excluding the effect of different FNMRs per
finger, a separate comparison threshold was estimated for
each finger index and sensor such that across all subjects, the
FNMR was equal to a fixed value of 0.02 when measured for
one finger and sensor across all subjects. The distribution of
false nonmatches in a set of 66 attempts is shown in Figure 3.
The expected values based on the binomial distribution with
mean probability of 0.02 are given by the solid line; the
observed distributions for the capacitive and optical sensors
are shown by the dashed and dotted lines, respectively.
Interestingly, using a separate threshold for each sensor and
finger to result in the same mean FNMR, the observed
distributions of FNMRs across subjects are very similar.
Furthermore, there is a significant discrepancy between
the expected (binomial) distribution and the observed
distribution. More than 5% of the population obtained 9 or
more false nonmatches, which is significantly larger than the
expected value of 5.8e
− 6. Another interesting observation
is that for both sensors, about 90% of the subjects has an
FNMR which is smaller than the population average of 0.02,
while only 10% has an FNMR which is (significantly) larger.
2.5. Multiple Verification Attempts. If multiple verification
attempts are allowed in a verification system, the expected
number of false matches will typically increase if the
comparison threshold is kept constant (e.g., assuming that
an imposter will use a different finger during each attempt
to maximize the false match probability). If the false match
probability of the nth trial out of N using sensor i is assumed
to be constant across subjects and fingers and given by
φ
i
[n, N], the probability that at least one of N attempts wil l
give a false match Φ
i
[N]isgivenby
Φ
i
[
N
]
= 1 −
N
n=1
1 − φ
i
[
n, N
]
.
(3)
If one also assumes that the probability φ
i
[n, N] is inde-
pendent of trial number n and φ
i
[n, N] 1, this can be
approximated quite accurately by
Φ
i
[
N
]
≈ Nφ
i
.
(4)
Said differently, the false match probability increases approx-
imately linearly with the number of attempts if the compari-
son threshold is kept constant.
The number of false nonmatches will typically decrease
with the increasing number of attempts. If the false
nonmatch probability for attempt n out of N given by
ψ
i
[Φ
i
[N], n, N], the probability that all N attempts will result
in, a false nonmatch is given by
Ψ
i
[
Φ
i
[
N
]
, N
]
=
N
n=1
ψ
i
[
Φ
i
[
N
]
, n, N
]
. (5)
If one assumes the probabilities ψ
i
[Φ
i
[N], n, N]tobe
independent on trial n, this would result in
Ψ
i
[
Φ
i
[
N
]
, N
]
= ψ
i
φ
i
N
.
(6)
Hence, an important consequence of the dependency of
both FMR and FNMR on the number of attempts is that the
comparison threshold should be dependent on the number
ofallowedattemptsifafixedFMRisdesired.
6 EURASIP Journal on Advances in Signal Processing
10
−1
10
0
10
−2
10
−3
FNMR
FMR
Capacitive
10
−4
10
−5
10
−6
10
−1
10
−2
10
−3
10
−4
(a)
FNMR
Optical
FMR
10
0
10
−1
10
−2
10
−3
10
−4
10
−1
10
−2
10
−3
10
−4
10
−5
10
−6
Single
Max2
Mean2
Expected
(b)
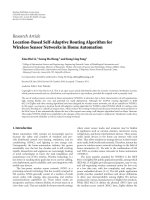
Figure 4: DET curve for the capacitive sensor (a) and the
optical sensor (b) based on the balanced database. The solid line
represents the FMR/FNMR tradeoff for a single attempt. The
dashed lines represent the performance based on the maximum
comparison score of 2 attempts (max2); the dash-dotted lines
represent the performance for the mean comparison score across
2 attempts (mean2). The dotted curve represents the expected
FMR/FNMR tradeoff assuming constant false nonmatch and false
match probabilities for each tri al.
To investigate the effect of multiple verification attempts,
a two and three trial case was simulated by taking the
maximum comparison similarity score across two or three
genuine comparisons, respectively. The same process was
employed for the imposter scores using fingerprints from
different subjects across the attempts. The resulting DET
curves are visualized in Figures 4 and 5 for the balanced
database. Figures 4(a) and 5(a) represent the capacitive
sensor, Figures 4(b) and 5(b) represent the optical sensor.
The solid, dashed, and dash-dotted lines represent a single
trial, the maximum comparison, and the mean comparison
scores across multiple attempts, respectively.
As can be observed f rom Figures 4 and 5, the possibility
of multiple verification attempts has a positive influence on
the verification performance. For the capacitive sensor, the
FNMR of 0.018 at an FMR of 0.001 for a single verification
attempt decreases to 0.011 and 0.010 for two attempts
according to a “mean” and “max” rule, respectively. For the
three-trial case, the respective FNMRs are equal to 0.0096
and 0.0075. The optical sensor shows a similar trend. The
FNMRs for a single trial at an FMR of 0.001 correspond to
0.0040. For two attempts, the FNMRs are equal to 0.0026
and 0.0024 (for the “mean” and “max” rules, resp.). For three
attempts, these rates are equal to 0.0020 and 0.0018.
10
0
FNMR
FMR
Capacitive
10
−7
10
−6
10
−5
10
−4
10
−3
10
−2
10
−1
10
0
10
−8
10
−1
10
−2
10
−3
10
−4
(a)
FNMR
Optical
FMR
10
−7
10
−6
10
−5
10
−4
10
−3
10
−2
10
−1
10
0
10
−8
10
0
10
−1
10
−2
10
−3
10
−4
Single
Max3
Mean3
Expected
(b)
Figure 5: DET curve for the capacitive sensor (a) and the
optical sensor (b) based on the balanced database. The solid line
represents the FMR/FNMR tradeoff for a single attempt. The
dashed lines represent the performance based on the maximum
comparison score of 3 attempts (max3); the dash-dotted lines
represent the performance for the mean comparison score across
3 attempts (mean3). The dotted curve represents the expected
FMR/FNMR tradeoff assuming constant false nonmatch and false
match probabilities for each tri al.
For both sensors, the “max” rule provides the lowest
FNMR at a given FMR. The ratios of FNMRs at a fixed
FMR of 0.001 for two attempts compared to one trial equal
to 0.55 and 0.60 (for the capacitive and optical sensors,
resp.). For three attempts, these ratios are equal to 0.42
and 0.45, respectively, when compared to the single-attempt
case. However, these improvements are significantly smaller
than the expected DET curve based on the independence
assumption of FNMR and FMR rates for each trial, which
is represented by the dotted curves in Figures 4 and 5. This
curve was created by transforming the single-attempt curve
to a multiple-attempt curve using (6)and(3).
2.6. Discussion. When attempting to enroll the 79,200
images, the failure to enroll rate amounted about 0.012 for
the capacitive and 0.003 for the optical sensors, respectively.
For the capacitive sensor, the value of 0.012 is quite in line
with the assumption that between 1 and 3 % of a population
has difficulties or failures to enroll. The value of 0.003 for the
optical sensor is relatively low in this respect.
The DET curves based on the full database shown in
Figure 1 indicate that the two sensors employed in the test
differ considerably in terms of verification performance.
EURASIP Journal on Advances in Signal Processing 7
0 0.2 0.4 0.6 0.8 1
0
0.2
0.4
0.6
0.8
1
r = 0.44104
Minimum image quality
Genuine comparison score
Capacitive sensor
(a)
0
0.2
0.4
0.6
0.8
1
Genuine comparison score
0 20 40 60 80 100
r = −0.12245
Number of minutiae
Capacitive sensor
(b)
0 0.2 0.4 0.6 0.8 1
Minimum image quality
0
0.2
0.4
0.6
0.8
1
Genuine comparison score
r = 0.41983
Optical sensor
(c)
0
0.2
0.4
0.6
0.8
1
Genuine comparison score
0 20 40 60 80 100
Number of minutiae
r = −0.016101
Optical sensor
(d)
Figure 6: Genuine comparison scores as a function of the lowest image quality of the two images under test (a, c) and the number of detected
minutiae (b, d). However, (a, b) represent the capacitive sensor; (c, d) represent the optical sensor.
Similar to the ratio of a factor of 4 in terms of failures to
enroll, the capacitive sensor has an FRR which is also about 4
times larger than the optical sensor for the same FAR.
When images that caused a failure to enroll are not taken
into account in the performance evaluation, the error rates
improve by almost a factor of two for both sensors (see
Table 1 ). This indicates that the number of failures to enroll,
and the number of false nonmatches is about the same for
the current database.
A further analysis on the balanced database revealed
statistically significant differences in false nonmatch rates
between subjects and fingers. When the thresholds for
the capacitive and optical sensors were set to individually
achieve an FMR of 0.001 between 1.45% (optical) and 5.05%
(capacitive)ofthesubjectsexperiencedanFNMRof0.136
or larger. Moreover, when differences between sensors and
fingers are accounted for by setting a separate threshold
for each finger index and sensor to obtain an average
FNMR across the population of 0.02, more than 5% of the
population achieved an FNMR of at least 0.136, which is
more than 6 times larger than the population mean, and 4
orders of magnitude larger than expected based on subject-
independent false nonmatch probabilities. Last but not least,
90% of the population has an FNMR which is smaller than
the population average. Said differently, it seems that for this
corpus and threshold setting, only 10% of the population is
responsible for the majority of the false nonmatches.
In an attempt to explain high false nonmatch rates
for certain individuals, the image quality reported by the
template extraction algorithm and the number of extracted
minutiae were investigated. These experiments were per-
formed on the balanced database. First, for each combination
of sensor, subject, and finger, the FNMR (derived from
all 66 comparisons) was correlated with the average image
quality and average number of extracted minutiae across
all 12 measurements. This correlation thus reflects the
8 EURASIP Journal on Advances in Signal Processing
relation between average properties across all observations
of a certain subject and finger, and the average FNMR. No
significant first-order relations were found. The resulting
Pearson correlations between FNMR and image quality, and
between FNMR and the number of minutiae were lower than
0.075 for both sensors.
In a second attempt, the individual comparison scores of
all genuine template pairs were correlated with the minimum
image quality of the two images under test. This test thus
aims at discovering a relation between the comparison score
and attributes of the individual images. A scatter plot of
comparison score versus image quality for the capacitive
sensor is shown in Figure 6(a); the scatter plot for the optical
sensor is provided in Figure 6(c). Both the comparison scores
and image quality data are normalized to an interval between
zero and +1. The Pearson correlation coefficients (r)are
provided in each panel. As can be observed, there is only
a weak correlation between image quality and comparison
score (r
= 0.44 and 0.42, for the capacitive and optical
sensors, resp.). Figures 6(b) and 6(d) demonstrate the
relation between the number of detected minutiae (as mean
value of the two templates under test) and the comparison
scores. Given the very low Pearson correlation coefficients
(r
= 0.12 and 0.02), no relation seems to exist between the
number of minutiae and genuine comparison score.
When multiple verification attempts are allowed, the
number of false nonmatches reduces by a factor of about 1.7
to 1.8 for two attempts and about 2.2 to 2.4 for three attempts
(provided that the FMR is kept constant). This increase in
performance is roughly in line with results by others (cf.
[4]) and is significantly smaller than what would be expected
based on independent probabilities for false nonmatches and
false matches for each attempt (cf. (3)–(6)). This observation
suggests that the false nonmatch probability for a second
or third attempt depends on the outcome of the earlier
attempts. If we denote the conditional probability for a false
nonmatch during the Nth attempt given false nonmatches
in all N
− 1previousattemptsbyψ[Φ[N], N, N], we find
the following relation between the overall false nonmatch
probability for N and N
− 1 attempts:
Ψ
[
Φ
[
N
]
, N
]
= ψ
[
Φ
[
N
]
, N, N
]
Ψ
[
Φ
[
N − 1
]
, N − 1, N − 1
]
.
(7)
If one assumes that the false match rates Φ[N]aresettoa
constant value Φ for every N, this results in
ψ
[
Φ, N, N
]
=
Ψ
[
Φ, N
]
Ψ
[
Φ, N − 1, N − 1
]
.
(8)
In other words, the conditional probability for a false
nonmatch at trial N given false nonmatches during all
earlier attempts can be derived from the ratio of the DET
curves for N and N
− 1 attempts. For the current database,
in which the relative improvement equals to a factor of
approximately 1.75, this means that the probability of a false
nonmatch during the second trial equals a pproximately 0.57.
Analogously, the conditional probability of a false nonmatch
during the third trial, given a false nonmatch during the first
and second trial, amounts to approximately 0.75.
It should be noted that these conditional probabilities
describe the average probability for a second or third
false nonmatch (i.e., provided that earlier attempts also
resulted in a false nonmatch). This result may erroneously
be interpreted as an FNMR that depends on the attempt
number for a given subject. Most likely, the FNMR rate for
a given subject is more or less constant across attempts. The
increase in the conditional probability on a system level is
presumably caused by an increase in the probability that
the current subject is associated with a high (but constant)
FNMR, and hence subsequent attempts will (most likely)
also have a high probability of a false nonmatch and hence
represents a “ goat.”
3. Conclusions
The MCYT fingerprint corpus under test, in combination
with a state-of-the-art commercially-available fingerprint-
matching algorithm, gives rise to subject-dependent false
nonmatch rates if single enrollment and verification mea-
surements are used. This result was observed for a capacitive
as well as an optical sensor. From the distribution of false
nonmatch rates across subjects, it seems that for a threshold
setting resulting in an average false nonmatch ra te of 0.02, a
vast majority of 90% of the population has a probability for
a false nonmatch that is smaller than the population average.
The average false nonmatch rate seems to be dominated
by a small group of subjects that are associated with a
disproportionately large number of false nonmatches. When
adjusting comparison thresholds as a func tion of sensor type
and finger to result in an average FNMR of 0.02 across the
population, at least 5% of all subjects experienced an FNMR
of 0.136.
In an attempt to predict which images were associated
with hig h false nonmatch rates, fingerprint image quality, the
number of detected minutiae, and the genuine comparison
scores were compared. Only a weak correlation (Pearson cor-
relation around 0.4) was observed between image quality and
comparison score, and no significant correlation was found
between the number of minutiae and comparison score. This
indicates that for the system and corpus under test, these
measures cannot reliably indicate images associated with
high false nonmatch rates.
The consistency in the false nonmatch probability for
certain subjects was expressed as conditional false nonmatch
rate. It was observed that for the system under test, the condi-
tional probability of a false nonmatch given 2 earlier attempts
amounts to approximately 0.75. Hence, for the system and
fingerprint database under test, the number of verification
attempts is best limited to two, and an alternative biometric
modality or authentication method should be provided in
case a subject experiences two subsequent false nonmatches.
Acknowledgment
The authors would like to thank the anonymous reviewers
and the associate e ditor for their very helpful comments and
suggestions to improve the manuscript.
EURASIP Journal on Advances in Signal Processing 9
References
[1] P. J. Phillips, W. T. Scruggs, A. J. O’Toole, et al., “FRVT 2006
and ICE 2006: large-scale results,” Tech. Rep. IR 7408, NIST
National Institute of Standards and Technology, Gaithersburg,
Md, USA, 2007.
[2] B. Toth and T. Mansfield, “Latest biometric test results—
performance, quality and interoperability,” Tech. Rep.,
Deloitte, 2006.
[3] D.Maio,D.Maltoni,R.Cappelli,J.L.Wayman,andA.K.Jain,
“IBG comparative biometric testing—round6,” Tech. Rep.,
International Biometric Group, Middlesex, UK, 2006.
[4] T. Mansfield, G. Kelly, D. Chandler, and J. Kane, “Bio-
metric product testing—final report,” Tech. Rep., Centre
for Mathematics and Scientific Computing, National Physics
Laboratory, Middlesex, UK, 2001.
[5] P. J. Phillips, P. J. Flynn, T. Scruggs, et al., “Overview of the
face recognition grand challenge,” in Proceedings of the IEEE
Computer Society Conference on Computer Vision and Pattern
Recognition (CVPR ’05), vol. 1, pp. 947–954, 2005.
[6] R. Cappelli, D. Maio, D. Maltoni, J. L. Wayman, and A. K. Jain,
“Performance evaluation of fingerprint verification systems,”
IEEE Transactions on Pattern Analysis and Machine Intelligence,
vol. 28, no. 1, pp. 3–17, 2006.
[7] Biometric System Laboratory University of Bologna,
“FVC2006: the fourth international fingerprint verification
competition,” 2006, />.asp.
[8] G. Doddington, W. Liggett, A. Martin, M. Przybocki, and
D. Reynolds, “Sheep, goats, lambs and wolves: a statistical
analysis of speaker performance in the NIST 1998 speaker
recognition evaluation,” in Proceedings of the 5th International
Conference on Spoken Language Processing (ICSLP ’98), Sydney,
Australia, 1998.
[9] N. Yager and T. Dunstone, “Worms, chameleons, phantoms
and doves: new additions to the biometrie menagerie,” in
Proceedings of the IEEE Workshop on Automatic Identification
Advanced Technologies (AUTO ID ’07), pp. 1–6, Alghero, Italy,
2007.
[10] R. M. Bolle, S. Pankanti, and N. K. Ratha, “Evaluation tech-
niques for biometrics-based authentication systems (FRR),”
in Proceedings of the International Conference on Pattern
Recognition (ICPR ’00), pp. 2831–2837, 2000.
[11] M. Wittman, P. Davis, and P. J. Flynn, “Empirical studies of
the existence of the biometric menagerie in the FRGC 2.0
color image corpus,” in Proceedings of the IEEE Conference on
Computer Vision and Pattern Recognition (CVPR ’06),p.33,
2006.
[12] A. Hicklin, C. Watson, and B. Ulery, “The myth of goats:
how many people have fingerprints that are hard to match?”
Tech. Rep. IR 7271, NIST National Institute of Standards and
Technology, Gaithersburg, Md, USA, 2005.
[13] S. K. Modi and S. J. Elliott, “Impact of image quality on
performance: comparison of young and elderly fingerprints,”
in Proceedings of the 6th International Conference on Recent
Advances in Soft Computing (RASC ’06), K. Sirlantzis, Ed., pp.
449–454, 2006.
[14] European Parliament and European Council, “Directive
1995/46/EC of the european parliament and of the council of
24 october 1995 on the protection of individuals with regard
to the processing of personal data and on the free movement
of such data,” 1995.
[15] ORC, “Public attitudes toward the uses of biometric identi-
fication technologies by government and the private sector.
Summary of survey findings, opinion research corporation
ORC,” 2001.
[16] TNS/TRUSTe, “Consumer attitudes about biometrics in ID
documents,” Tech. Rep., TNS/TRUSTe, August 2005.
[17] Logica CMG, “e-identity—european attitudes towards bio-
metrics,” Whitepaper, Logica CMG, 2006.
[18] J. Ortega-Garcia, J. Fierrez-Aguilar, D. Simon, et al., “MCYT
baseline corpus: a bimodal biometric database,” IEE Proceed-
ings: Vision, Image and Signal Processing, vol. 150, no. 6, pp.
395–401, 2003.
[19] F.Alonso-Fernandez,F.Roli,G.L.Marcialis,J.Fierrez,andJ.
Ortega-Garcia, “Comparison of fingerprint quality measures
using an optical and a capacitive sensor,” in Proceedings of IEEE
Conference on Biometrics: Theory, Applications and Systems
(BTAS ’07), pp. 1–6, Crystal City, Va, USA, September 2007.