Advances in Sonar Technology 2012 Part 1 pptx
Bạn đang xem bản rút gọn của tài liệu. Xem và tải ngay bản đầy đủ của tài liệu tại đây (1.38 MB, 20 trang )
Advances in
Sonar Technology
Advances in
Sonar Technology
Edited by
Sergio Rui Silva
I-Tech
IV
Published by In-Teh
In-Teh is Croatian branch of I-Tech Education and Publishing KG, Vienna, Austria.
Abstracting and non-profit use of the material is permitted with credit to the source. Statements and
opinions expressed in the chapters are these of the individual contributors and not necessarily those of
the editors or publisher. No responsibility is accepted for the accuracy of information contained in the
published articles. Publisher assumes no responsibility liability for any damage or injury to persons or
property arising out of the use of any materials, instructions, methods or ideas contained inside. After
this work has been published by the In-Teh, authors have the right to republish it, in whole or part, in
any publication of which they are an author or editor, and the make other personal use of the work.
© 2009 In-teh
www.in-teh.org
Additional copies can be obtained from:
First published February 2009
Printed in Croatia
p. cm.
ISBN 978-3-902613-48-6
1. Advances in Sonar Technology, Sergio Rui Silva
Preface
The demand to explore the largest and also one of the richest part of our planet, the
advances in signal processing promoted by an exponential growth in computation power
and a thorough study of sound propagation in the underwater realm, lead to remarkable
advances in sonar technology in the last years.
Since the use of imaging system that rely on electromagnetic waves (optical, laser
or radar) is restricted to only very shallow water environments, and given that the good
propagation of sound waves in water is known from at least the writings of Leonardo da
Vinci, the sonar (sound navigation and raging) systems are the most widespread solution
for underwater remote sensing.
Sonar systems can be divided into two major types: passive sonar systems that enable
detection of a sound emitting target and active sonar systems that use the properties of a
signal reflected on the targets for its detection and image formation.
As system complexity increases, the study of the way sound is used to obtain
reflectivity and bathymetry data from targets and submersed areas becomes fundamental in
the performance prediction and development of innovative sonar systems.
Because of the many similarities between sonar and radar, algorithms created for the
latter found application in sonar systems which made use of the advances in signal
processing to overcome the barriers of the problematic underwater propagation medium
and to challenge the resolution limits. In particular, synthetic aperture methods, applied
with so much success in radar imagery, were adapted to sonar systems. This in turn enabled
a considerable increase in sonar image quality and system robustness. Target detection
developments lead to the use of multiple transducer sensors and sophisticated beam
forming techniques with also excellent results.
High quality sonar imagery with reduced noise and enhanced resolution enables more
complex applications. Leaving the traditional real of military applications, sonar civil
applications arise for the study of biology ecology and related fields. Moreover integration
and data fusion of different sensors is becoming more and more common, being it
navigation data integration and enhancement for synthetic aperture, sonar systems with
different propagation characteristics or optical image integration for the improvement of
object detection.
But, not unlike natural evolution, a technology that matured in the underwater
environments is now being used to solve problems for robots that use the echoes from air-
acoustic signals to derive their sonar signals.
The work on hand is a sum of knowledge of several authors that contributed in various
different aspects of sonar technology. This book intends therefore to give a broad overview
of the advances in sonar technology of the last years that resulted from the research effort of
the authors in both sonar systems and its applications. It is destined to scientist and
VI
engineers from a variety of backgrounds and, hopefully, even those that never had contact
with sonar technology before will find an easy entrance in the topics and principles exposed
here.
The editor would like to thank all authors for their contribution and all those people
who directly or indirectly helped make this work possible, especially Vedran Kordic who
was responsible for the coordination of this project.
Editor
Sergio Rui Silva
University of Porto
Contents
Preface V
Side-looking Sonar
1. Simulation and 3D Reconstruction of Side-looking Sonar Images 001
E. Coiras and J. Groen
Synthetic Aperture Sonar
2. Synthetic Aperture Techniques for Sonar Systems 015
Sérgio Rui Silva, Sérgio Cunha, Aníbal Matos and Nuno Cruz
3. Motion Compensation in High Resolution
Synthetic Aperture Sonar (SAS) Images
043
R. Heremans, Y. Dupont and M. Acheroy
Sonar Image Enhancement
4. Ensemble Averaging and Resolution Enhancement of Digital Radar
and Sonar Signals
075
Leiv Øyehaug and Roar Skartlien
Sonar Detection and Analysis
5. Independent Component Analysis for Passive Sonar Signal Processing 091
Natanael Nunes de Moura, Eduardo Simas Filho and José Manoel de Seixas
6. From Statistical Detection to Decision Fusion: Detection
of Underwater Mines in High Resolution SAS Images
111
Frédéric Maussang, Jocelyn Chanussot, Michèle Rombaut and Maud Amate
Sonar Sensor Integration
7. Multi-Sonar Integration and the Advent of Senor Intelligence 151
Edward Thurman, James Riordan and Daniel Toal
VIII
8. On the Benefits of Using Both Dual Frequency Side Scan Sonar
and Optical Signatures for the Discrimination
of Coral Reef Benthic Communities
165
Tim J Malthus and Evanthia Karpouzli
Air-acoustics Sonar Systems
9. Outdoor Sonar Sensing 191
Fernando J. Álvarez Franco and Jesús Ureña Ureña
10. Mobile Robot Localization using Particle Filters and Sonar Sensors 213
Antoni Burguera, Yolanda González and Gabriel Oliver
Side-looking Sonar
1
Simulation and 3D Reconstruction of
Side-looking Sonar Images
E. Coiras and J. Groen
NATO Undersea Research Centre (NURC)
Italy
1. Introduction
Given the limited range and applicability of visual imaging systems in the underwater
environment, sonar has been the preferred solution for the observation of the seabed since
its inception in the 1950s (Blondel 2002). The images produced by the most commonly used
side-looking sonars (side-scan and, more recently, synthetic aperture sonars) contain
information on the backscatter strength recorded at every given range. This backscatter
strength mainly depends on the composition and the orientation of the observed surfaces
with respect to the sensor.
In this chapter, the relations between surface properties (bathymetry, reflectivity) and the
images resulting when the surface is observed by side-looking sonar (backscatter strength)
are studied. The characterization of this sonar imaging process can be used in two ways: by
applying the forward image formation model, sonar images can be synthesized from a given
3D mesh; conversely, by inverting the image formation model, a 3D mesh can be estimated
from a given side-looking sonar image. The chapter is thus divided in two main parts, each
discussing these forward and inverse processes. The typical imaging sensor considered here
is an active side-looking sonar with a frequency of hundreds of kilohertz, which usually
allows for sub-decimetre resolution in range and azimuth.
2. Sonar simulation
Simulation is an important tool in the research and development of signal processing, a key
part of a sonar system. A simulation model permits to study sonar performance and
robustness, giving the analyst the opportunity to investigate variations in the sonar results
as a function of one system parameter, whilst keeping other parameters fixed, hereby
enabling sensitivity studies. A sonar simulator can be used as well for image data base
generation, as an addition to costly measured data of which there is typically a shortage. A
data base with sufficient actuality and variability is crucial for testing and developing signal
processing algorithms for sonar image analysis, such as object detectors and classifiers. An
example is illustrated in Fig. 1, where a measured synthetic aperture sonar (SAS) image of a
cylinder sitting on the seafloor and a simulated image of a similar object at the same range
are shown.
Advances in Sonar Technology
2
Fig. 1. (a) NURC’s test cylinder. (b) Image of the cylinder measured with MUSCLE’s
synthetic aperture sonar (SAS). (c) 3D computer model of a cylinder and (d) its
corresponding sonar image simulated with the SIGMAS model.
2.1 Sonar fundamentals
The basic idea behind any sonar system is as follows: an acoustic signal (or ping) is emitted
by the sonar into an area to be observed; the sonar then listens for echoes of the ping that
have been produced when bouncing back from the objects that might be present in the area.
Typically, sonar images are produced by plotting the intensity measured back by the sonar
versus time, and since the speed of sound underwater is known (or can be measured), the
time axis effectively corresponds to range from the sonar.
In this way, just as light illuminates a scene so that it can be perceived by an optical sensor,
the acoustic ping “ensonifies” the scene so that it can be perceived by an acoustic sensor.
Also, as it happens in the optical field, imaging can be approached as a ray-tracing or a
wave propagation problem.
2.2 The acoustic wave equation
The propagation of acoustic waves is described by the acoustic version of the wave equation
(Drumheller 1998), a second order differential equation for acoustic pressure p, which is a
function of time (t) and space (x, y, z). Assuming constant water density and constant sound
speed (c) it can be written as:
()()
222 2
22222
1
,,
sss
ppp p
x
xy yz zst
xyzct
δ
∂∂∂ ∂
++− =−−−−
∂∂∂ ∂
(1)
The physical process starts with a normalized acoustic wave signal s(t) emitted by a source
located at (x
s
, y
s
, z
s
). In the equation the source is modelled as a point source, with a Dirac
delta (δ) spatial distribution function.
When the propagation of sound is described by Eq. 1, the expression for p(x; t) = p(x, y, z; t)
in the case of an infinite water mass around the source is given by:
()
;
4
r
st
c
pt
r
π
⎛⎞
−
⎜⎟
⎝⎠
=x
(2)
Where r is the range from the sonar’s acoustic source:
Simulation and 3D Reconstruction of Side-looking Sonar Images
3
()()()
222
sss
rxx yy zz=−+−+− (3)
From Eq. 2 it is clear that the acoustic pressure level is reduced according to the reciprocal of
the distance to the source. This loss in acoustic pressure and energy is referred to as
spherical spreading loss, and in the case of sonars it is to be applied twice: a signal travels
from source(s) to target(s) and then back from target(s) to receiver(s). The signal received
back at the sonar is a delayed and attenuated version of the initially transmitted signal.
It should be noticed that Eq. 2 is obtained with the assumption that the acoustic source is a
monopole and has no dimensions. If this is not the case, p becomes frequency dependent.
2.3 Practical approaches to sonar simulation
From the implementation point of view, several approaches to sonar simulation are possible
and frequently hybrid models are implemented. The most common are as follows:
Frequency domain models
In this approach the Fourier transform of the acoustic pressure that is measured back at the
sonar receiver is expressed in terms of the Fourier transform of the acoustic pulse used for
ensonifying the scene. This is the approach used in NURC’s SIGMAS simulator and is
discussed in detail in section 2.4. This implementation has the advantage of simplifying the
inclusion of several processes that are easier to represent in Fourier space, such as the
matched filtering of the received signal or the inclusion of the point spread function (PSF) of
the sonar transducers.
Finite difference models
The wave equation given in Eq. 1 can be solved numerically by applying finite difference
modelling, which imposes discretizations in time and space dimensions. Using, for instance,
a forward difference scheme permits to approximate the time derivative of the pressure as
follows:
(
)
(
)
,,; ,,;pxyzt t pxyzt
p
tt
+Δ −
∂
≈
∂Δ
(4)
where Δt is the temporal discretization step. For the spatial derivatives (with respect to the
x, y, z coordinates) a similar formula is used. Starting the computation with initial
conditions, i.e. the acoustic field at t = 0, permits to estimate the pressure field as any other
point of time and space. The problem with finite difference models when applied to the
side-looking sonar case is the dimensions of the computation. In order to obtain an accurate
acoustic pressure field the sampling in both space and time is required to be on the order of
a fraction of the reciprocal of the frequency and the wavelength, respectively. Even when
avoiding parts of the computation—for instance solving only the wave equation around the
location of the object of interest—the problem cannot be practically approached for
frequencies higher than several kilohertz.
Finite Element (FEM) and Boundary Element models (BEM)
The finite element models and boundary element models are alternatives to finite
differences that discretize the problem in a more optimized way. These approaches are
complex to implement but typically generate more stable and accurate results with lower
computational costs. However, even with these more sophisticated numerical techniques, no
reasonable computation times have been achieved for sonar image modelling for
frequencies much higher than ten kilohertz.
Advances in Sonar Technology
4
Ray tracing
Ray tracing (Bell 1997) is a method to calculate the path of acoustic waves through the
system of water, sea bottom, sea surface and objects of interest. When the sound speed
cannot be assumed constant in the water column refraction of the rays results in bent rays
focused to certain places. The paths of the rays are advanced until they hit an object, where
the particular contribution of the ray to the returned signal is then computed. Reflection,
refraction and scattering events can be accurately modelled by computing a large number of
rays, and these can account for complex phenomena observed in sonar imaging, such as
multi-path effects or the behaviour of buried targets. Generally speaking, ray tracing is
capable of rendering very accurate images but at a high computational cost.
Rasterization
Most current computer graphics are generated using rasterization techniques, which are
based on decomposing the scene in simple geometrical primitives (typically triangles) that
are rendered independently of each other. This permits fast generation of synthetic images,
although effects that require interaction between primitives (such as mirror-like objects) can
be complicated to simulate. A big advantage of raster methods is that most current
computers include specialized hardware (Graphical Procesing Units, or GPUs) that greatly
accelerate raster computations. NURC is currently working on a GPU-based implementation
of its SIGMAS sonar simulator, in order to achieve faster simulation performance.
2.4 The SIGMAS sonar simulator
Using the frequency domain approach followed by the SIMONA model (Groen 2006) the
SIGMAS simulator calculates the acoustic pressure for every pixel in the sonar image at the
same time. In this sense, the signal processing, i.e. the imaging algorithm, is included in the
model. In order to develop a realistic but sufficiently fast model some assumptions have
been made. The sound speed in the water column is assumed to be constant, which means that
acoustic paths follow a straight line. The surfaces of simulated objects are assumed discretized
into facets to which the Kirchhoff approximation to the scattered field is applied.
The general expression in frequency domain for the acoustic pressure at the receiver x
r
outside
of an object’s surface A can be derived using Green’s theorem (Clay 1977, Karasalo 2005):
(
)
(
)
(
)
(
)
(
)
(
)
rr r
x
;,;;;,;
A
Pf GfPfPfGf dA
∈
=⎡ ∇ − ∇ ⎤⋅
⎣⎦
∫∫
xxxxxxxnx (5)
In the expression, n is the surface normal and G is Green’s function, which for a
homogeneous medium is given by (Neubauer 1958):
()
r
r
r
,;
4
ik
e
Gf
π
−
=
−
xx
xx
xx
(6)
Where
2kfc
π
=
is the wave number.
On hitting a surface, part of the pressure wave will be scattered back (reflected) and some of
it will be refracted into the surface material or absorbed as heat. The fraction of pressure that
is returned is measured by the reflectivity (or reflection coefficient) R of the surface material.
The surface boundary conditions that relate the incident (P
i
) and scattered (P) waves are:
(
)
(
)
(
)
(
)
;1; ;
i
Pf RfPf=+xxx (7)
Simulation and 3D Reconstruction of Side-looking Sonar Images
5
(
)
()
;
1;
Pf
R
f
n
∂
=−
∂
x
x (8)
Where n indicates variation in the direction normal to the surface.
For our simulation purposes, an object with an acoustically rigid surface can be assumed,
which means the reflectivity R is set to unity and therefore elastic effects do not play a role.
This simplifies the boundary conditions on the scattering surfaces and is the approach used
by SIGMAS. Substituting R for 1 in the boundary conditions (7) and (8), and using Green’s
function (6) twice to propagate from source x
s
to surface A and then to receiver x
r
yields the
expression:
() () ()
rs
r
rs
x
rs r
;x;
ik ik
A
ie e
Pf Pf dA
λ
−−
∈
−
=− ⋅
−− −
∫∫
xx xx
xx
xnx
xxxx xx
(9)
Knowing that in sonar the source and the receiver are in the same position—which from
now on we assume to be at the coordinate origin—and assuming the surface is discretized
on small facets of area a
2
, the integral can finally be expressed as the following summation:
() ()
2
2
r
2
ˆˆ
k
f
i
kk
c
k
k
a
Pf Sfe
π
λ
⋅
=
∑
nr
r
(10)
Where r
k
is the vector from the sonar to the k
th
surface element, S(f) is the Fourier transform
of the transmit signal s(t), and where the hats indicate unit vectors.
Application of Eq. 10 produces results as those presented in Fig.2, where a barrel sitting on
flat sand and a truck wheel on a bumpy clay floor have been simulated.
Fig. 2. Two examples of the output produced by the SIGMAS simulator: a barrel sitting on a
sandy seafloor at 128 meters distance, and a truck wheel at 41 meters distance on a bumpy
clay seabed.
Advances in Sonar Technology
6
2.5 Model simplification
The approach to simulation used by SIGMAS produces very accurate results that correlate
well to experimental data. This accuracy comes with a computational cost, since the
coherent model used requires sampling the objects to be simulated at scales smaller than the
wavelength of the ensonificating signal. In the examples shown, for instance, the number of
discrete point scatterers is around one million per object.
For very smooth objects or if elasticity effects are relevant, coherence has to be considered.
On the other hand, if surfaces are rough at wavelength scale, the complex exponentials in
Eq. 10 can be dropped and the discretization can use bigger surface elements with an
equivalent reflectivity value R. The constructive and destructive interferences described by
the complex exponentials can also be replaced by a noise distribution (Bell 1997).
Furthermore, since most sonars perform some kind of Time-Varying Gain (TVG) intensity
corrections to compensate for the spherical spreading loss, that contribution can also be
dropped and replaced by a final image level scaling. Computations can be performed directly
in image space, removing also the need for the FFT when working in frequency domain,
resulting in the following expression for the observed pixel intensity at surface point r:
(
)
(
)
(
)
(
)
(
)
ˆˆ
kkk
k
IK R
χ
=⋅
∑
rrnrrr
(11)
Where the sonar is assumed at the coordinate origin, K is a normalization constant that groups
all scaling factors and unit conversions, R
k
is the reflectivity of the k
th
surface patch and χ
k
is
the characteristic function of the patch (one if the circle of radius |r| intersects the patch, zero
if not). Note that Eq. 11 basically corresponds to the Lambertian illumination model for diffuse
surfaces (Zhang 1999), where the perceived brightness of a surface point depends on the
relative direction of illumination and is independent of the direction of observation.
All these simplifications greatly reduce the complexity of the computations and even permit
to use standard computer graphics renderers, such as OpenGL (OpenGL ARB 2004), to
create the simulated images. Standard 3D models for objects to be simulated, like the VRML
barrel shown in Fig. 3, can also be used directly. The final result is much faster scene
Fig. 3. A three-dimensional VRML model of a barrel and the result of a simplified sonar
simulation using standard computer graphics rendering. The barrel is assumed to sit on a
rough seafloor at 130 meter distance.
Simulation and 3D Reconstruction of Side-looking Sonar Images
7
composition and rendering, at the cost of losing the significance of the resulting image
values, which are no longer in correspondence with the actual pressure levels.
3. 3D reconstruction of sonar images
This second part of the chapter is dedicated to the sonar inversion process, which allows to
infer a computer CAD model from a given sonar image, thus recovering the underlying 3D
surface geometry of the observed scene.
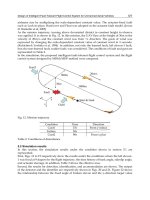
3.1 Side-looking sonar image formation model
The geometry of the image formation process for a side-scan sonar is briefly sketched in Fig.
4. The sensor’s acoustic source at o produces an ensonification pulse that illuminates the
seafloor. Some of the acoustic energy reaching any seabed point p is scattered back and can
be measured by the sensor. The intensity of the corresponding pixel on the side-scan image
will be proportional to the amount of energy scattered back from the surface point. The
illuminating pulse is not isotropic, but follows a particular beam-profile Φ that depends on
the grazing angle α subtended by the vector r from o to surface point p.
In the case of synthetic aperture sonar (SAS) the side-looking image is formed differently, by
emitting wider acoustic pulses and integrating the returned signals over time (Belletini
2002). For our inversion purposes, however, SAS images can still be regarded as having
been produced by a sophisticated side-scan sonar, and the following discussion applies to
both types of sensors.
Fig. 4. Side-looking sonar imaging geometry (adapted from (Coiras 2007)).
In order to model the scattering process we use the traditional Lambertian (Zhang 1999)
model already described in Eq. 11, which permits one to derive the returned intensity from
the parameters defining the observed scene. This simple model for diffuse scattering
assumes that the returned intensity depends only on the local angle of incidence θ of the
illuminating sound pulse, and not on the direction of observation or on the frequency of the
pulse. For the problem to be manageable the surface describing the observed scene has to be
univalued, which forces to replace the expression in Eq. 11 for the following simpler one:
Advances in Sonar Technology
8
() () () () () ()
()
cosIKR KR
θ
⋅
=Φ =Φ
nr
rrr rrr
nr
(12)
Where Φ represents the intensity of the illuminating sound wave at point p, R is the
reflectivity of the seafloor, θ is the incidence angle of the wave front and K is a normalization
constant. Since most logged side-looking images already include some kind of intensity
correction, all the intensity variations caused by the sensor’s beam-profile, the spherical
spreading loss and the TVG and other corrections are supposed to be grouped under the
beam-pattern Φ.
Following (Coiras 2007), with the coordinate system centered at the sensor in o, the x axis
being the across-track ground distance and y pointing along the sensor’s trajectory, we have:
(
)
(
)
() ()
,0, ,
,, ,,1
xZxy
ZZ
xy xy
xy
=
⎛⎞
∂∂
=− −
⎜⎟
∂∂
⎝⎠
r
n
(13)
Where the y coordinate in r is 0 because the side-scan sonar pulse Φ is shaped so that only
the points contained in the x-z plane are illuminated. Note that although this does not
directly apply to the sonar pulses used for SAS imaging, the resulting SAS images are to all
practical purposes equivalent to a side-scan image with constant resolution in the range
direction.
Combination of expressions (12) and (13) yields the forward model for the computation of
the intensity I at any point p, given the model parameters R, Z and Φ in ground range
coordinates x, y from the sensor:
(
)
(
)
(
)
() ()
()
() ()
2
2
22
,,,
,,
,, ,1
Ixy K xyRxy
Z
Zxy x xy
x
ZZ
x Z xy xy xy
xy
=Φ ⋅
∂
−⋅
∂
⎛⎞
∂∂
⎛⎞
+
⋅++
⎜⎟
⎜⎟
∂∂
⎝⎠
⎝⎠
(14)
Where the surface gradients can be approximated by finite differences (as shown for Eq. 4)
and where the normalization value K is:
()
2
22
2
22
2
2
22
11
,
1
Zx Z
ZxZ
yZ y
Kxy
Z
Zx
y
⎛⎞
⎛⎞ ⎛⎞
∂∂
⎜⎟
⋅+⋅+ + +
⎜⎟ ⎜⎟
⎜⎟
∂∂
⎝⎠ ⎝⎠
⎝⎠
=
⎛⎞
⎛⎞
∂
⎜⎟−−⋅+
⎜⎟
⎜⎟
∂
⎝⎠
⎝⎠
(15)
Where the explicit dependencies on (x, y) have been dropped for clarity.
3.2 Sonar inversion
Equation 14 provides a direct formula for estimating the returned intensity given the model
parameters. But the inverse problem—obtaining the model parameters from the observed
Simulation and 3D Reconstruction of Side-looking Sonar Images
9
intensities—is clearly under-determined, since we only have one observation (of I) at each
point to compute the values of the three model parameters.
In order to solve this problem and following (Coiras 2007) we take a least mean squares
(LMS) approach to minimize the sum E of the squared differences between the points of the
observed image, I, and those rendered by the model in Eq. 14, Î:
() ()()
(
)
2
,,
ˆ
,,,
xy xy
E Exy I xy I xy==−
∑∑
(16)
And the following optimization problem needs to be solved:
(
)
(
)
,, argmin
Z
REΦ= (17)
A solution can be found by using Expectation-Maximization (EM) (Dempster 1977), which
will iteratively converge to an optimal set of modeling parameters. Every iteration of the EM
method consists of two stages: in the Expectation stage, the current estimates for the model
(R, Φ, Z) are substituted in Eq. 14 to obtain an estimation for the intensity Î. In the
Maximization stage gradient descent is used to locally minimize E, by updating the model
parameters as follows:
() () ()
() ()
()
() ()
()
,, ,
,, ,
,, ,
E
R
xy Rxy xy
R
E
x
yxy xy
E
Z
xy Z xy xy
Z
λ
λ
λ
∂
←−⋅
∂
∂
Φ←Φ−⋅
∂Φ
∂
←−⋅
∂
(18)
Where λ is a small constant value used to control the rate of change. Direct operation using
Eq. 14, 16 and 18 yields:
() ()
()
()
()()
()
() ()
()
()
()()
()
()
()()
()
22
22
ˆ
,
ˆ
,,2 ,,
,
ˆ
,
ˆ
,,2 ,,
,
ˆˆ
2
1
1
Ixy
Rxy Rxy I xy I xy
Rxy
Ixy
xy xy I xy I xy
xy
ZZ III
Zx Zy x Z
x
Zx Z x Z
Zx Zy
λ
λ
λ
←+⋅ −
Φ←Φ+⋅ −
Φ
←− −⋅
⎛⎞
−∂ ∂ −∂ ∂ +
⋅++
⎜⎟
⎜⎟
∂∂− +
+∂ ∂ +∂ ∂
⎝⎠
(20)
Where the explicit dependence of the parameters on (x, y) has been removed in the last
equation for clarity.
The expressions in Eqs. 20 are iterated until the variation in the error E is below a given
threshold.
Regularization
As the method is pixel-based, a regularization scheme is needed to smooth the overall
solution. A very simple regularization is performed at the end of every iteration by filtering
Advances in Sonar Technology
10
the estimated reflectivity and beam-pattern maps. Reflectivity values for the points in
shadowed areas are set to that of their nearest illuminated neighbors by hexadecagonal
dilation (Coiras 1998) of non-shadowed areas. Whereas values of Φ for all the points
subtending the same angle α to the sensor are set to their median value, since the beam
profile of the sensor is supposed to be constant for each grazing angle α:
() ( )( ) ()
{
}
00 00
,,,,
x
yMedian xy xy xy
αα
Φ= Φ = (21)
Initialization
The optimization procedure starts by initialization of the R, Z and Φ maps. The reflectivity is
set to a constant value (typically 0.9), and the elevation of every point (x, y) is set to that of
the first return at (0, y), corresponding to the altitude of the sonar over the seafloor at that
point of its trajectory. The initial beam-pattern Φ is set to the original image values I and
then regularized using Eq. 21.
Multi-resolution
A multi-resolution implementation of the method described on the paragraphs above results
in better convergence and improved results. Implementation of the multi-resolution version
starts by the construction of a multi-resolution pyramid by iterated sub-sampling of the
source side-looking image. Processing starts at the smallest level (coarser resolution), using
the initialization and regularization procedures described in the previous sections. The
resulting R, Z and Φ maps from one level are used as initial maps for the next resolution
level. The process finishes when the final stage—corresponding to the full resolution
image—is processed. Typically 3 levels of multi-resolution are used.
3.3 Sonar inversion results
During the MX3 2005 experiment carried out by NURC and partner nations in La Spezia
(Italy), extensive surveys of an area of seabed were performed using several different
vehicle and sensor combinations. The Sea Otter autonomous underwater vehicle (AUV),
which was equipped with a Klein 2000 side-scan sonar, and one of the seabed images it
produced is shown in Fig. 5.
Fig. 5. The Sea Otter AUV and one of the images it collected during the MX3 trials with its
Klein 2000 side-scan sonar.