Electrical Engineering Mechanical Systems Design Handbook Dorf CRC Press 2002819s_3 pdf
Bạn đang xem bản rút gọn của tài liệu. Xem và tải ngay bản đầy đủ của tài liệu tại đây (1.87 MB, 41 trang )
(4.18)
and summing the cutting forces contributed by all teeth, the total dynamic milling forces acting on
the cutter are found as
(4.19)
where and cutter pitch angle is Substituting the chip thickness (4.16) and
tooth forces (4.7) into (4.18), and rearranging the resulting expressions in matrix form yields,
(4.20)
where time-varying directional dynamic milling force coefficients are given by
Considering that the angular position of the parameters changes with time and angular velocity,
Equation (4.20) can be expressed in time domain in a matrix form as
10,11
(4.21)
As the cutter rotates, the directional factors vary with time, which is the fundamental difference
between milling and operations like turning, where the direction of the force is constant. However,
like the milling forces, [A(t)] is periodic at tooth passing frequency ω = NΩ or tooth period T =
2π/ω, thus can be expanded into Fourier series.
(4.22)
FF F
FF F
xj tj j rj j
yj tj j rj j
=− −
=+ −
cos sin
sin cos
φφ
φφ
FF FF
xx
j
N
jy y
j
N
j
jj
==
=
−
=
−
∑∑
0
1
0
1
(); ()φφ
φφφ
jp
j=+ ,
φπ
p
N= 2/ .
F
F
aK
aa
aa
x
y
x
y
t
xx xy
yx yy
=
1
2
∆
∆
ag K
ag K
ag K
ag K
xx j j r j
j
N
xy j j r j
j
N
yx j j r j
j
N
yy j j r j
j
N
=− + −
=− + +
=−−
=−+
=
−
=
−
=
−
=
−
∑
∑
∑
∑
[sin ( cos )]
[( cos ) sin ]
[( cos ) sin ]
[sin ( cos )]
212
12 2
12 2
212
0
1
0
1
0
1
0
1
φφ
φφ
φφ
φφ
{ ( )} [ ( )]{ ( )}F t aK A t t
t
=
1
2
∆
[ ( )] [ ] , [ ] [ ( ) |At A e A
T
At e dt
r
ir t
r
r
ir t
T
==
=−∞
∞
−
∑
∫
ωω
1
0
8596Ch04Frame Page 68 Tuesday, November 6, 2001 10:19 PM
© 2002 by CRC Press LLC
The number of harmonics (r) of the tooth-passing frequency (ω) to be considered for an accurate
reconstruction of [A(t)] depends on the immersion conditions and the number of teeth in the cut.
If the most simplistic approximation, the average component of the Fourier series expansion, is
considered, i.e., r = 0,
(4.23)
Because [A
0
] is valid only between the entry and exit angles of the cutter
(i.e., and it becomes equal to the average value of [A(t)] at cutter
pitch angle
(4.24)
where the integrated functions are given as
The average directional factors are dependent on the radial cutting constant (K
r
) and the width of
cut bound by entry and exit angles. The dynamic milling expression (4.21) is reduced
to the following
(4.25)
where [A
0
] is a time-invariant but immersion-dependent directional cutting coefficient matrix.
Because the average cutting force-per-tooth period is independent of the helix angle, [A
0
] is valid
for helical end mills as well.
4.3.2 Chatter Stability Lobes
Transfer function matrix ([Φ (iω)]) identified at the cutter–workpiece contact zone,
(4.26)
where Φ
xx
(iω) and Φ
yy
(iω) are the direct transfer functions in the x and y directions, and Φ
xy
(iω)
and Φ
yx
(iω) are the cross-transfer functions. The vibration vectors at the present time (t) and previous
tooth period (t – T) are defined as,
[] [().A
T
Atdt
T
0
0
1
=
∫
()φ
st
()φ
ex
g
jj
() ),φ=1
φφ
jp
tT==ΩΩ and ,
φπ
p
N= 2/ .
[ ( )] [ ( )]AAd
N
p
xx xy
yx yy
st
ex
0
1
2
==
∫
φ
φφ
π
αα
αα
φ
φ
αφφφ
αφφφ
αφφφ
αφφφ
φ
φ
φ
φ
φ
φ
φ
φ
xx r r
xy r
yx r
yy r r
KK
K
K
KK
st
ex
st
ex
st
ex
st
ex
=−+
[]
=− − +
[]
=− + +
[]
=− − −
[]
1
2
1
2
1
2
1
2
22 2
22 2
22 2
22 2
cos sin
sin cos
sin cos
cos sin
()φ
st
()φ
ex
{ ( )} [ ]{ ( )}Ft aK A t
t
=
1
2
0
∆
[( )]
() ()
() ()
Φ
ΦΦ
ΦΦ
i
ii
ii
xx xy
yx yy
ω
ωω
ωω
=
8596Ch04Frame Page 69 Tuesday, November 6, 2001 10:19 PM
© 2002 by CRC Press LLC
Describing the vibrations at the chatter frequency ω
c
in the frequency domain using harmonic
functions,
(4.27)
and substituting gives,
where ω
c
T is the phase delay between the vibrations at successive tooth periods T. Substituting
{Φ(iω
c
)} into the dynamic milling Equation (4.25) gives
which has a nontrivial solution if its determinant is zero,
which is the characteristic equation of the closed-loop dynamic milling system. The notation is
further simplified by defining the oriented transfer function matrix as
(4.28)
and the eigenvalue of the characteristic equation as
(4.29)
The resulting characteristic equation becomes,
(4.30)
The eigenvalue of the above equation can easily be solved for a given chatter frequency ω
c
, static
cutting coefficients (K
t
, K
r
) which can be stored as a material-dependent quantity for any milling
cutter geometry, radial immersion , and transfer function of the structure (4.28). If two
orthogonal degrees-of-freedom in feed (X) and normal (Y) directions are considered (i.e., Φ
xy
=
Φ
yx
= 0.0), the characteristic equation becomes just a quadratic function
(4.31)
{} { () ()} ;{ } { ( ) ( )} .rxtyt r xtTytT
TT
==−−
0
{ ( )} [ ( )]{ }
{ ( )} { ( )}
ri i Fe
ri e ri
c
it
c
it
c
c
c
ωω
ωω
ω
ω
=
=
−
Φ
0
{ } {( }( )}∆= − −xx yy
T
00
{ ( )} { ( )} { ( )}
[ ] [ ( )]{ }
∆
Φ
iriri
ee iF
cc c
iT it
c
cc
ωω ω
ω
ωω
=−
=−
−
0
1
{ } [ ][ ][ ( )]{ }F e aK e A i F e
it
t
iT
c
it
cc c
ωω ω
ω=−
−
1
2
1
0
Φ
det[[ ] ( )[ ][ ( )]]IKaeAi
t
iT
c
c
−− =
1
2
10
0
ω
ωΦ
[( )]
() () () ()
() () () ()
Φ
ΦΦ ΦΦ
ΦΦ ΦΦ
0
i
ii ii
ii ii
c
xx xx c xy yx c xx xy c xy yy c
yx xx c yy yx c yx xy c yy yy c
ω
αωαωαωαω
αωαωαωαω
=
++
++
Λ=− −
−
N
aK e
t
iT
c
4
1
π
ω
().
det[[ ] [ ( )]]Ii
c
+=ΛΦ
0
0ω
(, )φφ
st ex
aa
0
2
1
10ΛΛ++=
8596Ch04Frame Page 70 Tuesday, November 6, 2001 10:19 PM
© 2002 by CRC Press LLC
where
Then, the eigenvalue Ω is obtained as
(4.32)
As long as the plane of cut (x, y) is considered, the characteristic equation is still a simple quadratic
function regardless of the number of modes considered in the machine tool structure. Indeed, the
actual transfer function measurements of the machine dynamics can be used at each frequency.
Because the transfer functions are complex, the eigenvalue has a real and an imaginary part, Λ =
Λ
R
+ iΛ
I
. Substituting the eigenvalue and in Equation (4.29) gives the
critical axial depth of cut at chatter frequency ω
c
,
(4.33)
Because a
lim
is a real number, the imaginary part of the Equation (4.33) must vanish,
(4.34)
By substituting,
(4.35)
into the real part of the Equation (4.33) (imaginary part vanishes), the final expression for chatter-
free axial depth of cut is found as
(4.36)
Therefore, given the chatter frequency (ω
c
), the chatter limit in terms of the axial depth of cut can
directly be determined from Equation (4.36).
The corresponding spindle speeds are also found in a manner similar to the chatter in orthogonal
cutting presented in the previous section.
From Equation 4.35,
(4.37)
aii
ai i
xx c yy c xx yy xy yx
xx xx c yy yy c
0
1
=−
=+
ΦΦ
ΦΦ
()()( )
() ()
ωωαααα
αωαω
Λ=− ± −
1
2
4
0
11
2
0
a
aaa().
eTiT
iT
cc
c
−
=−
ω
ωωcos sin
a
NK
TT
T
i
TT
T
t
RcIc
c
IcRc
c
lim
=−
−+
−
+
−−
−
2
1
1
1
1
π
ωω
ω
ωω
ω
ΛΛ
ΛΛ
( cos ) sin
( cos )
( cos ) sin
( cos )
ΛΛ
IcRc
TT( cos ) sin10−− =ωω
κ
==
−
Λ
Λ
I
R
c
c
T
T
sin
cos
ω
ω1
a
NK
R
t
lim
()=− +
2
1
2
πΛ
κ
κ
== = −tan
cos( / )
sin ( / )
tan [ / ( / )]ψ
ω
ω
πω
c
c
c
T
T
T
2
2
22
8596Ch04Frame Page 71 Tuesday, November 6, 2001 10:19 PM
© 2002 by CRC Press LLC
and the phase shift of the eigenvalue is ψ = tan
–1
κ, and ∈ = π – 2ψ is the phase shift between inner
and outer modulations (present and previous vibration marks). Thus, if k is the integer number of
full vibration waves (i.e., lobes) imprinted on the cut arc,
(4.38)
Again, care must be taken in calculating the phase shift (ψ) from the real (Λ
R
) and imaginary (Λ
I
)
parts of the eigenvalue. The spindle speed n(rev/min) is simply calculated by finding the tooth-
passing period T(s),
(4.39)
In summary, the transfer functions of the machine tool system are identified, and the dynamic
cutting coefficients are evaluated from the derived Equation (4.24) for a specified cutter, workpiece
material, and radial immersion of the cut. Then the stability lobes are calculated as follows:
8
• Select a chatter frequency from transfer functions around a dominant mode.
• Solve the eigenvalue Equation (4.31).
• Calculate the critical depth of cut from Equation (4.36).
• Calculate the spindle speed from Equation (4.39) for each stability lobe k = 0, 1, 2, ….
• Repeat the procedure by scanning the chatter frequencies around all dominant modes of the
structure evident on the transfer functions.
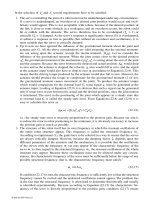
A sample stability lobe for a vertical machining center milling Aluminum 7075 alloy with a
four-fluted helical end mill is shown in Figure 4.3. The measured transfer function parameters of
the machine at the tool tip are given as follows: ω
nx
= {452.8, 1448}H z; ζ
x
= {0.12, 0.017}, k
x
=
{124.7E + 6, (–) 6595.6E + 6}N/m; ω
ny
= {516, 1407}H z; ζ
x
= {0.024, 0.0324}, k
y
= {(–) 2.7916E
+ 10, 3.3659E + 9}N/m in the feed (x) and normal (y) directions, respectively. The stability lobes
are predicted analytically with the theory given here, as well as using a time domain numerical
solution which takes a considerable amount of computation time. The analytical method agrees
well with the numerical solutions. The machine tool exhibits severe chatter vibrations when the
FIGURE 4.3 Stability lobes for a half immersion down milling of Al7075-T6 material with a bullnose cutter
having two edges, 31.75 shank diameter and 4.7625-mm corner radius. The feed per tooth was s
t
= 0.050 mm/rev
in cutting tests.
0 2000 4000 6000 8000 10000 12000 14000 16000 18000 20000
0
1
2
3
4
5
6
Spindle speed [rev/min]
Axial depth of cut limit [mm]
Unstable milling
Stable milling
ωπ
c
Tk=+∈ 2
Tkn
NT
c
=+→=
1
2
60
ω
π()∈
8596Ch04Frame Page 72 Tuesday, November 6, 2001 10:19 PM
© 2002 by CRC Press LLC
spindle speed is set to 9500 rev/min. The cutting force amplitudes are large, and the chatter occurs
at 1448 Hz, which is the second bending mode of the spindle. When the speed and, therefore,
productivity are increased to 14,000 rev/min, the chatter disappears and the force is dominated by
the regular tooth-passing frequency of 467 Hz. The finish surface becomes acceptable, and the
cutting force magnitude drops at the chatter vibration-free spindle speed and depth of cut.
References
1. F. Koenigsberger and J. Tlusty, Machine Tool Structures, Vol. I: Stability against Chatter, Pergamon
Press, Oxford, 1967.
2. Y. Koren, Computer Control of Manufacturing Systems, McGraw Hill, New York, 1983.
3. Y. Altintas, Manufacturing Automation: Metal Cutting Mechanics, Machine Tool Vibrations, and
CNC Design, Cambridge University Press, Cambridge, 2000.
4. J. Tlusty and M. Polacek, The stability of machine tools against self-excited vibrations in machin-
ing, International Research in Production Engineering, ASME, 465–474, 1963.
5. S.A. Tobias and W. Fishwick, Theory of Regenerative Chatter, The Engineer, London, 1958.
6. S.A Tobias, Machine Tool Vibrations, Blackie and Sons Ltd., London, 1965.
7. H.E. Merrit, Theory of self-excited machine tool chatter, Transactions of ASME Journal of Engi-
neering for Industry, 87, 447–454, 1965.
8. Y. Altintas and E. Budak, Analytical prediction of stability lobes in milling, Annals of the CIRP,
44(1), 357–362, 1995.
9. E. Budak and Y. Altintas, Analytical prediction of chatter stability conditions for multi-degree of
systems in milling. Part i: Modelling, Part ii: Applications, Transactions of ASME Journal of
Dynamic Systems, Measurement and Control, 120, 22–36, 1998.
10. R.E. Hohn, R. Sridhar, and G.W. Long, A stability algorithm for a special case of the milling
process, Transactions of ASME Journal of Engineering for Industry, 325–329, May 1968.
11. I. Minis, T. Yanushevsky, R. Tembo, and R. Hocken, Analysis of linear and nonlinear chatter in
milling, Annals of the CIRP, 39, 459–462, 1990.
8596Ch04Frame Page 73 Tuesday, November 6, 2001 10:19 PM
© 2002 by CRC Press LLC
5
Machine Tool
Monitoring and Control
5.1 Introduction
5.2 Process Monitoring
Tool Wear Estimation • Tool Breakage Detection •
Chatter Detection
5.3 Process Control
Control for Process Regulation • Control for Process
Optimization
5.4 Conclusion
5.1 Introduction
Machine tool monitoring and control are essential for automated manufacturing. Monitoring is
necessary for detection of a process anomaly to prevent machine damage by stopping the process,
or to remove the anomaly by adjusting the process inputs (feeds and speeds). A process anomaly
may be gradual such as tool/wheel wear, may be abrupt such as tool breakage, or preventable such
as excessive vibration/chatter. Knowledge of tool wear is necessary for scheduling tool changes;
detection of tool breakage is important for saving the workpiece and/or the machine; and identifying
chatter is necessary for triggering corrective action. One difficulty in machine tool monitoring stems
from the limited sensing capability afforded by the harsh manufacturing environment. Sensors can
seldom be placed at the point of interest, and when located at remote locations they do not provide
the clarity of measurement necessary for reliable monitoring. This limited sensing capability is
often compensated for by using multiple sensors to enhance reliability. Another difficulty in machine
tool monitoring is the absence of accurate analytical models to account for changes in the measured
variables by variations in the cutting conditions. Such changes are often attributed to process
anomalies by the monitoring system, which result in false alarms.
Machine tool control is motivated by two objectives: (1) process regulation, so as to preempt
excessive forces, correct a process anomaly, or reduce contouring errors; and (2) process optimi-
zation, for the purpose of improving the quality of the part or reducing operation time based on
feedback from the process.
The aim of this chapter is to provide a conceptual survey of machine tool monitoring and control.
As such, no attempt has been made to acknowledge all the research in this area, and the citations
are included mainly to provide representative examples of various approaches.
5.2 Process Monitoring
Process monitoring is generally performed through the analysis of process measurements. For this
purpose, a process variable or a set of variables (e.g., force, power, acoustic emission, feed motor
Kourosh Danai
University of Massachusetts,
Amherst
8596Ch05Frame Page 75 Tuesday, November 6, 2001 10:19 PM
© 2002 by CRC Press LLC
current) is measured and processed on-line to be compared against its expected value. Any deviation
from this expected value is attributed to a process anomaly. Expected values of measurements are
either determined according to an analytical model of the process
1
or established empirically.
2
The
advantage of using analytical models is that they account for changes in the machine inputs such
as feeds and speeds. The disadvantage of analytical models is that they are often not accurate and
need to be calibrated for the process. Establishing the expected values of measurements empirically
is simpler and more straightforward. However, the empirical values are only suitable for particular
operations and cannot be extrapolated to others. To provide a representative sample of approaches
used in this area, tool wear estimation, tool breakage detection, and chatter identification are
discussed as the most investigated topics in machine tool monitoring.
5.2.1 Tool Wear Estimation
Flank wear directly influences the size and quality of the surface.
3
Flank wear can affect fatigue
endurance limit by affecting surface finish, lubrication retention capability by changing the distri-
bution of heights and slopes of the surface,
4
and other tribological aspects
5,6
by affecting the
topography of the machined surface. Therefore, information about the state of flank wear is sought
to plan tool changes in order to avoid scrapping or manipulating the feed and cutting speed in-
process to control tool life.
7
Methods used for flank wear estimation can be classified as either direct or indirect.
8
Direct
methods measure flank wear either in terms of material loss from the tool
9
or by observing the
worn surface using optical methods.
10
Direct methods are generally more reliable, although they
are not convenient for in-process use in a harsh manufacturing environment. Indirect methods, on
the other hand, estimate the flank wear by relating it to a measured variable such as the change in
size of the workpiece,
11
cutting force,
12
temperature,
13
vibration,
14
or acoustic emissions.
15
The ideal
measured variable in the indirect method is one that is insensitive to process inputs. For example,
noncontact methods have been recently developed for surface roughness measurement,
16,17
which
will undoubtedly have an impact on on-line estimation of tool wear.
Among the measurements used for indirect flank wear estimation, acoustic emission (AE) and
the cutting force have been the most popular due to their sensitivity to tool wear and reliability of
measurement. The cutting force generally increases with flank wear due to an increase in the contact
area of the wear land with the workpiece. Zorev
18
and De Filippi and Ippolito
19
were among the
first who demonstrated the direct effect of flank wear on the cutting force, which motivated
separation of the cutting force signal into two components, one associated with the unworn tool
and the other associated with tool wear. The unworn tool component is usually estimated at the
beginning of the cut with a new tool, and then subtracted from the measured force to estimate the
wear affected component. This method can provide relatively accurate estimates of flank wear so
long as the cutting variables (feed, speed, and depth of cut) remain unchanged. However, when the
cutting variables change, due to such factors as the geometric requirements of the part or manip-
ulation of the operating parameters, the identification of the wear affected component becomes
difficult. In such cases, either the effect of the manipulated cutting variable on the cutting force is
estimated by a model
1
and separated to identify the wear affected component,
10,20
or the wear
affected component is estimated from small cutting segments where the cutting variables remain
unchanged.
21
In either case, recursive parameter estimation techniques, which require persistent
excitation of the cutting force to guarantee parameter convergence, are used for identification
purposes. The requirement for persistent excitation is relaxed,
12
by measuring the cutting force
during the transient at the beginning of the cut when the tool engages the workpiece. During this
transient, the sharp tool chip formation component, which is proportional to the cross-sectional
area of the cut normal to the main cutting velocity, takes a wide range of values, from zero to the
steady-state value (product of the feed and depth of cut). The method uses the variations of the
cross-sectional area of the cut during this short time interval when flank wear is essentially constant
8596Ch05Frame Page 76 Tuesday, November 6, 2001 10:19 PM
© 2002 by CRC Press LLC
to tune the model and estimate its parameters. It has been shown in laboratory experiments that
the residual force components in the axial and tangential directions increase linearly with the wear
land width, which can be used to estimate flank wear.
12
Similar to the cutting force signal, acoustic emission has been studied extensively for flank wear
estimation, where various statistical properties of the AE signal have been shown to correlate with
flank wear.
15
To define more clearly the effect of flank wear, statistical pattern classification of AE
signal in frequency domain has been utilized as well.
22,23
Despite the considerable effort toward estimation of flank wear from a single variable, single
sensor measurements do not seem to be robust to varying cutting conditions. This has motivated
integration of multiple measurements through artificial neural networks.
24,25
Artificial neural net-
works have the ability to represent patterns of fault signatures by complex decision regions without
reliance on the probabilistic structure of the patterns. Thus, they are powerful tools for fault
detection/diagnosis. Generally, a neural network is trained to identify the tool wear pattern by
supervised learning from samples of measurements taken at various levels of tool wear. Therefore,
the ability of neural networks to form reliable wear patterns depends not only on their topology,
but the extent of their training. In cases such as machining where adequate data are not available
to select the topology of the network or to provide the tool wear patterns for a wide range of cutting
conditions and material/tool combinations, these networks are not practical.
A remedy to supervised learning is the application of unsupervised neural networks
26
that can
form pattern clusters of data without a known target for each input vector. These networks use
prototype vectors to characterize each category, and then classify input vectors within each category
according to their similarity to these prototype vectors. While there is a need to provide data from
each category to these networks in order to form the prototype vectors, the demand for training is
considerably less. Therefore, unsupervised networks have better potential for on-line utility in
machine tool monitoring. A comprehensive demonstration of unsupervised neural networks in tool
failure monitoring is provided by Li et al.,
27
who applied an array of adaptive resonance theory (ART2)
networks
28
to detect tool wear, tool breakage, and chatter using vibration and AE measurements.
5.2.2 Tool Breakage Detection
Fracture is the dominant mode of failure for more than one quarter of all advanced tooling material.
Therefore, on-line detection of tool breakages is crucial to the realization of fully automated
machining. Ideally, a tool breakage detection system must be able to detect failures rapidly to
prevent damage to the workpiece, and must be reliable to eliminate unnecessary downtime due to
false alarms.
Several measurements have been reported as good indicators of tool breakage.
29
Among these,
the cutting force,
30
acoustic emission,
31,32
spindle motor current,
33
feed motor current,
34
and machine
tool vibration
35,36
have been investigated extensively for their sensitivity to tool breakage. In general,
to utilize a measurement for tool breakage detection, two requirements need to be satisfied. First,
the measurement must reflect tool breakage under diverse cutting conditions (e.g., variable speeds,
feeds, coolant on/off, workpiece material). Second, the effect of tool breakage on the measurement
(tool breakage signature) must be uniquely distinguishable, so that other process irregularities such
as hard spots will not be confused with tool breakage. The tool breakage signature is commonly
in the form of an abrupt change, in excess of a threshold value. Despite considerable effort,
37,38
reliable signatures of tool breakage that are robust to diverse cutting conditions have not yet been
found from individual measurements.
To extract more information from individual measurements to improve the reliability of tool
breakage signatures, pattern classification techniques have been utilized. One of the earliest efforts
was by Sata et al.
39
who related features of the cutting force spectrum such as its total power, the
power in the very low frequency range, and the power at the highest spectrum peak and its frequency
to chip formation, chatter, and a built-up edge. It was shown that the cutting force measurement
8596Ch05Frame Page 77 Tuesday, November 6, 2001 10:19 PM
© 2002 by CRC Press LLC
alone provides sufficient information for unique identification of the above phenomena. Another
important work in this category is by Kannatey-Asibu and Emel
22
who applied statistical pattern
classification to identify chip formation, tool breakage, and chip noise from acoustic emission
measurements. They reported a success rate of 90% for tool breakage detection. The only drawback
to spectrum-based tool breakage detection is the computational burden associated with obtaining
the spectrum, which often precludes its on-line application.
The alternative to single-sensor-based pattern classification is the multi-sensor approach using
artificial neural networks for establishing the breakage patterns.
24
However, as already mentioned
for tool wear estimation, the utility of neural networks for tool breakage detection is limited by
their demand for expensive training. A pattern classifier that requires less training than artificial
neural networks is the multi-valued influence matrix (MVIM) method
40
which has a fixed structure
and has been shown to provide robust detection of tool breakages in turning with limited
training.
41
Unsupervised neural networks have also been proposed for tool breakage detection in machin-
ing.
42
The two predominant methods of unsupervised learning presently available for neural net-
works are Kohonen’s feature mapping and adaptive resonance theory (ART2).
28
Kohonen’s method
of feature mapping establishes the decision regions for normal and abnormal categories through
prototype vectors that represent the centers of measurement clusters belonging to these categories.
Classification is based on the Euclidean distance between the measurements and each of the
prototype vectors. While Kohonen’s method forms the prototype vectors far enough from each
other to cope with variations in the tool breakage signature, it requires one or more sets of
measurements at tool breakage to establish the prototype vector for the abnormal category. The
other method of unsupervised learning, the adaptive resonance theory (ART2), classifies the mea-
surements as normal unless they are sufficiently different. When applied to tool breakage detection,
it does not require any samples of measurements to be taken at tool breakage. ART2, however,
may not cope effectively with varying levels of noise associated with different sensors, and may
classify multiples of a prototype within the same category, so it may produce misclassification. A
hybrid of the above pattern classifiers is the single category-based classifier (SCBC)
43
that performs
detection by comparing each set of measurements against their corresponding prototype values for
their normal category and detects tool breakage when the measurements are sufficiently different
from their normal prototypes. Another variant of ART2 applied to tool breakage detection is a
network consisting of an array of ART2 networks, each classifying the pattern associated with an
individual sensor.
27
5.2.3 Chatter Detection
Chatter is the self-excited vibration of the machine tool that reflects the instability of the cutting
process. Chatter is often a serious limitation to achieving higher rates of removal, as it adversely
affects the surface finish, reduces dimensional accuracy, and may damage the tool and machine.
Therefore, machine tool chatter needs to be detected rapidly and corrected before it damages the
workpiece, tool, or the machine.
Several variables have been studied for detection of chatter. These include the cutting force
signal, displacement or acceleration of a point in the vicinity of the tool–workpiece interface, or
the sound emitted from the machine. Delio et al.
44
claim that sensor placement and the frequency
response limitations of the transducer are the two major difficulties in detection of chatter. They
also claim that sound provides the most reliable and robust signature for chatter. While chatter has
been investigated extensively, most of the efforts have been directed toward prediction of chatter
rather than its detection. The approaches used for chatter detection mirror those employed for tool
breakage detection, except that analysis is performed primarily in frequency domain where the
effect of vibration is most pronounced.
8596Ch05Frame Page 78 Tuesday, November 6, 2001 10:19 PM
© 2002 by CRC Press LLC
5.3 Process Control
The advent of open-architecture control provides a natural framework for implementation of control
systems in machine tools.
45
Machine tool control is generally performed at two levels: (1) servo-control
to execute the command motion dictated by interpolators for following a prespecified contour, or (2)
supervisory control to continually adjust the process variables for the purpose of either regulating the
process against disturbances/detected anomalies, or optimizing performance.
46
Process regulation is
often incorporated as the next step to process monitoring, whereby the controller attempts to correct,
if possible, the detected anomaly. Process optimization, on the other hand, is implemented to enhance
productivity based on an assessment of process and part quality constraints.
5.3.1 Control for Process Regulation
Control for process regulation has been attempted for one of the following reasons: maintaining
constant power or force, safeguarding against chatter, or correcting machine tool errors. The most
regulated process variable in machining has been the cutting force, mainly for its ease of measure-
ment on-line, and its reflection of process anomalies such as tool breakage and chatter. While there
have been differences in format and the underlying models used, most of the controllers designed
for force regulation have used a dynamic model of the cutting force with respect to the manipulated
variable (i.e., feed or speed) and have employed parameter estimation to adapt the model to changing
process conditions.
47-53
Within this category, Furness et al.
54
regulated the torque in drilling to avoid
possible chipping of the drill tips, stall of the spindle motor, thermal softening of the tool, or
torsional failure of the drill.
Among the first to design a controller for elimination of chatter were Nachtigal and Cook
55
who
used the cutting force signal as feedback to control the position of the tool for increased stability.
They designed their controller on a fixed model of the machine tool–workpiece dynamics. As a
next step and to account for parameter uncertainty in that model, Mitchell and Harrison
56
integrated
an observer in their control system to estimate the cutting tool motion on-line for feedback to the
control system. Active control of chatter is, by and large, an identification problem, because once
the presence of chatter is detected, the solution seems to be straightforward.
44,57
Another active area of research in process regulation is error correction. The accuracy of a
machined part is generally attributed to geometric and kinematic errors of the machine spindle,
thermal effects, and static and dynamic loading of the drives.
58
Therefore, considerable effort has
been directed toward error compensation by modifying the tool position. Two fundamental
approaches have been used for reducing contouring errors:
46
(1) by reducing the tracking error of
individual axes, and (2) by reducing contour error which is defined as the error between the actual
and desired tool path. As in force-regulation problems, a common approach used in many of these
systems is utilization of parameter estimation to update the servo-models in the presence of variable
loading and friction (e.g., see Tsao and Tomizuka
59
). The literature on tool error compensation is
quite extensive and is not surveyed here in the interest of space. Interested readers are referred to
Koren
46
or Tung et al.
60
for specific examples and an overview of the research in this area.
5.3.2 Control for Process Optimization
The adaptation of process variables for the purpose of enhancing process efficiency is addressed
within the area of control for process optimization.
1
Process efficiency is generally defined in terms
of reduced* production cost or cycle time. Under deterministic conditions (no modeling uncertainty
*Control
for process optimization has also been referred to as adaptive control optimization (ACO) in the
manufacturing engineering literature.
46
8596Ch05Frame Page 79 Tuesday, November 6, 2001 10:19 PM
© 2002 by CRC Press LLC
and noise), there would be no need for a controller, as the optimal process inputs (feeds and speeds)
could be determined by nonlinear programming.
61
In view of the highly complex nature of machin-
ing processes, however, the process inputs need to be changed iteratively in response to measure-
ments of process and part quality constraints. This interactive approach to process optimization is
adopted to enable the control system to maintain constraint satisfaction despite modeling uncertainty
arising from (1) the diversity of machining conditions due to variations in material properties,
tool/wheel type, and lubrication, (2) the stochastic nature of these processes caused by material
inhomogeneity, workpiece misalignment, and measurement noise, and (3) process time variability
due to tool wear.
The first attempt at control for process optimization was the Bendix system,
62
which was designed
to continually maximize the machining removal rate through changes in both the feedrate and
spindle speed in response to feedback measurements of cutting torque, tool temperature, and
machine vibration. The Bendix System, however, was limited in applicability due to the need to
estimate tool wear based on an accurate model. A subsequent advancement in control for process
optimization was the Optimal Locus Approach,
63,64
which made it possible to forego estimation of
tool wear. In this approach, the locus of the optimal points associated with various levels of tool
wear is computed, and the optimal point is sought where process and part quality constraints become
tight. The Optimal Locus Approach can avoid estimation of tool wear by using the tightness of
constraints as the measure for optimality, but it still needs to rely on the accuracy of the process model
for computing the optimal locus and determining
a priori
which constraints are tight at the optimum.
Because the success of this approach depends on the premise that modeling uncertainty will have
negligible effect on the accuracy of the optimal locus, it will produce suboptimal results when this
premise is violated. A similar approach in drilling, but with several more constraints, was demonstrated
by Furness et al.
65
by locating the feasible region of the process according to the pair of constraints
active during each of the three drilling phases. In this application, the constraints were considered to
be stationary, due to the absence of tool wear in short-duration drilling cycles.
One approach to coping with modeling uncertainty in process optimization is to calibrate (e.g., by
parameter estimation) the closed-form solution of the optimal process inputs. This approach has been
implemented in cylindrical plunge grinding where each cycle is moved closer to its minimum time
based on a closed-form solution of the optimization problem according to a monotonicity analysis.
66
In this method, parameter estimation is used to cope with modelling uncertainty and process variability
by continually updating the estimated optimal conditions using parameters estimated from the preceding
grinding cycle. The basic requirement for this system is the availability of a relatively accurate model
of the process that can be updated using parameter estimation. Such accurate modeling is possible for
a few machining processes, but its extension to less-understood processes is difficult.
Another approach that uses an iterative strategy to process optimization but does not require
accurate process models is the method of Recursive Constraint Bounding (RCB).
67
Like the Optimal
Locus Approach, RCB assesses optimality from the tightness in the constraints using measurements
of process and part quality after each workpiece has been finished (cycle). It also uses the model
of the process to find the optimal point. However, unlike the Optimal Locus Approach, RCB assumes
the model to be uncertain when determining which constraints are to be tight at the optimum and
selecting the machine settings for each process cycle. It obtains the machine settings by solving a
customized nonlinear programming (NLP) problem, and allows for uncertainty by incorporating
conservatism into the NLP problem. This conservatism is tailored according to the severity of
modeling uncertainty associated with each constraint. The repeated minimization of the objective
function with a progressively less conservative model has been shown to lead to bound constraints
and optimal machine settings.
68
Empirical modeling using neural networks has also been proposed for coping with modeling
uncertainty in process optimization.
69,70
In one case, separate neural networks are used to represent
tool wear and the process, respectively, as a function of process variables (i.e., feed and speed),
8596Ch05Frame Page 80 Tuesday, November 6, 2001 10:19 PM
© 2002 by CRC Press LLC
and the optimal point of the process is determined according to the neural network model and the
estimate of tool wear.
69
In another approach, an iterative method to process optimization is adopted
by using a neural network trained as an inverse process model to provide increasingly more optimal
process variables.
70
One of the inputs to this neural network is an estimate of a cost function
obtained from measurements of cutting force and vibration. Neural network modeling is appealing
from the point of view of coping with process uncertainty; however, it has limited utility in
manufacturing due to the expense associated with obtaining training data.
5.4 Conclusion
Machine tool monitoring and control provide the bridge between machining research and the
production line. Nevertheless, despite years of research and the multitude of success stories in the
laboratory, only a small amount of this technology has been transferred to production. It may be
argued that the slowness in technology transfer is due to the complexity of machining processes
and their incompatibility with the sensing technology. This is supported by the fact that most of
the monitoring systems developed are specific to isolated problems, and cannot be integrated with
other solutions to provide an effective monitoring system for all the process anomalies of concern.
Similarly, it may be argued that most control systems developed in the laboratory use impractical
or expensive transducers that are not suitable for the harsh production environment.
While complexity and sensing limitations are important impediments to technology transfer in
monitoring, they are minor compared to the cultural barrier imposed by the stringent manufacturing
environment. For implementation in production, monitoring and control systems need to be either
retrofitted to the existing machine tools or incorporated into new machine tools. The first option will
almost never happen because the savings from these systems rarely justify the loss from production
downtime. The second option, while more plausible, has not broadly occurred either, mainly due to
the cost competitiveness of the machine tool market. Three requirements need to be satisfied for
inclusion of monitoring and control in machine tools: (1) the underlying sensors need to be nonintrusive
and inexpensive, (2) the monitoring system needs to be comprehensive to detect every process anomaly
possible in operation, and (3) both monitoring and control need to be perfectly reliable and robust to
process variations. It is basically impossible to satisfy the above conditions, particularly the third one.
A compromise position is to incorporate monitoring and control for specific operations, based
on the sensing capability already available on the machine tool. The presence of open-architecture
control systems will be a significant boost to this solution, mainly due to the versatility these
systems offer in software development and trouble shooting.
References
1. Danai, K. and Ulsoy, A. G., 1987, A dynamic state model for on-line tool wear estimation in
turning,
ASME Journal of Engineering for Industry
, 109, 4, 396–399.
2. Du, R., Elbestawi, M. A., and Wu, S. M., 1995, Automated monitoring of manufacturing processes,
Part 1: Monitoring methods, and Part 2: Applications,
ASME Journal of Engineering for Industry,
117, 121–132.
3. Jetly, S., 1984, Measuring cutting tool wear on-line: some practical considerations,
Manufacturing
Engineering
, July, 55–60.
4. Whitehouse, D. J., 1978, Surfaces — a link between manufacture and function,
Proceedings of
the Institution of Mechanical Engineers
, 179–188.
5. Tonder, K., 1987, Effects of skew unidirectional striated roughness on hydrodynamic lubrication,
Wear
, 115, 19.
6. Wilson, W. R. D. and Sheu, S., 1988, Influence of surface topography on viscoplastic asperity
lubrication,
Wear
, 124, 311.
8596Ch05Frame Page 81 Tuesday, November 6, 2001 10:19 PM
© 2002 by CRC Press LLC
7. Koren, Y. and Ulsoy, A. G., 1989, Adaptive control in machining, in
Metals Handbook
, ASM
International, Cleveland, Ohio.
8. Cook, N. H., 1980, Tool wear sensors,
Wear
, 62, 49–57.
9. Cook, N. H. and Subramanian, K., 1978, Micro-isotope tool wear sensor,
CIRP Annals
, 27, 1,
73–78.
10. Park, J J. and Ulsoy, A. G., 1993, On-line flank wear estimation using an adaptive observer and
computer vision, Part 1: Theory, Part 2: Experiment,
ASME Journal of Engineering for Industry,
115, 30–43.
11. El Gomayel, J. I. and Bregger, K. D., 1986, On-line tool wear sensing for turning operations,
ASME Journal of Engineering for Industry
, 108, 44–47.
12. Nair, R., Danai, K., and Malkin, S., 1992, Turning process identification through force transients,
ASME Journal of Engineering for Industry
, 114, 1, 1–7.
13. Groover, M. P., Karpovich R. J., and Levy, E. K., 1977, A study of the relationship between remote
thermocouple temperature and tool wear in machining,
International Journal of Product Research
,
25, 2, 129–141.
14. Martin, P., Mutels B., and Draiper, J. P., 1975, Influence of lathe tool wear on the vibrations
sustained in cutting, 16th International Machine Tool Design and Research Conference.
15. Kannatey-Asibu, Jr., E. and Dornfeld, D. A., 1982, A study of tool wear in metal cutting using
statistical analysis of acoustic emission,
Wear
, 76, 2, 247–261.
16. Coker, S. A., Oh, S. J., and Shin, Y. C., In-process monitoring of surface roughness utilizing
ultrasound,
ASME
Journal for Manufacturing Scientists and Engineers,
120, 197–200.
17. Bradley, C., Bohlmann, J., and Kurada, S., 1998, A fiber optic sensor for surface roughness
measurement,
ASME Journal for Manufacturing Scientists and Engineers,
120, 359–367.
18. Zorev, N. N., 1966, Mechanics of contact on the clearance surface, in
Metal Cutting Mechanics
,
Shaw, M. C. (Ed.), 129–180, Pergamon Press, Oxford, England.
19. De Filippi, A. and Ippolito, R., 1969, Adaptive control in turning: cutting forces and tool wear
relationships for P10, P20, P30 carbides,
CIRP Annals
, 17, 377–379.
20. Danai, K. and Ulsoy, A. G., 1987, An adaptive observer for on-line tool wear estimation in turning,
Part I: Theory, Part II: Results,
Mechanical Systems and Signal Processing
, 1, 2, 211–240.
21. Koren, Y., Ko, T., Ulsoy, A. G., and Danai, K., 1991, Flank wear estimation under varying cutting
conditions,
ASME Journal of Dynamic Systems, Measurments, and Control
, 113, 2, 300–307.
22. Kannatey-Asibu, E. and Emel, E., 1987, Linear discriminant function analysis of acoustic emission
signals for cutting tool monitoring,
Mechanical Systems and Signal Processing
, 4, 333–347.
23. Houshmand, A. A. and Kannatey-Asibu, E., 1989, Statistical process control of acoustic emission
for cutting tool monitoring,
Mechanical Systems and Signal Processing
, 3, 4, 405–424.
24. Rangwala, S. and Dornfeld, D., 1990, Sensor integration using neural networks for intelligent tool
condition monitoring,
ASME Journal of Engineering for Industry
, 112, 219–228.
25. Govekar, E. and Grabec, I., 1994, Self-organizing neural network application to drill wear clas-
sification,
ASME Journal of Engineering for Industry
, 116, 233–238.
26. Leem, C. S., Dornfeld, D. A., and Dreyfus, S. E., 1995, A customized neural network for sensor
fusion in on-line monitoring for cutting tool wear,
ASME Journal of Engineering for Industry
,
117, 152–159.
27. Li, X. Q., Wong, Y. S., and Nee, A. Y. C., 1998, A comprehensive idenitification of tool failure
and chatter using a parallel multi-Art2 neural network,
ASME Journal for Manufacturing Scientists
and Engineers,
120, 433–442.
28. Hertz, J., Krogh, A., and Palmer, R. G., Eds., 1991,
Introduction to the Theory of Neural Compu-
tation
, Addison-Wesley, Redwood City, CA.
29. Tlusty, J. and Andrews, G. C., 1983, A critical review of sensors for unmanned machining,
Annals
of the CIRP
, 32, 2, 563–572.
30. Altintas, Y. and Yellowley, I., 1987, In-process detection of tool failure in milling using cutting
force models, in
Sensors for Manufacturing
, ASME, New York, 1–16.
31. Moriwaki, T., 1980, Detection for tool fracture by acoustic emission measurement,
Annals of the
CIRP
, 29, 1, 35–40.
8596Ch05Frame Page 82 Tuesday, November 6, 2001 10:19 PM
© 2002 by CRC Press LLC
32. Lan, M. S. and Dornfeld, D. A., 1984, In-process tool fracture detection, ASME Journal of Engi-
neering Materials and Technology, 106, April, 111–118.
33. Matsushima, K., Bertok, P., and Sata, T., 1982, In-process detection of tool breakage by monitoring
the spindle motor current of a machine tool, in Measurement and Control for Batch Manufacturing,
ASME, New York, 145–154.
34. Altintas, Y., 1997, Prediction of cutting forces and tool breakage in milling from feed drive current
measurements, ASME Journal for Manufacturing Scientists and Engineers, 119, 386–392.
35. Grieshaber, D., Ramalingam, R., and Frohrib, D., 1987, On real-time tool fracture in milling,
Proceedings of the 15th NAMRC, May, 477–484.
36. Hayashi, S. R., Thomas, C. E., and Wildes, D. G., 1988, Tool break detection by monitoring
ultrasonic vibrations, Annals of the CIRP, 37, 1, 61–64.
37. Lan, M. and Naerheim, Y., 1986, In-process detection of tool breakage in milling, ASME Journal
of Engineering for Industry, 108, August, 191–197.
38. Altintas, Y., Yellowley, I., and Tlusty, J., 1988, The detection of tool breakage in milling operations,
ASME Journal of Engineering for Industry, 110, 3, 271–277.
39. Sata, T., Matsushima, K., Nagakura, T., and Kono, E., 1973, Learning and recognition of the
cutting states by the spectrum analysis, Annals of the CIRP, 22, 41–42.
40. Danai, K. and Chin, H., 1991, Fault diagnosis with process uncertainty, ASME Journal of Dynamic
Systems, Measurement and Control, 113, 3, 339–343.
41. Colgan, J., Chin, H., Danai, K., and Hayashi, S., 1994, Tool breakage detection in turning: a multi-
sensor method, ASME Journal of Engineering for Industry, 116, 1, 117–123.
42. Tansel, I. N. and McLaughlin, C., 1991, On-line monitoring of tool breakage with unsupervised
neural networks, Transactions of NAMRC, SME, 364–370.
43. Jammu, V. B. and Danai, K., 1993, Unsupervised neural network for tool breakage detection in
turning, Annals of the CIRP, 42, 1, 67–70.
44. Delio, T., Tlusty, J., and Smith, S., 1992, Use of audio signals for chatter detection and control,
ASME Journal for Manufacturing Scientists and Engineers, 119, 146–157.
45. Schofield, S. and Wright, P., 1998, Open architecture controllers for machine tools, Part 1: Design
principles, ASME Journal for Manufacturing Scientists and Engineers, 120, 417–424.
46. Koren, Y., 1997, Control of machine tools, ASME Journal for Manufacturing Scientists and
Engineers, 119, 749–755.
47. Masory, O. and Koren, Y., 1985, Stability analysis of a constant force adaptive control system for
turning, ASME Journal of Engineering for Industry, 107, 1, 295–300.
48. Daneshmend, L. K. and Pak, H. A., 1986, Model reference adaptive control of feed force in turning,
ASME Journal of Dynamic Systems, Measurement, and Control, 108, 1, 215–222.
49. Lauderbaugh, L. K. and Ulsoy, A. G., 1988, Dynamic modeling for control of the milling process,
ASME Journal of Engineering for Industry, 110, 4, 367–375.
50. Tomizuka, M. and Zhang, S., 1988, Modeling and conventional adaptive PI control of a lathe
cutting process, ASME Journal of Dynamic Systems, Measurement, and Control, 110, December,
350–354.
51. Rober, S. J. and Shin, Y. C., 1996, Control of cutting force for end milling processes using an
extended model reference adaptive control scheme, ASME Journal for Manufacturing Scientists
and Engineers, 118, 339–347.
52. Hsu, P L. and Fann, W R., 1996, Fuzzy adaptive control of machining processes with a self-
learning algorithm, ASME Journal for Manufacturing Scientists and Engineers, 118, 522–530.
53. Liang S. Y. and Perry, S. A., 1994, In-Process Compensation for Milling Cutter Runout via Chip
Load Manipulation, ASME Journal of Engineering for Industry, 116, 153–160.
54. Furness, R. J., Ulsoy, A. G., and Wu, C. L., 1996, Feed, speed, and torque controllers for drilling,
ASME Journal for Manufacturing Scientists and Engineers, 118, 2–9.
55. Nachtigal, C. L. and Cook, N. H., 1970, Active control of machine-tool chatter, ASME Journal of
Basic Engineering, 92, 2, 238–244.
56. Mitchell, E. E. and Harrison, E., 1977, Design of a hardware observer for active machine tool
control, ASME Journal of Dynamic Systems, Measurement, and Control, 99, 227–232.
8596Ch05Frame Page 83 Tuesday, November 6, 2001 10:19 PM
© 2002 by CRC Press LLC
57. Subramanian, T. L., DeVries, M. F., and Wu, S. M., 1976, An investigation of computer control
of machining chatter, ASME Journal of Engineering for Industry, 98, 1209–1214.
58. Li, C. J. and Li, S. Y., 1992, On-line roundness error compensation via P-integrator learning
control, ASME Journal of Engineering for Industry, 114, 476–480.
59. Tsao, T C. and Tomizuka, M., 1987, Adaptive zero phase error tracking algorithm for digital
control, ASME Journal Dynamic Systems, Measurement, and Control, 109, 349–354.
60. Tung, E. D., Tomizuka, M., and Urushisaki, Y., 1996, High-speed end milling using a feedforward
control architecture, ASME Journal for Manufacturing Scientists and Engineers, 118, 178–187.
61. Ermer, D. S., 1997, A century of optimizing machining operations, ASME Journal for Manufac-
turing Scientists and Engineers, 119, 817–822.
62. Centner, R., 1964, Final report on development of adaptive control technique for numerically
controlled milling machining, USAF Tech. Documentary Report ML-TDR-64-279.
63. Amitay, G., Malkin S., and Koren, Y., 1981, Adaptive control optimization of grinding, ASME
Journal of Engineering for Industry, 103, 1, 102–111.
64. Koren, Y., 1989, The optimal locus approach with machining applications, ASME Journal of
Dynamic Systems, Measurement, and Control, 111, 1, 260–267.
65. Furness, R. J., Ulsoy, A. G., and Wu, C. L., 1996, Supervisory control of drilling, ASME Journal
for Manufacturing Scientists and Engineers, 118, 10–19.
66. Xiao, G., Malkin S., and Danai, K., 1993, Autonomous system for multistage cylindrical grinding,
ASME Journal of Dynamic Systems, Measurement, and Control, 115, 4, 667–672.
67. Ivester, R. W. and Danai, K., 1996, Intelligent control of machining under modeling uncertainty,
CIRP Manufacturing Systems, 25, 1, 73–79.
68. Ivester, R., Danai, K., and Malkin, S., 1997, Cycle time reduction in machining by recursive
constraint bounding, ASME Journal for Manufacturing Scientists and Engineers, 119, 2, 201–207.
69. Ko, T. J. and Cho, D. W., 1998, Adaptive optimization of face milling operations using neural
networks, ASME Journal for Manufacturing Scientists and Engineers, 120, 443–451.
70. Azouzi, R. and Guillot, M., 1998, On-line optimization of the turning process using an inverse
process neurocontroller, ASME Journal for Manufacturing Scientists and Engineers, 120, 101–108.
8596Ch05Frame Page 84 Tuesday, November 6, 2001 10:19 PM
© 2002 by CRC Press LLC
6
Process Monitoring and
Control of
Machining Operations
6.1 Introduction
6.2 Force/Torque/Power Generation
Cutting Force Models • Force/Torque/Power
Monitoring • Force/Torque/Power Control
6.3 Forced Vibrations and Regenerative Chatter
Regenerative Chatter Detection • Regenerative Chatter
Suppression
6.4 Tool Condition Monitoring and Control
Tool Failure • Tool Wear
6.5 Other Process Phenomena
Burr Formation • Chip Formation • Cutting Temperature
Generation
6.6 Future Direction and Efforts
6.1 Introduction
Machining operations (e.g., drilling, milling) are shape transformation processes in which metal is
removed from a stock of material to produce a part. The objective of these operations is to produce
parts with specified quality as productively as possible. Many phenomena that are detrimental to
this objective occur naturally in machining operations. In this chapter, we present techniques for
monitoring and controlling the process phenomena that arise due to the interaction of the cutting
tool and the workpiece (e.g., force generation, chatter, tool failure, chip formation).
Process monitoring is the manipulation of sensor measurements (e.g., force, vision, temperature)
to determine the state of the processes. The machine tool operator routinely performs monitoring
tasks; for example, visually detecting missing and broken tools and detecting chatter from the
characteristic sound it generates. Unmanned monitoring algorithms utilize filtered sensor measure-
ments that, along with operator inputs, determine the process state (Figure 6.1). The state of complex
processes is monitored by sophisticated signal processing of sensor measurements that typically
involve thresholding or artificial intelligence (AI) techniques.
1
For more information on sensors for
process monitoring, the reader is referred to References 2 and 3.
Process control is the manipulation of process variables (e.g., feed, speed, depth-of-cut) to
regulate the processes. Machine tool operators perform on-line and off-line process control by
adjusting feeds and speeds to suppress chatter, initiate an emergency stop in response to a tool
breakage event, rewrite a part program to increase the depth-of-cut to minimize burr formation,
etc. Off-line process control is performed at the process planning stage; typically by selecting
Robert G. Landers
University of Missouri at Rolla
A. Galip Ulsoy
University of Michigan
Richard J. Furness
Ford Motor Company
8596Ch06Frame Page 85 Tuesday, November 6, 2001 10:18 PM
© 2002 by CRC Press LLC
process variables from a machining handbook or the operator’s experience. Computer-aided process
planning
4
is a more sophisticated technique which, in some cases, utilizes process models off-line
to select process variables. The drawbacks of off-line planning are dependence on model accuracy
and the inability to reject disturbances. Adaptive control techniques,
5
which include adaptive control
with optimization, adaptive control with constraints, and geometric adaptive control, view processes
as constraints and set process variables to meet productivity or quality requirements. A significant
amount of research in AI techniques such as fuzzy logic, neural networks, knowledge base, etc.
which require very little process information has also been conducted.
6
This chapter concentrates on model-based process control techniques. A block diagram of a
typical process feedback control system is shown in Figure 6.1. A process reference, set from
productivity and quality considerations, and the process state are fed to the controller that adjusts
the desired process variables. These references are input to the servo controllers that drive the servo
systems (e.g., slides and spindles) that produce the actual process variables. Sensor measurements
of the process are then filtered and input to the monitoring algorithms.
The trend toward making products with greater quality faster and cheaper has lead manufacturers
to investigate innovative solutions such as process monitoring and control technology. Figure 6.2
shows the results of one study that clearly illustrates the benefits of process monitoring and control.
A trend toward more frequent product changes has driven research in the area of reconfigurable
machining systems.
7
Process monitoring technology will be critical to the cost-effective ramp-up
of these systems, while process control will provide options to the designer who reconfigures the
machining system. While process control has not made significant headway in industry, currently
companies exist that specialize in developing process monitoring packages. Process monitoring
and control technology will have a greater impact in future machining systems based on open-
architecture systems
8
that provide the software platform necessary for the cost-effective integration
of this technology.
The rest of the chapter is divided into six sections. The following three sections discuss
force/torque/power generation, forced vibrations and regenerative chatter, and tool condition mon-
itoring and control, respectively. The next section discusses burr and chip formation and cutting
temperatures. These discussions focus on the development of models for, and the design of, process
monitoring and control techniques. The last section provides future research directions. This chapter
is not intended to provide an exhaustive overview of research in process monitoring and control;
rather, relevant issues and major techniques are presented.
6.2 Force/Torque/Power Generation
The contact between the cutting tool and the workpiece generates significant forces. These forces
create torques on the spindle and drive motors, and these torques generate power that is drawn
from the motors. Excessive forces and torques cause tool failure, spindle stall (an event which is
typically detected by monitoring the spindle speed), undesired structural deflections, etc. The cutting
forces, torques, and power directly affect the other process phenomena; therefore, these quantities
FIGURE 6.1
Process feedback control system.
process
reference
Process
Controller
reference
process
variables
Servo
Systems
actual
process
variables
Machining
Process
raw sensor
measurements
Filtering
process
state
Monitoring
filtered sensor
measurements
operator
inputs
8596Ch06Frame Page 86 Tuesday, November 6, 2001 10:18 PM
© 2002 by CRC Press LLC
are often monitored as an indirect measurement of other process phenomena and are regulated so
that productivity is maximized while meeting machine tool and product quality constraints.
6.2.1 Cutting Force Models
A tremendous amount of effort has occurred in the area of cutting-force modeling over the past
several decades. However, these models tend to be quite complex and experimentation is required
to calibrate their parameters because an analytical model based on first principles is still not
available. The models used for controller design are typically simple; however, the models used
for simulation purposes are more complex and incorporate effects such as tooth and spindle runout,
structural vibrations and their impact on the instantaneous feed, the effect of the cutting tool leaving
the workpiece due to vibrations, intermittent cutting, tool geometry, etc. Two models that relate the
actual process variables to the cutting force and are suitable for force control design are given below.
The structure of the static cutting force is
(6.1)
where
F
is the cutting force,
K
is the gain,
d
is the depth-of-cut,
V
is the cutting speed,
f
is the
feed, and
α
,
β
, and
γ
are coefficients describing the nonlinear relationships between the force and
the process variables. The model parameters in Equation (6.1) depend on the workpiece and cutting
tool materials, coolant, etc. and must be calibrated for each different operation. Static models are
used when considering a maximum or average force
per spindle revolution.
Such models are suitable
for interrupted operations (e.g., milling) where, in general, the chip load changes throughout the
spindle revolution and the number of teeth engaged in the workpiece constantly changes during
steady operation (see Figure 6.3).
The structure of the first-order cutting force, assuming a zero-order hold equivalent, is
(6.2)
FIGURE 6.2
Machining cost comparison of adaptive and nonadaptive machining operations. (From Koren, Y.
Computer Control of Manufacturing Systems,
McGraw Hill, New York, 1983. With permission.)
FKdVf=
β
γ
α
FKdV
a
za
f=
+
+
β
γ
α
1
8596Ch06Frame Page 87 Tuesday, November 6, 2001 10:18 PM
© 2002 by CRC Press LLC
where
a
is the discrete-time pole which depends upon the time constant and the sample period,
and
z
is the discrete-time forward shift operator. The time constant, in turn, is sensitive to the
spindle speed because a full chip load is developed in approximately one tool revolution.
9
In addition
to the other model parameters,
a
must be calibrated for each different operation. First-order models
are typically employed when considering an instantaneous force that is sampled several times per
spindle revolution. Such models are suitable for uninterrupted operations (e.g., turning) where,
typically, a single tool is continuously engaged with the workpiece and the chip load remains
constant during steady operation.
6.2.2 Force/Torque/Power Monitoring
Load cells are often attached to the machine structure to measure cutting forces. Expensive dyna-
mometers are often used in laboratory settings for precise measurements; however, they are imprac-
tical for industrial applications. Forces in milling operations were predicted from the current of the
feed axis drive.
10
This technique is only applicable if the tooth-passing frequency is lower than the
servo bandwidth and the friction forces are low or can be accounted for accurately. Torque is
typically monitored on the spindle unit(s) with strain gauge devices. Again, expensive dynamom-
eters may be used, but are cost prohibitive in industrial applications. Power from the spindle and
axis motors is typically monitored using Hall-effect sensors. These sensors may be located in the
electrical cabinet making them easy to install and guard from the process. Due to the large masses
these motors drive, the signal typically has a small bandwidth.
6.2.3 Force/Torque/Power Control
Although the three major process variables (i.e.,
f
,
d
, and
V
) affect the cutting forces, the feed is
typically selected as the variable to adjust for regulation. Typically, the depth-of-cut is fixed from
the part geometry and the force–speed relationship is weak (i.e.,
γ
≈
0); therefore, these variables
are not actively adjusted for force control. References are set in roughing passes to maximize
productivity, while references are set in finishing passes to maximize quality. References in roughing
passes are due to such constraints as tool failure and maximum spindle power, and references in
finishing passes are due to such constraints as surface finish and tool deflections (which lead to
inaccuracies in the workpiece geometry).
Most force control technology is based on adaptive techniques;
11
however, model-based tech-
niques have recently been gaining attention.
12
Adaptive techniques consider a linear relationship
between the force and the feed and view changes in process variables and other process phenomena
FIGURE 6.3
Simulated cutting force response for an interrupted face milling operation (four teeth, entry and exit
angles of –/+ 27
o
). (From: Landers, R.G., Supervisory Machining Control: A Design Approach Plus Force Control
and Chatter Analysis Components, Ph.D. dissertation, University of Michigan, Ann Arbor, 1997.)
0
200
400
600
0 90 180 270 360
tooth angle (deg)
force (N)
8596Ch06Frame Page 88 Tuesday, November 6, 2001 10:18 PM
© 2002 by CRC Press LLC
as changes in the cutting-force parameters. Model-based techniques directly incorporate the non-
linear model and the effects of other process phenomena must be estimated. Robust control
techniques
13
have also gained recent attention. These techniques incorporate the cutting-force model
and require bounds on the model’s parameters. Regardless of the control approach, saturation limits
must be set on the commanded feed. A lower saturation of zero is typical because a negative feed
will disengage the cutting tool from the workpiece; however, a nonzero lower bound may be set
due to process constraints. An upper bound is set due to process or machine tool servo constraints.
Two machining force controllers are designed and implemented next for the following static
cutting force
(6.3)
where
γ
= 0 and
F
is a maximum force per spindle revolution in a face milling operation. For
control design, the model is augmented with an integral state to ensure constant reference tracking
and constant disturbance rejection.
A model-based design is now applied.
12
The control variable is
u
=
f
0.63
and the design model
(with an integral state) is
(6.4)
where
θ
= 0.76
d
0.65
is the gain. Note that the nonlinear model-based controller utilizes process
information (in this case, depth-of-cut) to directly account for known process changes. The model
reference control (MRC) approach is applied and the control law is
(6.5)
where
F
r
is the reference force and
b
0
is calculated given a desired closed-loop time constant and
sample period. The commanded feed is calculated from the control variable as
(6.6)
Therefore, the lower saturation on the control variable is chosen to have a small non-negative
value. The experimental results for the nonlinear model-based controller are shown in Figure 6.4.
Next, an adaptive force controller is designed. The control design model, including an integral
state, is
(6.7)
where
θ
is the gain and is assumed to be unknown. The MRC approach is applied and the control
law is
(6.8)
The term is an estimate of the gain. In this example, the common recursive least squares
technique is employed.
14
At the
i
th
time iteration, the estimate is calculated as
Fdf= 076
065 063
.
Fz
z
uz
()
=
−
()
θ
1
1
uz
z
b
Fz Fz
r
()
=
−
+
()
−
()
[]
1
1
1
0
θ
f
u
=
()
exp
ln
.063
Fz
z
fz
()
=
−
()
θ
1
1
fz
z
b
Fz Fz
r
()
=
−
+
()
−
()
[]
1
1
1
0
ˆ
θ
ˆ
θ
8596Ch06Frame Page 89 Tuesday, November 6, 2001 10:18 PM
© 2002 by CRC Press LLC
(6.9)
where
(6.10)
(6.11)
(6.12)
The parameter
P
is known as the covariance and the parameter
ε
is known as the residual.
Estimating the model parameters on-line is a strong method of accounting for model inaccuracies;
however, the overall system becomes much more complex, and chaotic behavior may result.
The experimental results for the adaptive controller are shown in Figures 6.5 and 6.6. Both
approaches successfully regulate the cutting force while accounting for process changes in very
different ways. The adaptive technique is useful when an accurate model is not available, but is
more complex compared to the model-based approach.
6.3 Forced Vibrations and Regenerative Chatter
The forces generated when the tool and workpiece come into contact produce significant structural
deflections. Regenerative chatter is the result of the unstable interaction between the cutting forces
and the machine tool–workpiece structures, and may result in excessive forces and tool wear, tool
failure, and scrap parts due to unacceptable surface finish.
The feed force for an orthogonal cutting process (e.g., turning thin-walled tubes) is typically
described as
(6.13)
FIGURE 6.4
Force response, nonlinear model-based force controller.
(From Landers, R.G., Supervisory Machining
Control: A Design Approach Plus Force Control and Chatter Analysis Components, Ph.D. dissertation, University
of Michigan, Ann Arbor, 1997.)
0.0
0.2
0.4
0.6
036912
time (s)
force (kN)
F
r
(t) = 0.35 kN
F(t)
depth
increase
ˆˆ
θθ εii Kii
()
=−
()
+
()()
1
Ki
Pi f i
fiPi fi
()
=
−
()()
+
()
−
()()
[]
1
11
Pi Ki f i Pi
()
=−
() ()
[]
−
()
11
εθiFifii
()
=
()
−
()
−
()
ˆ
1
F t Kd f x t x t
n
()
=+
()
−−
()
[]
τ
8596Ch06Frame Page 90 Tuesday, November 6, 2001 10:18 PM
© 2002 by CRC Press LLC
where
f
n
is the nominal feed,
x
is the displacement of the tool in the feed direction, and
τ
is the
time for one tool revolution. The assumption is that the workpiece is much more rigid than the
tool, and the force is proportional to the instantaneous feed and the depth-of-cut and does not
explicitly depend upon the cutting speed. The instantaneous chip load is a function of the nominal
feed, the current tool displacement, and the tool displacement at the previous tool revolution.
Assuming a simple model, the vibration of the tool structure may be described by
(6.14)
where
m
,
c
, and
k
are the effective mass, damping, and stiffness, respectively, of the tool structure.
The stability of the closed-loop system formed by equations combining (6.13) and (6.14) may be
examined to generate the so-called stability lobe diagram (Figure 6.7) and select appropriate process
variables.
Another cause of unacceptable structural deflections, known as forced vibrations, arises when
an input frequency (e.g., tooth-passing frequency) is close to a resonant structural frequency. The
resulting large relative deflections between the cutting tool and workpiece lead to inaccuracies in
FIGURE 6.5
Force response, an adaptive force controller. (From Landers, R.G., Supervisory Machining Control:
A Design Approach Plus Force Control and Chatter Analysis Components, Ph.D. dissertation, University of Michigan,
Ann Arbor, 1997.)
FIGURE 6.6
Force model gain estimate, an adaptive force controller. (From Landers, R.G., Supervisory Machining
Control: A Design Approach Plus Force Control and Chatter Analysis Components, Ph.D. dissertation, University
of Michigan, Ann Arbor, 1997.)
0.0
0.2
0.4
0.6
036912
time (s)
force (kN)
depth
increase
F
r
(t) = 0.35 kN
F(t)
0
1
2
3
4
036912
time (s)
ˆ
θ kN/mm
2
()
mx t cx t kx t F t
˙˙ ˙
()
+
()
+
()
=
()
8596Ch06Frame Page 91 Tuesday, November 6, 2001 10:18 PM
© 2002 by CRC Press LLC
92
Manufacturing
the workpiece geometry. An example of forced vibrations may be found in Reference 15. When
the tooth-passing frequency is close to a dominant structural frequency, productivity may be
increased (see Figure 6.7); however, forced vibrations will occur. Therefore, the designer must
make a trade-off between controlling regenerative chatter and inducing forced vibrations
In this section, common techniques for on-line chatter detection and suppression are presented.
6.3.1 Regenerative Chatter Detection
Regenerative chatter is easily detected by an operator because of the loud, high-pitched noise it
produces and the distinctive “chatter marks” it leaves on the workpiece surface. However, automatic
detection is much more complicated. The most common approach is to threshold the spectral density
of a process signal such as sound,
16
force,
17
etc. An example in which the force signal is utilized
for chatter detection (see Figure 6.8) demonstrates that chatter frequency occurs near a dominant
structural frequency. Note that the tooth-passing frequency contains significant energy. In this
application, the lower frequencies may be ignored by the chatter detection algorithm; however, if
the operation is performed at a higher spindle speed, the force signal has to be filtered at the tooth-
passing frequency. Also, the impact between the cutting tool and workpiece will cause structural
vibrations that must not be allowed to falsely trigger the chatter detection algorithm.
These thresholding algorithms all suffer from the lack of an analytical method to select the
threshold value. This value is typically selected empirically and will not be valid over a wide range
of cutting conditions. A more general signal was proposed by Bailey et al.
18
An accelerometer
signal mounted on the machine tool structure close to the cutting region was processed to calculate
the so-called variance ratio
(6.15)
where
σ
s
and
σ
n
are the variances of the accelerometer signal in low and high frequency ranges,
respectfully. A value of
R
<< 1 indicates chatter.
6.3.2 Regenerative Chatter Suppression
Chatter is typically suppressed by adjusting the spindle speed to lie in one of the stability lobe
pockets, as shown in Figure 6.7.
19
Feed has been shown to have a monotonic effect on the marginally
stable depth-of-cut (see Figure 6.9) and is sometimes the variable of choice by machine tool
FIGURE 6.7
Stability lobe diagram. The tool structure’s natural frequency is 12,633 Hz. Operating point (d =
5 mm, N
s
= 7500 rpm) denoted by dark circle is used in the simulations in Figures 6.10 and 6.11.
0
10
20
30
40
0 10000 20000 30000
spindle speed (rpm)
Stability
Borderline
Asymptotic
Stability
Borderline
increased depth
possible due to
process dampin
g
increased
depth possible
at certain
depth-of-cut (mm)
R
s
n
=
σ
σ
2
2
8596Ch06Frame Page 92 Tuesday, November 6, 2001 10:18 PM
© 2002 by CRC Press LLC
operators.
20
The tool position may also be adjusted (e.g., depth-of-cut decreased) to suppress chatter,
and while it is guaranteed to work (see Figure 6.7), this approach is typically not employed because
the part program must be rewritten and productivity is drastically decreased.
Spindle speed variation (SSV) is another technique for chatter suppression.
15
The spindle speed
is varied about some nominal value, typically in a sinusoidal manner. Figures 6.10 and 6.11
demonstrate how varying the spindle speed sinusoidally with an amplitude of 50% of the nominal
value and at a frequency of 6.25 Hz will suppress chatter that occurs when a constant spindle speed
at the nominal value is utilized (see Figure 6.7). Although SSV is a promising technique, little
theory exists to guide the designer to the optimal variation and, in some cases, SSV may create
chatter which will not occur when using a constant spindle speed. Further, it can be seen in
Figure 6.11b that SSV will cause force fluctuations even though the chatter is suppressed.
FIGURE 6.8
Power spectrum of force signal during chatter. (From Landers, R.G., Supervisory Machining Control:
A Design Approach Plus Force Control and Chatter Analysis Components, Ph.D. dissertation, University of Michigan,
Ann Arbor, 1997.)
FIGURE 6.9
Theoretical prediction (solid line) vs. experimental data (circles) demonstrating the feed effect on
chatter. (From Landers, R.G., Supervisory Machining Control: A Design Approach Plus Force Control and Chatter
Analysis Components, Ph.D. dissertation, University of Michigan, Ann Arbor, 1997.)
0
250
500
750
1000
0 250 500 750 1000
frequency (Hz)
power spectral density (N
2
)
chatter frequency
748 Hz
tooth passing
frequency
101 Hz
workpiece ω
n
(x direction)
414 Hz
machine tool ω
n
(y direction)
653 Hz
machine tool ω
n
(x direction)
716 Hz
workpiece ω
n
(y direction)
334 Hz
0.5
1.0
1.5
0.04 0.08 0.12 0.16
feed (mm/tooth
)
depth-of-cut (mm)
8596Ch06Frame Page 93 Tuesday, November 6, 2001 10:18 PM
© 2002 by CRC Press LLC