Báo cáo hóa học: " Elastic Properties of 4–6 nm-thick Glassy Carbon Thin Films" pot
Bạn đang xem bản rút gọn của tài liệu. Xem và tải ngay bản đầy đủ của tài liệu tại đây (334.24 KB, 6 trang )
NANO EXPRESS
Elastic Properties of 4–6 nm-thick Glassy Carbon Thin Films
M. P. Manoharan Æ H. Lee Æ R. Rajagopalan Æ
H. C. Foley Æ M. A. Haque
Received: 28 May 2009 / Accepted: 2 September 2009 /Published online: 23 September 2009
Ó to the authors 2009
Abstract Glassy carbon is a disordered, nanoporous form
of carbon with superior thermal and chemical stability in
extreme environments. Freestanding glassy carbon speci-
mens with 4–6 nm thickness and 0.5 nm average pore size
were synthesized and fabricated from polyfurfuryl alcohol
precursors. Elastic properties of the specimens were mea-
sured in situ inside a scanning electron microscope using a
custom-built micro-electro-mechanical system. The Young’s
modulus, fracture stress and strain values were measured
to be about 62 GPa, 870 MPa and 1.3%, respectively;
showing strong size effects compared to a modulus value
of 30 GPa at the bulk scale. This size effect is explained on
the basis of the increased significance of surface elastic
properties at the nanometer length-scale.
Keywords Young’s modulus Á Glassy carbon Á
Thin film Á Size effect
Introduction
Nanoporous glassy carbon derived from pyrolysis of the
polymer precursor polyfurfuryl alcohol (PFA) is a
non-graphitizing carbon [1] that can act as a molecular
sieve and has potential applications in catalysis [2] and air
separation [3]. Bulk glassy carbon has been commercially
used as an electrode material for over half a century due
to its excellent thermal stability and resistance to chemi-
cal attacks. These properties also make it more suitable
than zeolite molecular sieves for applications such as
catalyst supports and as selective adsorbents in high
temperature [4] and corrosive environments [1]. Its ther-
mal stability has led researchers to suggest it as a possible
material for capture and sequestration of carbon dioxide
from industrial processes [5]. Its good electrical conduc-
tivity lends to applications in microbatteries where
micromachined structures of glassy carbon are used as
electrodes [6]. Pyrolysis of PFA results in a highly dis-
ordered structure, giving rise to porosity, with a pore
width in the range of 0.4–0.5 nm [7]. The resultant
material has regions of crystalline order, which are typi-
cally of short range and on a global scale it can best be
described as amorphous. The disorder also causes the
material to be non-graphitizing and resists transformation
to long-range graphitic structures even at temperatures as
high as 2,000 °C[1]. Such non-graphitic nature of PFA-
derived glassy carbon has been attributed to the exten-
sively cross-linked structure of the polymer precursor,
which results in a kinetically frozen disorder due to a
chaotic misalignment of defective graphene sheets [8]
upon pyrolysis.
Due to their unique application potentials, the thermo-
physical properties of glassy carbon have been extensively
studied in the literature but only in their bulk form [9–11].
However, nanoporous glassy carbon can also be synthe-
sized in the form of thin films with few nanometers
thickness by choosing an appropriate concentration of the
polymer precursor (PFA). Such ultrathin films are expected
M. P. Manoharan Á M. A. Haque (&)
Department of Mechanical & Nuclear Engineering,
The Pennsylvania State University, University Park,
PA 16802, USA
e-mail:
H. Lee Á R. Rajagopalan
Materials Research Institute, The Pennsylvania State University,
University Park, PA 16802, USA
H. C. Foley
Department of Chemical Engineering, The Pennsylvania State
University, University Park, PA 16802, USA
123
Nanoscale Res Lett (2010) 5:14–19
DOI 10.1007/s11671-009-9435-2
to exhibit pronounced size effects on their physical prop-
erties, yet only a few studies are available for micro [12]
and nanoscale [13] glassy carbon structures, with the
smallest size around 150 nm. This is because at the 1–5 nm
length-scales, even specimen fabrication, manipulation,
gripping and alignment required to achieve the desired
boundary conditions for mechanical testing are challeng-
ing, not to mention the stringent resolution requirement on
force and displacement application and measurement.
While no such study exists for glassy carbon at this length-
scale, the literature contains a few investigations on the
mechanical properties of single [14] and multilayer [15]
graphitic carbon (graphene) films. These studies use nano-
indentation and atomic force microscope (AFM) tip-based
three-point bending, respectively. Both these techniques
are popular tools used by researchers to measure the
Young’s modulus of nanoscale materials. However, nano-
indentation on such ultrathin specimens requires complex
data de-convolution [16–18]. It also introduces highly
localized deformation that may not be representative of the
entire specimen [19]. AFM tip-based three-point bending
requires an extensive understanding of the tip-thin film
interaction for accurate and reliable experimental studies.
For example, friction (due to slipping) and van der Waals
forces between the thin film and tip will introduce errors in
measurement of mechanical properties. The influence of
these surface forces on the mechanical properties have
been shown to be very significant in case of small diameter
nanowires (\30–40 nm) [20] and can be expected to have
the same effects while measuring the elastic properties of
ultrathin films. Also, in the above experiments a fixed–
fixed beam boundary condition was assumed, even though
only van der Waal’s forces were used to provide the
gripping on the substrate.
Experimental Setup
In this study, we use uniaxial tensile testing to measure the
elastic properties of a material under uniform deformation.
The technique is relatively straightforward as no assump-
tions or complicated models are needed to measure the
Young’s modulus, fracture stress and strain. We designed
and fabricated a micro-electro-mechanical device to apply
uniaxial tensile stresses on the freestanding thin film
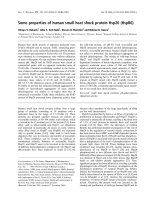
specimen. Figure 1a shows the device design, where the
specimen is mounted between a flexure beam force sensor
and a set of 1°-inclined thermal actuator beams. The beams
are micromachined from heavily doped (0.001–0.005 X-cm)
silicon-on-insulator wafers. The thermal actuator beams
expand due to Joule heating upon application of a DC
voltage, which loads both the specimen and the force
sensing beam. The force on the specimen can be obtained
from the force equilibrium diagram shown in Fig. 1b. For
example, if the stiffness values of the force sensor and the
specimen are k
fs
and k
sp
, respectively, then the elongation
and force in the specimen are given by,
d
specimen
¼ d
1
À d
2
; F
specimen
¼ k
fs
d
2
¼
24j
L
3
fs
!
d
2
ð1Þ
where d
1
and d
2
are displacements in the thermal actuator
and force sensing beams, respectively, and j is the in-plane
Fig. 1 a Schematic of the nanoscale uniaxial tensile testing device showing the thermal actuator and the integrated force and displacement
sensing beams (not to scale). b Force equilibrium spring equivalent of the specimen-device system. c SEM image of the device
Nanoscale Res Lett (2010) 5:14–19 15
123
flexural rigidity of the force sensing beam. The devices are
first patterned using photolithography and then the silicon
device layer is etched vertically with deep reactive ion
etching. The microbeams are then released from the handle
layer using hydro-fluoric acid vapor etching. Figure 1c
shows scanning electron microscope (SEM) image of a
fabricated device.
To achieve greater control over the length of the specimen
that can be tested, specimens are fabricated separately from
the device. The 4–6 nm-thick glassy carbon specimens used
in this study were synthesized by pyrolyzing PFA precursor
at 800 ° C on a silicon substrate coated with a 500 nm-thick
thermally grown silicon dioxide layer. Details of the syn-
thesis and thickness characterization are given elsewhere [1,
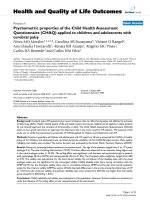
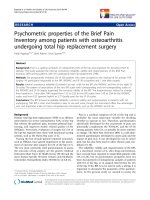
8, 21]. We measured the Raman spectrum for a 5 nm-thick
freestanding glassy carbon film to verify the structural
characteristics of the carbon film. Figure 2 shows the
experimental results, where the prominent peaks in the
spectrum are the G peak at 1,580 cm
-1
and D peak at
1,350 cm
-1
, which confirms the formation of polyaromatic
domains. In polyaromatic structures, the G peak represents
the Raman-active E
2g
in-plane vibration mode and the
presence of disorder in the structure is indicated by the D
peak, which represents the A
1g
in-plane breathing mode [21].
The ratio of the intensity of these peaks, ID/IG, is called the
relative peak intensity ratio and can be correlated to the
reciprocal of the crystalline size along the basal plane, L
a
,
which was measured to be 7.5 nm.
Tensile specimens, 100 microns long and 10 microns
wide, were patterned using photolithography. The glassy
carbon layer was then etched by oxygen plasma, which
exposed the thermal oxide underneath. The oxide was then
anisotropically etched with reactive ion etching. Next, the
silicon substrate was isotropically etched using xenon
difluoride, resulting in freestanding bilayer beams of glassy
carbon and oxide. An Omniprobe
Ò
nanomanipulator inside
a dual gun focused ion beam—electron microscope with
ion milling and platinum deposition capabilities is used to
transfer and mount the bilayer on to the custom-designed
micro-electro-mechanical tensile testing device. Hydro-
fluoric acid vapor etching was then used to remove the
supporting silica layer, resulting in a freestanding ultrathin
glassy carbon thin film securely attached to the device.
Experimental Results
Upon integration of the specimen, the device is wire bon-
ded and placed inside the SEM with electrical feed-through
for in situ testing inside the chamber. The specimens were
loaded quasi-statically by applying a DC voltage across the
thermal actuator beams. The device is equipped with sen-
sors measuring displacements of the thermal actuator and
the force sensing beams (d
1
and d
2
, respectively, as shown
in Fig. 1b). In each step of the voltage increment, these
displacements were measured to obtain the force and
elongation in the specimen using Eq. (1). The applied
voltage was increased in small steps until the film frac-
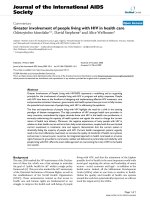
tured. Figure 3a shows the specimen mounted on the two
mechanical jaws, bridging the thermal actuator and the
force sensor beams. Figure 3b shows the specimen slightly
curling up due to energy release after a brittle mode frac-
ture. In situ testing in the SEM not only provides direct
visual observation of the deformation in the specimen and
more importantly at the specimen grips, but also enhances
the resolution of the quantitative study. For example, SEM
allows the thermal actuator and force sensor beam dis-
placements to be measured with 50-nm resolution, which
Fig. 2 a Raman spectra and b transmission electron micrograph for the freestanding glassy carbon film (scale bar is 20 nm)
16 Nanoscale Res Lett (2010) 5:14–19
123
results in 0.05% strain resolution for the 100 micron long
specimens used in this study. The force resolution of the
device would depend on the stiffness of the force sensing
beam; for example, a beam 250 microns long (L
fs
), 2 microns
wide and 10 microns deep has a stiffness of 1.75 N/m, which
results in 85 nN force and 1.75 MPa stress resolution for a
nominally 5 nm-thick specimen. The stiffness of the force
sensing beams is measured with a commercially calibrated
spring structure, with the details described in [22]. The in situ
SEM observations also enhance the consistency and
repeatability of the experiments, and the maximum deviation
of the data (from the spread of 5 experiments) is about 10%
from the mean trend-line.
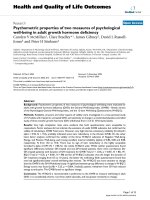
Figure 4 shows a representative stress–strain data for a
5 nm-thick freestanding glassy carbon specimen. The
fracture mode is brittle and none of the specimens showed
any sign of plasticity or necking. Also, none of the speci-
mens showed slippage at the grips, hence no grip compli-
ance correction was needed. The average Young’s modulus
for the five specimens was measured to be about 62 GPa,
and the average tensile strength and strain values are
870 MPa and 1.3%, respectively. The corresponding values
for bulk glassy carbon are about 30 GPa [23], 0.5–0.7%
and 240 MPa, respectively [24], which show significant
size effect on the stress-bearing capability of the material at
the nanoscale, even though conventional elasticity theory is
size independent. It is important to note that the oxide
substrate does not influence the structure of the glassy
carbon during the synthesis process [25].
Size Effect on Young’s Modulus
We propose that the observed size effect can be explained
by taking into consideration the effect of surface elastic
properties on the mechanical properties of materials.
Atoms at the surface have a lower coordination number
(i.e. fewer neighboring atoms) than bulk atoms. Conse-
quently, the nature of the chemical bond and the equilib-
rium interatomic distances are different at the surface
compared to the bulk. This difference leads to surface
stresses and surface energy [26], and therefore different
mechanical properties for the surface and bulk material. As
the length-scale of the material under study is reduced, the
proportion of surface atoms to that of the bulk increases;
and at the nanoscale, this ratio is large enough for surface
properties to significantly affect the overall properties of
the material. This surface effect can be accounted for by
introducing the concept of surface elastic constant [27],
S (units of N/m), which is a measure of the variation of
surface stress (s) with strain (e). This can be expressed as
[27, 28].
s
ab
ðeÞ¼s
ab
ð0ÞþS
ab
e
b
; i:e: S
ab
¼
os
ab
oe
b
e
b
¼0
where a; b ¼ 1 À3 ð2Þ
At the nanoscale, the contributions from the surface
elastic properties (s
ab
and S
ab
) are significant and need to
Fig. 3 a SEM image of the
freestanding ultrathin glassy
carbon specimen mounted on
the test device before loading.
b The specimen after loading to
fracture (scale bar is 50 lm)
Fig. 4 Stress–strain diagram for a 5 nm-thick freestanding glassy
carbon film
Nanoscale Res Lett (2010) 5:14–19 17
123
be taken into account in addition to the bulk elastic
properties. For the case of tensile loading, this can be
expressed as [27]
E
nanoscale
¼ E
bulk
þ 4
S
ab
t
ð3Þ
where E
nanoscale
is the measured Young’s modulus, E
bulk
is
the modulus at the bulk scale and t is the critical size for the
material under study, in this case, t being the thickness of
the thin film. This equation illustrates the effect of length-
scale of the material on the measured modulus value.
However, glassy carbon is not crystalline as assumed in the
above equations, and there is no reported value for the
surface elastic constant for glassy carbon in the literature.
We can approximate the surface elastic constant as
S = E
bulk
9 r
0
, where r
0
is a characteristic length-scale
representative of the material structure. Since glassy carbon
does not have a long-range order in atomic arrangement, a
representative length-scale can be determined by consid-
ering the misalignment of the polyaromatic domains in
glassy carbon. It has been experimentally determined that
the coherence length (atomic pair distribution function) of
the domains in glassy carbon tapers off beyond a distance
of about 1.2 nm [29]. Using r
0
= 1.2 nm and E
bulk
= 30
GPa gives a surface elastic constant of 36 N/m and a
modulus value of 59 GPa, which is close to the experi-
mentally determined value of 62 GPa. Taking this con-
sideration, we have plotted the variation of the modulus
value for different values of S, using Eq. 3 (Fig. 5); the
Young’s modulus of glassy carbon at the bulk scale has
been taken as 30 GPa. For surface elastic constant,
S = 40 N/m, the modulus value (E
nanoscale
) is very close to
the experimentally obtained value of 62 GPa.
Conclusion
Glassy carbon is a nanoporous material that has superior
thermal and chemical stability, which are attractive for
applications in high temperature and corrosive environ-
ments. To study the effect of length-scale on the elastic
properties of glassy carbon, we have synthesized films
from PFA precursor pyrolized at 800 °C to obtain 4–6 nm-
thick specimens. Using nanofabrication techniques, we
integrated freestanding specimens with micro-electro-
mechanical device to test the specimens in situ inside a
SEM. The average values of the Young’s modulus, fracture
stress and strain of the thin film specimens were measured
to be 62 GPa, 870 MPa and 1.3%, respectively. The size
dependence of these elastic properties is explained with the
effect of surface stress at this extreme length-scale. Efforts
are currently being undertaken for in situ transmission
electron microscope (TEM) testing to obtain direct visual
evidence of any stress-based transformation.
Acknowledgments The authors gratefully acknowledge the Korea
Institute of Machinery & Materials and the National Science Foun-
dation, USA (ECS #0545683). The devices were fabricated at the
Pennsylvania State University Nanofabrication Facility under the
NSF Cooperative Agreement no. 0335765, National Nanotechnology
Infrastructure Network, with Cornell University.
References
1. C.L. Burket, R. Rajagopalan, H.C. Foley, Overcoming the barrier
to graphitization in a polymer-derived nanoporous carbon. Car-
bon 46, 501–510 (2008)
2. R. Rajagopalan, A. Ponnaiyan, P.J. Mankidy, A.W. Brooks,
B. Yi, H.C. Foley, Molecular sieving platinum nanoparticle cat-
alysts kinetically frozen in nanoporous carbon. Chem. Commun.
21, 2498–2499 (2004)
3. A. Merritt, R. Rajagopalan, H.C. Foley, High performance
nanoporous carbon membranes for air separation. Carbon 45,
1267–1278 (2007)
4. H.C. Foley, Carbogenic molecular sieves: Synthesis, properties
and applications. Microporous Mater. 4, 407–433 (1995)
5. C.J. Anderson, S.J. Pas, G. Arora, S.E. Kentish, A.J. Hill,
S.I. Sandler, G.W. Stevens, Effect of pyrolysis temperature and
operating temperature on the performance of nanoporous carbon
membranes. J. Membr. Sci. 322, 19–27 (2008)
6. R. Kostecki, X. Song, K. Kinoshita, Electrochemical analysis of
carbon interdigitated microelectrodes. Electrochem. Solid-State
Lett. 2, 465–467 (1999)
7. C.L. Burket, R. Rajagopalan, A.P. Marencic, K. Dronvajjala,
H.C. Foley, Genesis of porosity in polyfurfuryl alcohol derived
nanoporous carbon. Carbon 44, 2957–2963 (2006)
8. C.L. Burket, R. Rajagopalan, H.C. Foley, Synthesis of nanopor-
ous carbon with pre-graphitic domains. Carbon 45, 2307–2310
(2007)
9. W.V. Kotlensky, H.E. Martens, Tensile properties of glassy
carbon to 2900 °C. Nature 206, 1246–1247 (1965)
10. E. Fitzer, W. Scha
¨
fer, The effect of crosslinking on the formation
of glasslike carbons from thermosetting resins. Carbon 8, 353–
364 (1970)
Fig. 5 Effect of surface stresses on the Young’s modulus value
(based on Eq. 3); inset shows detailed view of the variation of
modulus values for film thickness up to 10 nm
18 Nanoscale Res Lett (2010) 5:14–19
123
11. J.X. Zhao, R.C. Bradt, P.L. Walker Jr, The fracture toughness of
glassy carbons at elevated temperatures. Carbon 23, 15–18 (1985)
12. O.J.A. Schueller, S.T. Brittain, C. Marzolin, G.M. Whitesides,
Fabrication and characterization of glassy carbon MEMS. Chem.
Mater. 9, 1399–1406 (1997)
13. B.A. Samuel, M.A. Haque, Y. Bo, R. Rajagopalan, H.C. Foley,
Mechanical testing of pyrolysed poly-furfuryl alcohol nanofibres.
Nanotechnology 18, 115704 (8 pp) (2007)
14. C. Lee, X. Wei, J.W. Kysar, J. Hone, Measurement of the Elastic
Properties and Intrinsic Strength of Monolayer Graphene. Science
321, 385–388 (2008)
15. I.W. Frank, D.M. Tanenbaum, A.M. van der Zande, P.L.
McEuen, Mechanical properties of suspended graphene sheets.
J. Vac. Sci. Technol. B 25, 2558–2561 (2007)
16. G.M. Pharr, A. Bolshakov, Understanding nanoindentation
unloading curves. J. Mater. Res. 17(10), 2660–2671 (2002)
17. M.R. VanLandingham, Review of instrumented indentation.
J. Res. Natl. Inst. Stand. Technol 108(4), 249–265 (2003)
18. G. Shafirstein et al., Error analysis in nanoindentation. Pro-
ceedings of the 1994 Fall Meeting of MRS, Nov 28-Dec 2 1994,
Boston, MA, USA: Materials Research Society, Pittsburgh, PA,
USA, 1995
19. T.W. Tombler, C. Zhou, L. Alexseyev, J. Kong, H. Dai, L. Liu,
C.S. Jayanthi, M. Tang, S Y. Wu, Reversible electromechanical
characteristics of carbon nanotubes under local-probe manipula-
tion. Nature 405, 769–772 (2000)
20. A.V. Desai, M.A. Haque, Sliding of zinc oxide nanowires on
silicon substrate. Appl. Phys. Lett. 90, 033102 (2007)
21. H. Lee, R. Rajagopalan, J. Robinson, C.G. Pantano, Processing
and characterization of ultrathin carbon coatings on glass. ACS
Appl. Mater. Interfaces 1(4), 927–933 (2009)
22. M.A. Haque, M.T.A. Saif, Application of MEMS force sensors
for in situ mechanical characterization of nano-scale thin films in
SEM and TEM. Sens. Actuators A 97–98, 239–245 (2002)
23. G.M. Jenkins, K. Kawamura, Polymeric carbons—carbon fibre,
glass and char (Cambridge University Press, Cambridge, 1976)
24. R.E. Bullock, J.L. Kaae, Size effect on the strength of glassy
carbon. J. Mater. Sci. 14, 920–930 (1979)
25. H. Lee, R. Rajagopalan, J. Robinson, C.G. Pantano, Processing
and characterization of ultrathin carbon coatings on glass. ACS
Appl. Mater. Interfaces 1, 927–933 (2009)
26. W. Haiss, Surface stress of clean and adsorbate-covered solids.
Rep. Prog. Phys. 64, 591–648 (2001)
27. R.E. Miller, V.B. Shenoy, Size-dependent elastic properties of
nanosized structural elements. Nanotechnology 11, 139–147
(2000)
28. V.B. Shenoy, Atomistic calculations of elastic properties of
metallic fcc crystal surfaces. Phys. Rev. B 71, 094104 (2005)
29. M.A. Smith, H.C. Foley, R.F. Lobo, A simple model describes
the PDF of a non-graphitizing carbon. Carbon 42, 2041–2048
(2004)
Nanoscale Res Lett (2010) 5:14–19 19
123