Bioluminescence Recent Advances in Oceanic Measurements and Laboratory Applications Part 7 ppt
Bạn đang xem bản rút gọn của tài liệu. Xem và tải ngay bản đầy đủ của tài liệu tại đây (331.7 KB, 15 trang )
4
Quantitative Assessment of Seven
Transmembrane Receptors (7TMRs)
Oligomerization by Bioluminescence
Resonance Energy Transfer (BRET) Technology
Valentina Kubale
1
,
Luka Drinovec
2
and Milka Vrecl
1
1
Institute of Anatomy, Histology & Embryology,
Veterinary Faculty of University in Ljubljana,
2
Aerosol d.o.o., Ljubljana,
Slovenia
1. Introduction
Seven transmembrane receptors (7TMRs; also designated as G-protein coupled receptors
(GPCRs)) form the largest and evolutionarily well conserved family of cell-surface receptors,
with more than 800 members identified in the human genome. 7TMRs are the targets both
for a plethora of endogenous ligands (e.g. peptides, glycoproteins, lipids, amino acids,
nucleotides, neurotransmitters, odorants, ions, and photons) and therapeutic drugs and
transduce extracellular stimuli into intracellular responses mainly via coupling to guanine
nucleotide binding proteins (G-proteins) (McGraw & Liggett, 2006).
These receptors have traditionally been viewed as monomeric entities and only more recent
biochemical and biophysical studies have changed this view. The idea that 7TMRs might
form dimers or higher order oligomeric complexes has been formulated more than 20 years
ago and since then intensively studied. In the last decade, bioluminescence resonance
energy transfer (BRET) was one of the most commonly used biophysical methods to study
7TMRs oligomerization. This technique enables monitoring physical interactions between
protein partners in living cells fused to donor and acceptor moieties. It relies on non-
radiative transfer of energy between donor and acceptor, their intermolecular distance (10 –
100 Å) and relative orientation. Over this period the method has progressed and several
versions of BRET have been developed that use different substrates and/or energy
donor/acceptor couples to improve stability and specificity of the BRET signal. This chapter
outlines BRET-based approaches to study 7TMRs oligomerization (e.g. BRET saturation and
competition assays), control experiments needed in the interpretation i.e. establishing
specificity of BRET results and mathematical models applied to quantitatively assess the
oligomerization state of studied receptors.
2. Seven transmembrane receptors (7TMRs): Structure and characteristics
Primary sequence comparisons reveal that 7TMRs share sequence and topology similarities
allowing them to be classified as a super-gene family. These receptors are characterized by
Bioluminescence – Recent Advances in Oceanic Measurements and Laboratory Applications
82
seven hydrophobic stretches of 20-25 amino acids, predicted to form transmembrane -helices.
Prediction of transmembrane folding was based largely on the method proposed by Kyte and
Doolitle (Kyte & Doolittle, 1982). This method plots the hydrophobicity of the amino acids
along the sequence, assigning each amino acids a hydrophobicity index. By summing this
index over a window of nine residues, the transmembrane sequence is postulated when index
reaches the value of 1.6 for a stretch of ~20 amino acids. This number is based on the
assumption that the membrane spanning sequences of protein are -helical and that about six
helical turns are required to span the lipid bilayer (Hucho & Tsetlin, 1996). The highly
hydrophobic -helices that serve as transmembrane spanning domains (TMs) are connected
by three extracellular (ECL) and three intracellular (ICL) hydrophilic loops. Amino (N)-
terminal fragment is extracellular and the carboxyl (C)-terminal tail is intracellular. In the
recent years this common structural topology was also confirmed by three-dimensional
crystal structure of some 7TMR members (reviewed by (Salon et al., 2011)). Additionally,
7TMRs may undergo a variety of posttranslational modifications such as N-linked
glycosylation, formation of disulfide bonds, palmitoylation and phosphorylation. 7TMRs
contain at least one consensus sequence for N-linked glycosylation (Asn-x-Ser/Thr), usually
located near the N-terminus, although there are potential glycosylation sites in the
intracellular loops. They also contain a number of conserved extracellular cysteine residues,
some of which appear to play a role in stabilizing the receptor's tertiary structure. An
additional highly conserved cysteine can be present within the C-terminal tail of many
7TMRs. When palmitoylated, it may anchor a part of cytoplasmic tail of the receptor to the
plasma membrane, thus forming the fourth ICL and controlling the tertiary structure.
Consensus sequences for potential phosphorylation sites (serine and threonine residues) are
located in the second and third ICLs, and in particular, in the intracellular C-terminal tail. The
most obvious structural differences between the receptors in subgroups are the length of their
N-terminal fragment and the loops between TMs. Originally, 7TMRs were divided into six
groups, A – F; families (also known as "groups" or "classes") A, B and C included all
mammalian 7TMRs. Genome projects then generated numerous new 7TM sequences and
more than 800 human 7TMRs were reclassified into five families, A – E (reviewed by
(Gurevich & Gurevich, 2006; Salon et al., 2011)).
Family A (also known as the rhodopsin family) is by far the largest family of 7TMRs
(containing ~700 members), and includes many of the receptors for biogenic amines and
small peptides. It is characterized by very short N- and C-termini as well as several highly
conserved amino acids. In most cases TMs serve as the ligand-binding site. This family
contains some of the most extensively studied 7TMRs, the opsins and the β-adrenergic
receptors. Recent structural information for a few family A 7TMR members (e.g. rhodopsin,
opsin, human β
2
-adrenergic receptor, turkey β
1
-adrenergic receptor, human A
2A
-adenosine
receptor, CXC chemokine receptor type 4 and D
3
-dopamine receptor) confirmed an obvious
conservation of the topology and seven-transmembrane architecture (Salon et al., 2011).
Family B (secretin-receptor family), which has considerably fewer members i.e. 15, is
characterized by a long N-terminus (>400 amino acids) containing six conserved cysteine
residues that contribute to three conserved disulfide bonds, which provide structural
stability, and a conserved cleft for the docking of often helical C-terminal region of the
peptide ligands. Natural ligands for family B 7TMRs are all moderately large peptides, such
as calcitonin, parathyroid hormone and glucagon. Family C (metabotropic glutamate
family) contains 15 members that are the metabotropic glutamate receptors (mGluRs), the
Quantitative Assessment of Seven Transmembrane Receptors
(7TMRs) Oligomerization by Bioluminescence Resonance Energy Transfer (BRET) Technology
83
Ca
2+
sensing receptor, and the receptor for the major excitatory neurotransmitter in the
central nervous system, the γ-aminobutyric acid (GABA
B
) receptor and orphan receptors.
This family has a very large N-terminal domain (>600 amino acids), which bears the agonist
binding site and also a long C-tail (Kenakin & Miller, 2010; McGraw & Liggett, 2006).
Notably, family C members form obligatory dimers (Kniazeff et al., 2011). Two ancillary
families consist of class D (adhesion family), containing 24 members, and class E (frizzled
family), with 24 members.
3. 7TMRs homo- and hetero-oligomerization
In 1983, Fuxe et al. (Fuxe et al., 1983) formulated the hypothesis about the existence of
homo-dimers for different types of 7TMRs and in the same year the first demonstration of
7TMRs homo-dimers and homo-tetramers of muscarinic receptors was published (Avissar et
al., 1983). However, the evidence for dimerization existed even before that. Following
classical radio-ligand studies on the insulin receptor (de Meyts et al., 1973), negative
cooperativity, for which dimerization is a prerequisite, has also been demonstrated for β
2
-
adrenergic receptor (β
2
-AR) (Limbird et al., 1975) and thyrotrophin-stimulating hormone
(TSH) receptor (De Meyts, 1976) binding in the early 70’s, before they were shown to be
7TMRs and this issue remained controversial for over two decades. 7TMRs can be either
connected to identical partner(s), which results in formation of homo-dimers (or homo-
oligomers), or to structurally different receptor(s), which results in formation of hetero-
dimers (hetero-oligomers). 7TMR dimerization was proposed to play a potential role in i)
receptor maturation and correct transport to the plasma membrane, ii) ligand-promoted
regulation, iii) pharmacological diversity (e.g. positive and negative ligand binding
cooperativity), iv) signal transduction (potentiating/attenuating signaling or changing G-
protein selectivity), and v) receptor internalization and desensitization (Terrillon & Bouvier,
2004). The first widely accepted demonstration of 7TMR hetero-dimerization came from the
GABA
B
(GBBR) receptors that exclusively function in a heteromeric form (White et al., 1998).
There is now considerable evidence to indicate that 7TMRs can form and function as homo-
dimers and hetero-dimers (reviewed by (Filizola, 2010; Gurevich & Gurevich, 2008a;
Palczewski, 2010)) and that these dimers may have therapeutic relevance (Casado et al., 2009).
Hetero-dimerization in the C family of receptors has been most extensively studied and for
some experts in the field of 7TMRs the only one demonstrated to form real dimers (for recent
review see (Kniazeff et al., 2011)). In this family of 7TMRs receptors hetero-dimerization is
important for either receptor function, proper expression on the cell surface or enhancing
receptor activity. In the most numerous family A 7TMRs dimerization was extensively
studied, although with few exceptions functional role of receptor self-association is in most
cases unclear. Compelling evidence for the dimerization in the family A 7TMR was only
recently demonstrated in vivo by Huhtaniemi’s group, who was able to rescue the LH receptor
knockout phenotype by complementation i.e. co-expressing two nonfunctional receptor
mutants in the knockout mice (Rivero-Muller et al., 2010). Members of the family B 7TMRs
have also only recently been shown to associate as stable homo-dimers. The structural basis of
this, at least for the prototypic secretin receptor, is the lipid-exposed face of TM4. This complex
has been postulated as being important for the structural stabilization of the high affinity
complex with G-protein (reviewed by (reviewed by (Kenakin & Miller, 2010)).
Bioluminescence – Recent Advances in Oceanic Measurements and Laboratory Applications
84
In addition to widespread intra-family hetero-dimerization, inter-family hetero-dimerization
has also been reported, at least between both of the family A members β
2
-AR and opsin and
the family B member gastric inhibitory polypeptide receptor (GIP) (Vrecl et al., 2006), and
between the family A serotonin 5-HT
2A
receptors and the family C mGluR2 (Gonzalez-Maeso
et al., 2008). Both types of hetero-dimers were demonstrated to be functional, either by their
ability to induce cAMP production upon agonist stimulation (family A/B hetero-dimer), or by
their ability to modulate G-protein coupling (family A/C hetero-dimer).
3.1 Dimerization interface
Growing experimental data support the view that 7TMRs exist and function as contact
dimers or higher order oligomers with TM regions at the interfaces. In contact
dimers/oligomers of 7TMRs, the original TM helical-bundle topology of each individual
protomer is preserved and interaction interfaces are formed by lipid-exposed surfaces.
Although domain-swap models, i.e. models in which domains TM1/TM5 and TM6/TM7
would exchange between protomers, have also been proposed in the literature, there is
there is limited direct evidence that supports these assumptions. On the other hand,
compelling experimental evidence exists for the involvement of lipid exposed surfaces of
TM1, TM4 and/or TM5 at the dimerization/oligomerization interfaces of several 7TMRs.
Besides, the interface may depend on additional stabilizing factors such as the coiled-coil
interactions reported in the GABA
B
receptor and the disulfide bridge interactions in the
muscarinic and the other class C receptors (reviewed by (Filizola)). A web service, named
G-protein coupled Receptors Interaction Partners (GRIP) that predicts the interfaces for
7TMRs oligomerization is also available at (Nemoto
et al., 2009). G protein coupled Receptor Interaction Partners DataBase (GRIPDB) has also
been developed, which provides information about 7TMRs oligomerization i.e.
experimentalaly indentified 7TMRs oligomers, as well as suggested interfaces for the
oligomerization (Nemoto et al., 2011).
3.2 Therapeutic application and drug discovery
7TMRs are one of the most important drug targets in the pharmaceutical industry;
approximately 40% of the prescription drugs on the market target 7TMRs, but only 5% of
the known 7TMR targets are utilized. Agonists and antagonists of 7TMRs are used in the
treatment of diseases of every major organ system including the central nervous system,
cardiovascular, respiratory, metabolic and urogenital systems. The most exploited 7TMR
drug targets include AT
1
angiotensin, adrenergic, dopamine and serotonin (5-
hydroxytryptamine, 5-HT) receptor subtypes (Schoneberg et al., 2004). For instance,
antagonists of AT
1
angiotensin II receptors are used to prevent diabetes mellitus-induced
renal damage and to treat essential hypertension and congestive heart failure. β-adrenergic
receptor antagonists, acting on β
1
- and/or β
2
-adrenergic receptors, are used in patients with
congestive heart failure and to treat hypertension and coronary heart disease, while β
2
-
adrenergic receptor agonists are used in the treatment of asthma, chronic obstructive
pulmonary disease and to delay preterm labor. Dopamine receptor antagonists, primarily
acting on D
2
receptors, are utilized in the treatment of schizophrenia, while dopamine
receptor agonists (e.g. precursor for dopamine levodopa (L-dopa)) remain the standard for
treating Parkinson's disease. Inhibitors of 5-HT uptake, which act as indirect agonists at
Quantitative Assessment of Seven Transmembrane Receptors
(7TMRs) Oligomerization by Bioluminescence Resonance Energy Transfer (BRET) Technology
85
various subtypes of 5-HT receptors, are used to treat major depressive disorders
(Schoneberg et al., 2004).
The increasing importance of dimerization for 7TMRs naturally suggests its possible
relevance to drug discovery. It seems that the inclination to hetero-dimerize is common
among the 7TM members and that the tissue-specific expression patterns probably underlay
the creation of relevant receptor pairs. However, 7TMRs expression has been shown to be
altered in some pathological situations. In support to the latter preeclampsia was the first
disorder linked to alteration in the AT
1
−bradykinin B
2
receptor hetero-dimerization
(AbdAlla et al., 2001). Opioid and dopamine receptor hetero-dimerization has also been
comprehensively studied, since their putative ligands are used in pathological conditions
such as basal ganglia disorders, schizophrenia, drug addiction and pain. The increase in the
dopamine D
1
-D
3
hetero-dimer was shown to be involved in L-dopa-induced dyskinesia in
patients with Parkinson’s disease and the addition of an adenosine A
2A
receptor antagonist
potentiates the anti-parkinsonian effect of L-dopa. Hetero-dimers of glutamate receptors
mGluR2 and 5-HT
2A
have been specifically associated with hallucinogenic responses in
schizophrenia. Furthermore, the opioid δ-μ receptor hetero-dimer is a better target than
either μ or δ receptors alone, since blockade of the δ receptor decreases tolerance to the
analgesic effects of the most used μ receptor agonist, morphine (reviewed by (Ferré &
Franco, 2010; Kenakin & Miller, 2010)). These observations would probably led to broaden
the therapeutic potential of drug targeting 7TMRs and it is also anticipated that the evolving
concepts of 7TMR dimerization will be implemented in the BRET-based drug discovery and
development process (reviewed by (Casado et al, 2009)).
4. BRET principle and its application in the field of 7TMRs dimerization
4.1 BRET principle
BRET is a biophysical method that enables monitoring of physical interactions between two
proteins fused to BRET donor and acceptor moieties, respectively, dependent on their
intermolecular distance (10 – 100 Å) and on relative orientation due to the dipole-dipole
nature of the resonance energy transfer mechanism (Zacharias et al., 2000). BRET is a non-
radiative energy transfer, occurring between a bioluminescent donor that emits light in the
presence of its corresponding substrate and a complementary fluorescent acceptor, which
absorbs light at a given wavelength and re-emits light at longer wavelengths. To fulfill the
condition for energy transfer, the emission spectrum of the donor must overlap with the
excitation spectrum of the acceptor molecule (Zacharias et al., 2000). BRET occurs naturally
in some marine species (e.g. in the sea pansy Renilla reniformis) and in 1999, Xu et al. (Xu et
al., 1999) utilized this approach to study dimerization of the bacterial Kai B clock protein.
Since then, several versions of BRET assays have been developed that use different
substrates and/or energy donor/acceptor couples. The original BRET
1
technology used the
pairing of Renilla luciferase (Rluc) as the donor and yellow fluorescent protein (YFP) as the
acceptor (Xu et al., 1999; Xu et al., 2003). The addition of coelenterazine h, the natural
substrate of Renilla luciferase (Rluc), leads to a donor emission of blue light (peak at ~480
nm). When the YFP-tagged acceptor molecule, adapted to this emission wavelength, is in
close proximity to the Rluc-tagged donor molecule, excitation of YFP occurs by resonance
energy transfer resulting in an acceptor emission of green light (peak at ~530 nm). The
substantial overlap in the emission spectra of Rluc and YFP acceptor emission (Stokes shift
Bioluminescence – Recent Advances in Oceanic Measurements and Laboratory Applications
86
only ~50 nm) creates a significant problem that has been overcome in a second generation of
BRET assay (BRET
2
). In BRET
2
assays, Renilla luciferase (Rluc) is used as the donor, the green
fluorescent protein (GFP) variant GFP
2
as the acceptor molecule (excitation ~400 nm,
emission peak at 510 nm) and the proprietary coelenterazine DeepBlueC
TM
(also known as
coelenterazine 400A) as a substrate. In the presence of DeepBlueC
TM
, Rluc emits light
peaking at 395 nm, a wavelength that excites GFP
2
resulting in the emission of green light at
510 nm. This modified BRET pair results in a broader Stokes shift of 115 nm, thus enabling
superior separation of donor and acceptor peaks, as well as efficient filtration of the
excitation light that it does not come to the detector, thereby enabling detection of the weak
fluorescence signal. However, the disadvantage of BRET
2
, compared to BRET
1
is the 100-300
times lower intensity of emitted light and a very fast decay of emitted light (Heding, 2004).
BRET
2
sensitivity can be improved by the development of suitably sensitive instruments
(Heding, 2004) and the use of Rluc mutants with improved quantum efficiency and/or
stability (e.g. Rluc8 and Rluc-M) as a donor (De et al., 2007). A third generation BRET assay
(BRET
3
) has been developed recently and combines Rluc8 with the mutant red fluorescent
protein (DsRed2) variant mOrange and the coelenterazine or EnduRen™ as a substrate (De
et al., 2007). EnduRen™ is a very stable coelenterazine analogue that enables luminescence
measurement for at least 24 hours after substrate addition and was utilized in the extended
BRET (eBRET) technology (Pfleger et al., 2006). Therefore, in BRET
3
, donor spectrum is the
same as in BRET
1
, and the red shifted mOrange acceptor signal (emission peak at 564 nm)
improves spectral resolution to 85 nm, thereby reducing bleedthrough in the acceptor
window. Improved spectral resolution and increased photon intensity allow imaging of
protein-protein interactions from intact living cells to small living subjects. Additional
optimized donor/acceptor BRET couples that combine Rluc/Rluc8 variant with the yellow
fluorescent protein, the YPet variant and the Renilla green fluorescent protein (RGFP) has
also been developed (Kamal et al., 2009).
4.2 BRET and 7TMRs dimerization
The use of energy-based techniques such as FRET and BRET has been fundamental for
taking the theme of 7TMRs dimerization/oligomerization at the front of 7TMRs research. In
2000, BRET was introduced in the 7TMR field demonstrating β
2
-adrenergic receptor (β
2
-AR)
dimerization (Angers et al., 2000) and since then BRET-based information about 7TMRs
homo-/hetero-dimerization is rapidly accumulating (for a recent reviews see (Achour et al.,
2011; Ayoub & Pfleger, 2010; Ferré et al., 2009; Ferré & Franco, 2010; Gurevich & Gurevich,
2008a; Gurevich & Gurevich, 2008b; Palczewski, 2010)). As a consequence, knowledge
databases have been developed to gather and organize these scattered data and provide
researchers with the comprehensive collection of information about 7TMR oligomerization.
Existing databases are G protein-coupled receptor oligomer knowledge base (GPCR-OKB)
(Skrabanek et al., 2007; Khelashvili et al., 2010) that is freely available at r-
okb.org and G protein-coupled receptor interaction partners database (GRIPDB) (Nemoto et
al., 2011) available at By analyzing the data in the
GPCR-OKB, we can see that BRET-based approaches were used more often than other
experimental approaches such as co-immunoprecipitation, cross-linking, co-expression of
fragments or modified protomers, use of dimer specific antibodies, fluorescence resonance
energy transfer (FRET) and time resolved FRET to detect oligomerization in vivo while in in
vitro systems others methods still prevail (Table 1). The 7TMR pairs for which functional
Quantitative Assessment of Seven Transmembrane Receptors
(7TMRs) Oligomerization by Bioluminescence Resonance Energy Transfer (BRET) Technology
87
evidence was provided in vivo by BRET are summarized in Table 2. It should be emphasized
that besides the intra-family hetero-dimers, the members from different 7TMR families also
form functionally relevant inter-family oligomers (Table 2).
Oligomers (in vivo)
7TMR Family A Family B Family C Family A/C Other
BRET
18 13 0 1 4 0
Mus musculus
7 5 0 1 1 0
Rattus norvegicus
9 5 0 1 3 0
Homo sapiens
9 8 0 0 1 0
Other methods
11 7 0 1 2 1
Oligomers (in vitro)
BRET
50 40 2 1 6 1
Other methods
192 160 4 13 13 2
Table 1. Comparisons of 7TMRs oligomers identified by BRET vs. others methods in
different 7TMR families in in vivo and in vitro. Data source GPCR-OKB (r-
okb.org).
Oligomer name Organism
In vivo evidence
Potential clinical
relevance
Family A 7TMRs
Adenosine A1 -
Adenosine A2A
oligomer (A1 - A2A)
Rattus norvegicus
evidence for physical association in
native tissue or primary cells
Adenosine A2A -
Cannabinoid CB1
oligomer (A2A - CB1)
Homo sapiens,
Rattus norvegicus
evidence for physical association in
native tissue or primary cells,
identification of a specific functional
property in native tissue (brain)
Implicated in
Parkinson's disease.
Adenosine A2A -
Dopamine D2
oligomer (A2A - D2)
Homo sapiens,
Rattus norvegicus
evidence for physical association in
native tissue or primary cells,
identification of a specific functional
property in native tissue (rat
striatum, human striatum)
Implicated in
Parkinson's desease,
schizophrenia. Level of
adenosine is increased
in the striatal
extracellular fluid in
Parkinson's disease.
Adrenergic
1
B -
Adrenergic
1
D
receptor oligomer (
1
B
-
1
D adrenoreceptor)
Homo sapiens,
Mus musculus
evidence for physical association in
native tissue or primary cells,
identification of a specific functional
property in native tissue (brain), use
of knockout animals or RNAi
technology
The study
demonstrated that
when the 1B-KO and
1D-KO strains of
mice are used in
conjunction with
antagonists, a different
pharmacological
situation emerges
relative to control
(sensitivity to
Phenylephrine).
Bioluminescence – Recent Advances in Oceanic Measurements and Laboratory Applications
88
Oligomer name Organism
In vivo evidence
Potential clinical
relevance
Adrenergic
2
A
receptor - Opioid μ
receptor oligomer
(
2
A-adrenoreceptor –
opioid μ)
Homo sapiens
evidence for physical association in
native tissue or primary cells
Adrenergic
2
-
Prostaglandin EP1
receptor oligomer (
2
-
adrenoreceptor - EP1)
Homo sapiens,
Mus musculus
evidence for physical association in
native tissue or primary cells,
identification of a specific functional
property in native tissue (airway
smooth muscle)
Implicated in
decreasing airway
smooth muscle
relaxation during
asthma.
Cannabinoid CB1 -
Dopamine D2
oligomer (CB1 - D2)
Homo sapiens,
Rattus norvegicus
identification of a specific functional
property in native tissue
Chemokine CCR2-
CXCR4 receptor
oligomer (CCR2 -
CXCR4)
Homo sapiens
identification of a specific functional
property in native tissue
Dopamine D1 -
Histamine H3 receptor
oligomer (D1 - H3)
Mus musculus
evidence for physical association in
native tissue or primary cells
Dopamine D1 - Opioid
μ receptor oligomer
(D1 – μ)
Rattus norvegicus
evidence for physical association in
native tissue or primary cells
Dopamine D2 -
Histamine H3 receptor
oligomer (D2 - H3)
Homo sapiens
Mus musculus
evidence for physical association in
native tissue or primary cells
Opioid δ - Opioid κ
receptor oligomer (δ –
κ)
Mus musculus
colocalization in spinal cord tissue-specific agonist
for pain
Opioid δ - Opioid μ
receptor oligomer
(δ – μ)
Mus musculus
evidence for physical association in
native tissue or primary cells,
identification of a specific functional
property in native tissue
Family C 7TMRs
γ-aminobutiric acid
GABAb receptor
oligomer (GABAB1 -
GABAB2)
Rattus
norvegicus, Mus
musculus
colocalize in brain GABA
B1
agonist
Baclofen is an
antispasm drug
Family A/C 7TMRs
Adenosine A2A -
Metabotropic
glutamate 5 (mGLU 5)
oligomer
(A2A - mGLU5)
Homo sapiens,
Rattus norvegicus
evidence for physical association in
native tissue or primary cells
Dopamine D2 -
Metabotropic
glutamate 5 (mGLU 5)
oligomer (D2 -
mGLU5)
Rattus norvegicus
evidence for physical association in
native tissue or primary cells
Quantitative Assessment of Seven Transmembrane Receptors
(7TMRs) Oligomerization by Bioluminescence Resonance Energy Transfer (BRET) Technology
89
Oligomer name Organism
In vivo evidence
Potential clinical
relevance
Adenosine A2A -
Dopamine D2 -
Metabotropic
glutamate 5 (mGLU5)
oligomer (A2A - D2 -
mGLU5)
Rattus
norvegicus, Mus
musculus
evidence for physical association in
native tissue or primary cells
Serotonin 5-HT2A
receptor oligomer -
Metabotropic
glutamate 2 (5-HT2A –
mGLU2)
Homo sapiens
evidence for physical association in
native tissue or primary cells,
identification of a specific functional
property in native tissue (brain)
5-HT2A levels increase
and mGLU2 levels
decrease in
schizophrenia
Table 2. Intra- and inter-family oligomers with in vivo evidence discovered by BRET method.
Data source GPCR-OKB ().
4.3 Interpretation of BRET results – Possible drawbacks
BRET signal indicates that molecules of the same (or two different) receptors are at maximum
distance of 100 Å (that equals 10 nm) or more accurately that the donor and acceptor moieties
are within this distance. The efficiency of energy transfer depends on the relative orientation of
the donor and acceptor and the distance between them (Zacharias et al., 2000), so that absolute
distances can not be measured. Experimentally determined Förster distance R
0
(distance at
which the energy transfer efficiency is 50%) for BRET
1
and BRET
2
is 4.4 nm and 7.5 nm,
respectively (Dacres et al., 2010). 7TMR transmembrane core spans ~40 Å across the
intracellular surface (Palczewski et al., 2000), which makes BRET suitable to the study of
dimerization. However, certain facts need to be considered when interpreting BRET results.
Firstly, the size of 27 kDa fluorescent proteins and 34 kDa Renilla luciferase is comparable to
that of the transmembrane core of 7TMRs (diameter ∼40 Å). These proteins are usually
attached to the receptor C-terminus, which in different 7TMRs varies in length from 25 to 150
amino acids. Polypeptides of this length in extended conformation can cover 80−480 Å. Thus,
a BRET signal indicates that the donor and acceptor moieties are at distance less than 10 nm,
which may occur when receptors form structurally defined dimer or when they are far >500 Å
apart (reviewed by (Gurevich & Gurevich, 2008a)). The use of acceptor and donor molecules
genetically fused to 7TMRs can alter the functionality of the receptor; fusion proteins can also
be expressed in the intracellular compartments, thus making difficult to demonstrate that the
RET results from a direct interaction of proteins at the cell surface (Ferre & Franco, 2010). The
use of fusion proteins can therefore be a major limitation for this application. Secondly,
quantitative BRET measurements are limited by the quality of the signal and noise level.
Fluorescent proteins and luciferase yield background signals arising from incompletely
processed proteins inside the cell and high cell autofluorescence in the spectral region used
(Gurevich & Gurevich, 2008a). Thirdly, so called bystander BRET results from frequent
encounters between overexpressed receptors and has no physical meaning (Kenworthy &
Edidin, 1998; Mercier et al., 2002). BRET assays should therefore be able to discriminate
between genuine dimerization compared to random collision due to over-expression. To
determine specify of BRET signal the following experiments has been proposed: negative
control with a non-interacting receptor or protein, BRET saturation and competition assays
and experiments that observe ligand-promoted changes in BRET (Achour et al., 2011; Ayoub
Bioluminescence – Recent Advances in Oceanic Measurements and Laboratory Applications
90
& Pfleger, 2010; Ferre & Franco, 2010). Additionally, interpretation of BRET data also
requires quantitative analysis of the results, which was so far done only in a small number of
studies (Ayoub et al., 2002; Mercier et al., 2002; Vrecl et al., 2006). The theoretical background
of the assays described below provides some guidelines for the appropriate interpretation and
quantitative evolution of BRET results.
5. Mathematical models to quantitatively assess the oligomerization state of
studied receptors
5.1 Basic assumptions
Bioluminescent resonance energy transfer takes place at 1-10 nm distances between
molecules thus allowing study of protein-protein interaction. It is a quite robust tool but still
some care should be taken with interpretation of the results. Resonance energy transfer is
described by the Förster equation for energy transfer efficiency E (Förster, 1959):
6
0
66
0
R
E
Rr
(1)
where r is a distance between donor and acceptor, Förster radius R
0
depends on spectral
overlap and dipole orientations yielding R
0
values of 4.4 nm for BRET
1
and 7.5 nm for BRET
2
(Dacres et al., 2010). E is an important parameter in interpretation of the BRET assays used
for oligomerisation studies. If the BRET luminometer is properly calibrated then E can be
calculated from the BRET
max
signal obtained when all donor molecules are accompanied by
acceptor molecules:
max
max
1
BRET
E
BRET
(2)
Calibration should take into account differences in the detector quantum efficiencies at
donor and acceptor emission wavelengths and the proportion of the detected emission
spectra of both markers. Knowing a Förster radius for certain type of BRET technology used
and energy transfer efficiency E we can estimate the distance between the donor and
acceptor marker species in the protein complex.
Calculations in presented BRET assays are derived from Veatch and Stryer article (Veatch &
Stryer, 1977) covering FRET experiments with Gramicidin dimers. In FRET experiments the 28
Q/Q0 is a measurement parameter representing the ratio between not-transmitted energy Q
and total energy Q
0
. Vaecht and Stryer equations have been adopted for BRET experiments
where we measure the ratio between transmitted T and not-transmitted energy Q:
0
1
Q
T
BRET
(3)
Single BRET measurements do not give unambiguous proof that receptors form oligomers
because the signal can be a consequence of random collisions. To get better indication of the
oligomerisation state several quantitative assays were developed.
Quantitative Assessment of Seven Transmembrane Receptors
(7TMRs) Oligomerization by Bioluminescence Resonance Energy Transfer (BRET) Technology
91
5.2 BRET dilution assay
This is a simplest control experiment to check for oligomerisation. Resonant energy transfer
takes place if the distance between donor and acceptor molecules is in the range of Förster
radius R
0
. Molecules can get close enough for BRET also by random collisions (bystander
BRET) if their density is high enough (Kenworthy & Edidin, 1998; Mercier et al., 2002).
Excluding random collisions there should be no concentration dependence for coupled
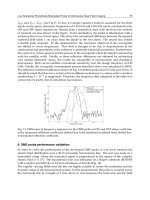
donor and acceptor molecules. In practice we can approximate the BRET signal as:
0
BRET BRET k D A
(4)
where [D] and [A] are donor and acceptor concentrations. With lowering the concentration
of both receptors simultaneously (dilution) the BRET signal approaches BRET
0
which is the
real oligomerisation signal (Fig. 1). Dilution assay is used to set the concentration range for
saturation and competition assays (Breit et al., 2004).
0246810
0
50
100
150
200
250
300
350
BRET (mBU)
[A]+[D]
random collisions
oligomerization signal
oligomerization + random collisions
Fig. 1. BRET dilution assay. Theoretical BRET concentration curves for receptors forming
monomers or oligomers. A constant ratio between acceptor and donor concentrations
should be used.
5.3 BRET saturation assay
Saturation assay involves expressing a constant amount of donor-tagged receptor with an
increasing amounts of acceptor-tagged receptor. Theoretically, BRET signal should increase
with increasing amounts of acceptor until all donor molecules are interacting with acceptor
Bioluminescence – Recent Advances in Oceanic Measurements and Laboratory Applications
92
molecules. Therefore, a saturation level is achieved beyond which a further elevation of the
amount of acceptor does not increase the BRET signal, thereby reaching a maximal BRET
level (BRET
max
)
(Achour et al., 2011; Ayoub & Pfleger, 2010; Hamdan et al., 2006; Mercier et
al., 2002). By using a saturation assay it is possible to obtain the oligomerisation state of
homologous receptors. BRET saturation curve is derived from Veatch and Stryer model:
2(1)
EAD
T
BRET
QDD EAD
(5)
where [AD] are acceptor-donor and [DD] donor-donor dimer concentrations. If all receptors
form dimers and association constants are the same for AA, AD and DD we obtain BRET
saturation curve for dimers:
1(1 )
A
D
A
D
E
BRET
E
(6)
For higher oligomers a general BRET saturation curve can be derived (Vrecl et al., 2006):
max
1
1
11
N
A
D
BRET
BRET
EE
(7)
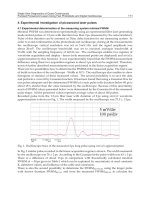
where N=1 for dimer, N=2 for trimer and N=3 for tetramer. Theoretical BRET saturation
curves are presented in Fig. 2. BRET for higher oligomers shows faster saturation. For
comparison the monomer BRET signal which corresponds to random collisions is presented.
If receptor concentration is very high then random collisions can generate saturation curve
similar to that of the dimers. Thus a dilution experiment should be done first to distinguish
random collisions from the oligomerisation.
In heterologous saturation assay different receptors are used as donors and acceptors. In this
case saturation curve is influenced by the affinities for homo-dimer and hetero-dimer
formation. In practice we can observe a right-shift of the saturation curve where the
association constant for hetero-dimers is smaller than that of the homo-dimers yielding
higher BRET
50
values.
5.4 BRET competition assay
In an attempt to further confirm the existence of oligomer complexes, competition assay can
be performed. In this assay the concentration of untagged receptor is increased over a
constant concentrations of donor and acceptor tagged receptors (Achour et al., 2011; Vrecl et
al., 2006). It is expected that the BRET signal would decrease if untagged receptors compete
with the tagged receptors for the binding in complexes. Following the Veatch and Stryer
approach we obtain BRET signal:
2(1)
EAD
T
BRET
QDD EADCD
(8)
Quantitative Assessment of Seven Transmembrane Receptors
(7TMRs) Oligomerization by Bioluminescence Resonance Energy Transfer (BRET) Technology
93
0246810
0
50
100
150
200
250
300
BRET
50
BRET
max
BRET (mBU)
[A]/[D]
Dimer
Trimer
Tetramer
Monomer - low receptor conc.
Monomer - high receptor conc.
Fig. 2. BRET saturation assay. Theoretical curves for oligomer formation are plotted as a
function of ratio of receptors tagged with acceptor [A] and donor [D] molecules. In the case
of monomers the BRET signal is created due to random collisions.
where C represents untagged competitor. If all receptors form dimers and association
constants are the same for AA, AD, DD, CD, AC and CC dimers we obtain BRET
competition curve for dimers:
1(1 )
A
D
AC
DD
E
BRET
E
(9)
Usually in BRET saturation experiments high acceptor to donor concentration ratio is used
because the variation in this ratio do not influence the BRET signal as much as for
[A]/[D]=1. In general the interaction with the untagged receptors causes the reduction of
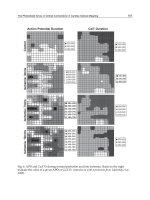
BRET signal following a hyperbolic curve (Figure 3). We can very well distinguish if the
oligomerisation is present, but the exact oligomerisation state is difficult to assess.
Competition assay is more suited for the study of hetero-oligomers where different kind of
untagged receptor is competing with the homo-oligomers. The saturation curve is shallower
if there is a low affinity for hetero-dimer formation compared to homo-dimers
Bioluminescence – Recent Advances in Oceanic Measurements and Laboratory Applications
94
012345
0,0
0,2
0,4
0,6
0,8
1,0
1
,
2
[D]=0.1 [A]=1.0
BRET/BRET
0
[C]
Heterologous - no interaction
Dimer - homologous
Dimer - heterologous
Trimer - homologous
Fig. 3. BRET competition assay. In homologous assay the same receptor is used as a
competitor, whereas in heterologous assay different receptor is used. For the latter case a
hetero-dimer with lower association constant than that of the homo-dimer is presented.
6. Other BRET-based approaches to identify 7TMR hetero-dimerization
To overcome certain limitations of the classical BRET assays described above, some other
BRET-based approaches have been developed to study 7TMR oligomerization/ hetero-
dimerization. Sequential-BRET-FRET (SRET) enables identification of oligomers formed by
three different proteins. In SRET, the oxidation of the RLuc substrate by an RLuc-fusion
protein triggers the excitation of the acceptor GFP
2
by BRET
2
and subsequent energy
transfer to the acceptor YFP by FRET. Combination of bimolecular fluorescence
complementation (BiFC) and BRET techniques is based on the ability to produce a
fluorescent complex from non-fluorescent constituents if a protein-protein interaction
occurs. Two receptors are fused at their C-termini with either N-terminal or C-terminal
fragments of YFP, respectively, and receptor hetero-dimerization causes YFP reconstitution.
Then, if there is hetero-trimerization, BRET can be obtained when the cells also co-express
the third receptor fused to Rluc (reviewed by (Ferré & Franco, 2010)). GPCR-Heteromer
Identification Technology (GPCR-HIT) utilizes BRET and ligand-dependent recruitment of a
7TMR-specific interaction partners (such as a β-arrestin, PKC or G-protein) to enable 7TMR
heteromer discovery and characterization (Mustafa & Pfleger, 2011; See et al., 2011). In this
set up, only one receptor subtype is fused to Rluc and the second receptor subtype is
untagged. A third protein capable of interacting specifically with one or both receptors in a
Quantitative Assessment of Seven Transmembrane Receptors
(7TMRs) Oligomerization by Bioluminescence Resonance Energy Transfer (BRET) Technology
95
ligand-dependent manner is fused to a YFP. Ligand-induced BRET signal indicates that
activation of untagged receptor or the heteromer results in recruitment of YFP-tagged
protein to the heteromer. Recently developed complemented donor-acceptor resonance
energy transfer (CODA-RET) method combines protein complementation with resonance
energy transfer to study conformational changes in response to activation of a defined G
protein-coupled receptor heteromer. CODA-RET quantify the BRET between a receptor
hetero-dimer and a subunit of the heterotrimeric G-protein. It eliminates a contribution from
homodimeric signaling and enables analyzing the effect of drugs on a defined 7TMR heter-
odimer (Urizar et al., 2011).
7. Conclusions
BRET-based techniques are extremely powerful, provided that they are conducted with the
appropriate controls and correctly interpreted. Quantitative BRET assays allow us to
support the ability of receptor for homo-dimer and hetero-dimer. Homologous saturation
assay provide us with the oligomerisation state of receptors. Data interpretation is more
difficult for hetero-oligomers and the mixtures of monomer, dimer and higher oligomer
populations. For the quantitative approach we also need to know the relative concentrations
of all receptors used in the experiment, which can be obtained from radioligand binding,
Western blot or ELISA assays.
8. Acknowledgment
We acknowledge funding from the Slovenian Research Agency (program P4-0053) and
Slovenian-Danish collaboration grants (BI-DK/06-07-007, BI-DK/07-09-002 and BI-DK/11-
12-008).
9. References
AbdAlla S, Lother H, el Massiery A, Quitterer U. (2001) Increased AT(1) receptor
heterodimers in preeclampsia mediate enhanced angiotensin II responsiveness. Nat
Med 7, 1003-1009.
Achour L, KM, Jockers R, Marullo S. (2011) Using quantitative BRET to assess G protein-
coupled receptor homo- and heterodimerization. Methods Mol Biol, 756: 183-200.
Angers S, Salahpour A, Joly E et al. (2000) Detection of beta 2-adrenergic receptor
dimerization in living cells using bioluminescence resonance energy transfer
(BRET). Proc Natl Acad Sci U S A, 97: 3684-3689.
Avissar S, Amitai G, Sokolovsky M. (1983) Oligomeric structure of muscarinic receptors is
shown by photoaffinity labeling: subunit assembly may explain high- and low-
affinity agonist states. Proc Natl Acad Sci U S A, 80: 156-159.
Ayoub MA, Couturier C, Lucas-Meunier E et al. (2002) Monitoring of ligand-independent
dimerization and ligand-induced conformational changes of melatonin receptors in
living cells by bioluminescence resonance energy transfer. J Biol Chem, 277: 21522-
21528.