Earth Sciences Part 11 potx
Bạn đang xem bản rút gọn của tài liệu. Xem và tải ngay bản đầy đủ của tài liệu tại đây (6.15 MB, 40 trang )
Mud Volcano and Its Evolution
389
• Lateral railway
movement (dextral)
• Porong River
aligned to fault
(sinistral)
• Watukosek
Fault Escarpment
LUSI Eruption site
Bjp-1
Banjarpanji-1
Mud Eruption
Toll Road
Fig. 8. Watukosek fault, consisting of 2 parallel faults where the Porong River is aligned
along the fault line, while the Watukosek fault escarpment represents the up thrown fault
block. LUSI eruption sites are along the Watukosek fault line. The Watukosek fault, striking
from the Arjuno volcanic complex, crosses the LUSI mud volcano and extends towards the
northeast of Java island.
Fig. 9. Distance between the earthquake epicenter and hydrologic response as a function of
earthquake magnitude (Manga, M., 2007).
Earth Sciences
390
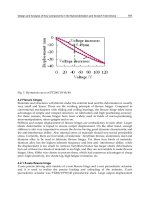
Fig. 10. Values for dynamic stress and frequency of seismic waves that have triggered small
seismic events, compiled by Fisher et al. (2008). The cross shows the estimate for the
Yogyakarta earthquake at LUSI. Source: Mori and Kano, 2009
active vertical movements of mud underneath LUSI, possibly with former eruptions or as a
disturbed signal due to the fault that crosses this area. He suggested that the Yogyakarta
earthquake ultimately triggered the eruption through the already overpressured subsurface
piercement structure. This is supported by a partial loss of well fluid recorded in the
Banjarpanji well nearby 10 minutes after the earthquake, and a major loss of well fluid after
two major aftershocks (see previous chapter on The Underground Blowout Hypothesis –
figure 7). These mud losses, he argued, could be the result of movements along the fault that
was reactivated, lost its sealing capacity and become the passageways for overpressured
subsurface fluid to escape. These fluids ultimately reached the surface at several locations
aligned NE–SW in the Watukosek fault zone direction.
Davies disagreed with Mazzini’s conclusion that the Yogyakarta earthquake reactivated the
Watukosek fault and triggered LUSI mud volcano (Davies et al., 2007). He argued that the
earthquake was too small and too distant to trigger an eruption when in the recent past, two
bigger and closer earthquakes failed to trigger an eruption. He considered the static and
dynamic stresses caused by the magnitude 6.4 earthquake too small to trigger LUSI.
Mazzini backed his hypothesis by presenting further field data that support his hypothesis
that a strike-slip faulting was the trigger mechanism that released overpressure fluids
through already present piercement structures (Mazzini et al., 2009). He presented several
observations on the fault reactivation evidence, among others:
Residents close to the Gunung Anyar, Pulungan, and the Kalang Anyar mud volcanoes,
located along the Watukosek fault almost 40 km NE of LUSI (Fig. 1), reported increased
venting activity of the mud volcanoes after the Yogyakarta seismic event.
Simultaneously, boiling mud suddenly started to erupt in Sidoarjo, later forming the
LUSI mud volcano.
A 1200 m long alignment of several erupting craters formed during the early stages of
the LUSI eruption. The direction of these aligned craters coincides with the Watukosek
Mud Volcano and Its Evolution
391
fault. The craters were formed during May-early June 2006, but were later covered by
the main LUSI mud flows.
Large fractures several tens of centimetres wide and hundreds of meters long were
observed in the proximity of the BJP-1 exploration well with identical NE–SW
orientation. However no fluids were observed rising through these fractures, which
suggests a shear movement rather than a deformation from focussed fluid flow.
The intersection of the fault with the nearby railway clearly indicates lateral movement.
The observed lateral movement recorded at the railway during the first four months
was 40– 50 cm. The lateral movement recorded at the neighbouring GPS stations during
the same time interval reveals at total displacement of 22 cm (2 cm in July, 10 cm in
August, 10 cm in September) (see figure 11). This later displacement was possibly
related to the gradual collapse of the LUSI structure. In any case, the difference between
these two records shows that an initial 15–20 cm of displacement that must have
occurred during the early stages (i.e. end of May–June) related to the Watukosek fault
shearing. Since 27
th
May earthquake, the rails have had to be repaired four times. Two
of these repairs were done within the first three months after the earthquake to remove
the bending due to the continuous shearing.
Fig. 11. Shear stress have damaged nearby infrastructures such as the dextral movements of
a railway, bursting of a gas pipeline and numerous breakages of water pipelines at the same
location further supports displacements along faults. (A)The railway bent to the west of
main vent on September 2006. Offsets that occurred approximately 40 cm with orientation
direction NW - SE. (B) At the same location, the railway was bent again in October 2009,
with an offset of approximately 45 cm. The bending of the railway line is due to fault
reactivation that often has differential movements which created shear stress.
A water pipeline experienced significant bending and ruptures at the intersection with
the fault (Fig. 5A–B). Since the May 2006 earthquake occurred, the pipeline has been
repaired sixteen times. Note that neither the rails nor the water pipeline had kink
problems before the earthquake.
Earth Sciences
392
He also found seismic sections taken in the 1980s that showed a dome-shaped piercement
structure; the most spectacular is the collapse structure in the nearby Porong 1 well (Istadi et
al., 2009) (see figure 4). This structure is likely to represent an extinct mud volcano that
gradually collapsed around its own vertical feeder channel.
Mazzini further showed shear-induced fluidization mechanism through experiment that a
relatively small displacement resembling a fault movement can turn a pressurized sand box
model from once sealing layers, to become non-sealing. He demonstrated that the critical
fluid pressure required to induce sediment deformation and fluidization is dramatically
reduced when strike-slip faulting is active. (see Mazzini et al., 2009).
Fig. 12. Schematic cartoon (not to scale) of a mud volcano appearing along strike-slip faults.
The shear zone along the Watukosek fault system and Siring fault that crosses LUSI where a
low velocity interval existed before the eruption. Reactivation of the strike-slip fault after the
earthquake caused the draining of fluids from the low density units towards the fault zone
as the preferential pathway.
2.5 Response to earthquake
Due to its tectonic position at the front of the subducting Australian plate under the Sunda
plate to the south, Java has been seismically active (see figure 13A). The compressional
stresses, either due to subduction or its secondary effect that compresses the Sunda plate in
a N-S direction, puts strain on local faults, especially those trending NE-SW. The latter
caused a rupture on the NE-SW Opak fault, and had resulted in the magnitude 6.4
Yogyakarta earthquake, on 27 May 2006. This earthquake led to a new understanding of its
effect on the volcanic plumbing system of Java Island. At the time of the earthquake, two
Javanese volcanoes - Merapi and Semeru, were active; the distance of these volcanoes from
the epicenter are around 50 km and 260 km respectively (see figure 13). It was observed that
while there was no new volcanic eruption, the eruptive response of the heat and volume
flux of these two volcanoes changed considerably by a factor of two-to-three starting on the
third day after the earthquake (Harris and Ripepe, 2007). Their work revealed immediate
eruptive response through processing of thermal data for volcanic hot spots detected by the
Moderate Resolution Imaging Spectrometer (MODIS), ().
This implies that the earthquake triggered enhanced simultaneous output and identical
trends in heat and volume flux at both volcanoes.
Mud Volcano and Its Evolution
393
Fig. 13. Map of Java, showing the location of the Merapi and Semeru volcanoes. Increases in
heat and volume flux occured 3 days after the Yogyakarta earthquake in the Merapi and
Semeru Volcanoes. Thermally anomalous pixels detected by MODVOLC showing all band
21 pixel radiance. Source: Harris and Ripepe, 2007.
It was also reported that the magma extrusion rate and the number of pyroclastic flows from
the volcano suddenly tripled [Walter et al., 2008]. This change did not last long, and
everything was back to normal again after 12 days. This observation suggests that while this
magnitude 6.4 earthquake may not able to trigger a new eruption, it is able to change the
intensity of an erupting volcano at a long distance (260 km).
The May 2006 earthquake was one of the deadliest earthquakes in Java in historical times.
Although it was as a magnitude 6.4, the scale of destruction was unprecedented in the
region. The large scale destruction was concentrated in a 10 – 20 km distance along the Opak
River Fault where the subsurface lithology consists mainly of soft volcaniclastic lahar
deposit (Walters et al., 2007). Walters study suggests that such deposits have the property to
amplify the ground motion such that even a relatively small magnitude earthquake could
result in large scale destruction.
The two works of Harris and Ripepe, and Walters suggest the complex interdependency of
the causes and effects in a seismically and volcanically active environment. The 27
th
May
Earth Sciences
394
2006 earthquake changed the static and/or dynamic stresses of the area. Their studies
suggest a link between earthquake, changes in subsurface condition and its effect on the
volcanic activity.
To monitor and record seismic waves around LUSI seismograph installation was carried out
at several stations between April and July 2008 (see Figure 14). Seismic waves can be
generated by the existing fault activity or by new cracks in the rock layers that had lost their
cohesive strength as a result of subsidence around the main eruption vent of LUSI. The
microseismic or seismic waves and energy released during crack formation in the rocks is
relatively small compared to the energy released by earthquakes.
Microseismic activity recorded by the seismograph network installed around LUSI consists
of 6 sensor units, of short period type and broadband seismographs. Each seismograph was
Fig. 14. (A) Epicenter locations of June 1
st
and 12th 2008 earthquakes located about 240 km
and 630 km respectively from LUSI. (B) LUSI Microseismic monitoring network located
around the center of the main crater. Seismographs show the June 12th 2008 earthquake
with an epicenter located about 240 km South of LUSI.
Mud Volcano and Its Evolution
395
equipped with a digital recorder system that records continuously for 24 hours, and GPS
was used as timing marks on the seismic wave data. Data was processed by analyzing the
arrival time of the P wave and S wave. The results of "picking" or "reading arrival rate" was
analyzed with appropriate software, to determine the source of vibration.
To determine the location of the vibration source or microseismic hypocenter requires
seismic wave velocity data at LUSI location. Wave velocity data was obtained from
seismic surveys and wells logging data during drilling. Processed results in the form of
coordinates of the location of the source of the wave system are plotted in three
dimensions, so that the pattern of its occurence can be seen clearly. To facilitate
processing, field data which is a mixture of different frequencies and microseismic noise
are filtered, so as to identify microseismic events, arrival time, P wave and S wave,
maximum amplitude and duration. All data was processed to determine the parameters
of microseismic, namely: the timing, location coordinates, depth and magnitude. The
results of the data processing are classified into two types of earthquakes, namely: the
earthquake which occurred outside LUSI, and those that occurred around LUSI. In this
case we will focus on earthquake data that occurred outside the LUSI area to determine
earthquake response to changes in temperature, gas flux and behaviour that occur in the
main vent.
The ability to detect an earthquake depends on the magnitude of the earthquake, the
sensitivity of the sensors (seismometers), and the distance between the hypocenter and
the location of the sensors. In general, earthquakes in Indonesia with magnitudes above
5.0 on the Richter scale, will be recorded by almost all seismograph networks in
Indonesia. Like the two above mentioned tectonic earthquakes, wave energy can
propagate from the source to the sensor around LUSI, with greater strength than the noise
level around the sensors.
No. Stations
Coordinates
Periods
Latitude Longitude Agency
1 POR 1 -7.53084 112.73086 29 April – 5 July 2008 BMKG
2 POR 2 -7.54043 112.70377 29 April – 5 July 2008 BMKG
3 POR 4 -7.54414 112.71470 29 April – 5 July 2008 BMKG
4 LUSI 2 -7.51485 112.74049 29 April – 5 July 2008 BMKG
5 LUSI 4 -7.52660 112.69772 29 April – 5 July 2008 BMKG
6 LUSI 5 -7.53700 112.72535 29 April – 5 July 2008 BMKG
Table 1. Coordinates of microseismic network stations in the area LUSI.
During the monitoring period two tectonic earthquake occurred outside LUSI. These are:
1. June 1, 2008, Time 15:59:50.2 GMT, the epicenter was located at latitude 9.53
o
South -
longitude 118.04
o
East, at a depth of 90 km with a magnitude of 5.5 SR, about 630 km
from LUSI
2. June 12, 2008 At 05:19:55 GMT, the epicenter was located at latitude 9.68
o
South -
longitude 112.67
o
East, at a depth of 15 km and magnitude of 5.4 SR, about 240 km from
LUSI.
In addition to microseismic monitoring, temperature, LEL (low explosive limit- in air where
20% LEL corresponds to 10000 ppm), and H
2
S concentration monitoring was continuously
Earth Sciences
396
performed using portable monitoring equipment by BPLS (Sidorajo Mud Mitigation
Agency) officers in the field. Measurements from 1 to 20 June 2008 showed a fluctuation
LEL, H2S, and temperature at the center of eruption. The peak value of the measurement
period occurred on June 12 and 13, 2008, in which all measurement parameters rose sharply,
particularly temperature and the concentration of H
2
S (see figure 15).
Fig. 15. Correlation between LUSI mud volcano activity and earthquakes. Increasing gas
expulsion, temperature and mud eruption rates after earthquake are shown in the above
graph after the 12
th
of June 2008 5.5 Mw earthquake. The epicenter was located some 240km
South of LUSI.
The increase in temperature positively correlates with data from the installed seismograph
network around LUSI which showed an earthquake occurred approximately 240 km south
of LUSI on June 12, 2008. In The case of LUSI, the earthquakes have affected the rheology of
fluid in term of permeability, changing the viscosity and the rate of mud eruption,
consequently the increased concentration of expelled gases and temperature.
2.6 Horizontal displacement
Geodetic measurements were conducted at the LUSI site to quantify the ongoing
deformation processes. The primary data sources were the GPS surveys periodically
conducted at monitoring stations to measure vertical and horizontal movements relative to a
more stable reference station. Seven GPS survey campaigns were conducted between June
2006 and April 2007. The GPS measurements were conducted at 33 locations using dual-
frequency geodetic type receivers over various time intervals. Each measurement lasted
from 5 to 7 h. (Istadi et al., 2009).
Areas within a 2–3 km radius of LUSI’s main mud eruption vent are experiencing ongoing
horizontal and vertical movement aligned to major faults. The horizontal displacements
have spatial and temporal variations in magnitude and direction, but generally follows
the two major trends, namely in the direction of NE - SW and NW – SE (see figure 16).
Rates of horizontal displacement are about 0.5–2 cm/day, while vertical displacements
are about 1–4 cm/day, with rate increasing towards the extrusion centre (Abidin et al,
2008).
Mud Volcano and Its Evolution
397
Fig. 16. (A). Horizontal displacement measurements in September - October 2006. Directions
of the red arrows show the direction and magnitude of movement. (B). Measurements from
June 2006 - March 2007 indicate the major trends are NW-SE and NE-SW as seen in the rose
diagram.
Earth Sciences
398
2.7 Subsidence and uplift
Five years after the mud eruption, the area near LUSI has subsided at a considerable rate.
Buildings and houses near the eruption site have completely disappeared under layers of
mud. However, in the east and northeast uplift is occurring. To measure both the subsidence
and uplift, four survey campaigns were conducted (Table 2):
Start End Points Method
July 2006
March 2007
25
GPS
Dec. 2007
April 2009
30
Total Station
Dec. 2008
Feb. 2011
15
GPS
Dec. 2008
Feb. 2009
5
Level
Table 2. Four survey methods to measure elevation near LUSI MV
Data from these four surveys was used to show the changes in elevation, subsidence and
uplift, as well as horizontal movement over time. Subsidence contour maps were created
using GIS software by interpolating the measurement data. The results showed an almost
concentric pattern shown in Figure 17.
The subsidence started as a crack in the ground that continued to grow and decrease its
elevation. The existence of subsidence was evidenced by, among other things, the pattern of
ground cracks, tilting of houses, cracking of flyover and bridges, as well as collapsing of
buildings. The direction of the cracks varies depending on its location. In the Renokenongo
area, southeast of LUSI, the cracks direction is NE- SW, whereas in West Siring area, west of
LUSI, the cracks are North-South.
Subsidence and horizontal movements indicate the dynamic geological changes in the area.
These movements have caused reactivation of pre-existing faults or newly formed faults.
The continued movements along faults would likely result in the emergence of more
fractures and gas bubbles (see figures 17 and 18).
Subsidence continues as the mud eruptions progress. The subsidence might result from any
combination of ground relaxation due to mudflows, loading due to the weight of mud
causing the area to compact, land settlement, geological structural transformation and
tectonic activity (Abidin et al., 2007).
Based of field measurements, areas up to 3 km from the main eruption vent are experiencing
subsidence to some degree. Presently however, due to much reduced volumes of mud
eruption, the measured rate of subsidence on the West side of main eruption vent indicate a
decrease from the original 25 cm/month when LUSI was very active in the first year, to less
than 5 cm/month. If the decreasing trend continues, the affected subsidence area will likely
decrease from earlier prediction of more than 3-4 km.
Mud Volcano and Its Evolution
399
Fig. 17. LUSI post eruption map. The subsidence contour is status as of January 2010,
constructed by interpolating the measurement data, and was created using GIS software.
The contour showed an almost concentric pattern. The area West of the main vent was
subsiding faster than other areas.
The map also shows fractures distribution around LUSI. East of the main vent, fractures
trend NE - SW, whereas West of the main vent the fracture trend is North-South.
The Gas bubble distribution around LUSI status in May 2011 where more than 220 gas
bubble locations have been recorded since the start of LUSI eruption in May 2006. Presently
only a few are still active.
Earth Sciences
400
Fig. 18. Photo showing subsidence and collapse of the retaining mud dyke northeast of the
LUSI main vent that occurred on 21 May 2008. In some parts, where slumping and
subsidence occurred, local small scale faulting at the edge of subsiding wall occured. The
continued subsidence proves very difficult to maintain the dyke.
2.8 InSAR data
InSAR (Interferometric Synthetic Aperture Radar ) is a technique to map ground
displacement with a high resolution of up to centimeter-level precision (e.g. Massonnet and
Feigl, 1998; Hanssen, 2001). InSAR is effective tool to measure the amount of ground
deformation caused by earthquake, volcanic activity has been useful for studying land
subsidence associated with ground water movements (e.g. Amelung et al., 1999; Gourmelen
et al., 2007), mining (e.g. Carnec and Delacourt, 2000; Deguchi et al., 2007a), and geothermal
as well as oil exploitation (e.g. Massonnet et al., 1997; Fielding et al., 1998). The amount and
pattern of deformation are shown by a range of colors in the spectrum from red to violet.
The computed interferograms are interpreted using an inversion method that combines a
boundary element method with a Monte-Carlo inversion algorithm (Fukushima et al., 2005).
In LUSI, this technique was used to determine the surface deformation due to the mudflow
starting from 19 June 2006 (three weeks after the mud eruption) to 19 February 2007. The
measurement was done using PALSAR (Phased-Array L-band SAR) onboard the Japanese
Earth observation satellite ALOS. Measurement of land subsidence is possible as the L-band
microwave is less affected by vegetation (Deguchi et al., 2007a).
Deguchi et al. (2007a, 2007b) and Abidin et al. (2008) performed a study and measured the
ground subsidence temporal changes of deformation obtained by applying time-series
analysis to the deformation results extracted by InSAR.
From 19 June 2006 to 4 July 2006 the subsidence showed an elliptical pattern, suggesting
subsidence around the main vent and west of the main vent.
From 4 July 2006 to 19 February 2007, the scale of subsidence and uplift became more
significant. Both subsidence and uplift East of the main vent became more pronounced. In
contrast to the high rate of mud eruption however, the InSAR results clearly showed that
the ground deformation associated with mud eruption decreased after November 2006.
Mud Volcano and Its Evolution
401
The results from the use of InSAR indicate subsidence has occurred in this area. Four different
areas of deformation is suggested, these include areas centered around the main eruption vent;
areas to the west-northwest of the main vent; areas to the northeast of main vent; and to the
southwest of the main vent. Apart from the areas to the west-northwest which is associated
with the deformation due to gas production in Wunut gas field, the other 3 deformation areas
follow the regional fault pattern, contiguous to the Watukosek NE-SW fault trend.
The results also demonstrate the progressive subsidence evolution from time to time during
the period of measurement. Subsidence in the main eruption area showed the most rapid
subsidence rates. The 8-months measurements period showed ellipsoidal subsidence pattern
covering an area of approximately 2 x 3 km2 with a long axis trending NE-SW.
Another area to the west-northwest of the main eruption area is also experiencing
subsidence. This particular area is within the Wunut gas field which covers approximately 2
X 2.5 km2 with long axis trending NW-SE. This trend corresponds to the regional Siring
NW-SE fault trend.
Fig. 19. The interpreted results of InSAR satellite imagery in February 2007 suggest an
elliptical subsidence along the NW - SE long axis with a distance of 1-2 km from the main
eruption vent, namely in the area around West Siring and Pamotan. In the vicinity of the
main mudflow and the eastern regions about 2.5 km northeast of the main eruption, the
subsidence occurred elliptical on the N-S long axis.
(figures modified from Deguchi et al, 2007)
Fault reactivation resulted in horizontal and vertical movement, which later manifested in
the formation of uplift and subsidence or vertical and horizontal offset. An overlay of the
Earth Sciences
402
ellipsoidal InSAR measurements with regional faults in these areas indicate a correlation
between the two. Elipsoidal uplift suggest the long axis trending NNW - SSE is a restraining
stepover to offset oblique strike slip fault of the reactivated Watukosek fault.
It is interesting to note that the InSAR measurements found that the deformation
diminished after November 2006, only 6 months after the start of the eruption.
Interpretation of interferogram for each periodic cycle for the period of May to July 2006
(beginning of eruption) showed more temporal change of deformation compared to the
period of November 2006. In contrast, during the period of October - November 2006 field
observations indicate increasing intensity of subsidence in the western side of the main vent,
particularly in the village of Siring Barat. The main eruption vent and surrounding central
area were experiencing most rapid rate of subsidence and continual collapse of the mud
retaining dykes. Areas to the E-NE of the main vent were experiencing increases in uplift.
The indication of contrasting InSAR measurements could be interpreted as lesser or
diminishing effect of initial fault reactivation that triggered LUSI.
Interpretation of interferogram by Deguchi suggesting psudo anomaly in an area to the
northeast of the main vent and does not indicate uplift based on conversion to rectangular
coordinates (see Deguchi et al, 2007b). Field observation however suggest an uplift has
occurred in areas to the east and northeast of the main eruption, in the Renokenongo village
and surrounding areas. The uplifted area covers an area of approximately 1 X 1.5 km2 with
a long axis trending NNW – SSE.
Fig. 20. The pattern of fractures trending NE -SW in the Village Renokenongo. A section of
land on the right hand side of the picture is uplifted (east side) while the left is the
downthrown block (west side). Note: The mineral water bottle is used as a comparison to
indicate the amount of displacement (~20cm). In contrast to Degushi et al., 2007b psudo
anomaly interpretation, the above photo taken 2 months after the eruption suggests
displacement due to fault movement. Movement due to subsidence was unlikely as it was
minimal at the early stages of the eruption.
Mud Volcano and Its Evolution
403
2.9 Fracture orientation
Fractures appeared around LUSI area as a result of loss of cohesion due to ground
movement, both vertical and horizontal movements. These fractures were concentrated
mainly to the East of the main eruption (Renokenongo village), around the main vent and to
the West (Siring Barat village), with displacements of varying degree and magnitude. The
fractures follow the sinistral Watukosek NE – SW trend. Juxtaposed with the Watukosek
fault reactivation, is the Siring fault movement that trends NW – SE which has dextral strike
slip movement. These fractures were caused by reactivation of faults but their orientation
pattern are often not apparent due to thick alluvial cover.
Fig. 21. (A). On June 2, 2008 the dyke on the East side of the main vent broke with an
orientation NE-SW. Then on June 8, 2008 the 40 m long dyke collapsed as deep as 6 meters.
(B). Fractures on the West Siring village west of the main vent showed an orientation
trending North – South. (C)&(D) an active fault is located west of the main vent and trends
North – South.
2.10 Gas bubbles
Gas bubbles of various sizes and pressures started to appear two days after the mud
eruption. Those that appear from water wells generally have a higher pressure and high
methane concentration than bubbles from surface fractures (see figure 22). The ejected
materials from these gas bubbles typically had some water, mud with minor sand. A total of
over 220 gas bubble locations have been identified since the start of the eruption, however
Earth Sciences
404
the number that are still active continually decrease. Presently less than 20 gas bubbles are
still active, suggesting LUSI is entering a more stable and less active phase.
Gas bubbles are not continuous; they may burst for several weeks or months then stop and
reappear elsewhere. Some gas bubbles appear in straight lines that are contiguous with the
fault trends. These gas bubbles are mainly concentrated on the West and South of the main
eruption which reflect the existence of subsurface gas accumulation breached by deep
fractures. The gas accumulation is believed to be a part of the Wunut gas field flanks with its
sealing capacity breached by the reactivated Watukosek faults or newly formed fractures as
a result of rapid subsidence in the area.
Fig. 22. (A) & (B) The gas bubble originating from water wells, with tremendous pressure
and high content of methane gas. Besides removing water,the bubbles also ejected sand,
shell fossils and a bit of mud from the swamp sediments. (C) Gas bubbles along the fracture
to the west of the main vent, low pressure and in clusters. (D) a Gryphon located
approximately 400 m west of the main vent.
Gas bubbles around the mud volcano have formed gryphons of around 30 cm in diameter
and height of around 40 cm (see figure 22D). The ejected material was mainly methane gas
and some water (see figure 22 A and B).
2.11 Source of mud, water, gas and heat
Mud material ejected from the mud volcanoes is believed to have originated from shale
layers known as ‘Bluish Gray’ clay of the Upper Kalibeng Formation of Plio-Pleistocene in
age. The similarity between the mud and the cutting samples from the nearby well
Banjarpanji-1 from a depth of 1220 – 1828 meters is based on the following:
1. The similarity of foraminifera and nanno fossil collection, as well as index fossils
containing Globorotalia truncatulinoides and Gephyrocapsa spp. that are Pleistocene in
age. Benthos Foram collection shows that the sediment was deposited in the marine
environment in the inner to middle neritic zones, ranging from shoreline to a depth of
100 meters.
2. Kerogen composition correlates with the side wall core from Banjarpanji -1 at a depth of
1707 m.
3. Thermal maturity based Vitrinite reflectance (Ro) correlates with cuttings and side wall
core samples from Banjarpanji-1 at a depth of 1554-1920 meters.
4. Clay mineral composition has similarities with samples from the side wall core from
Banjarpanji -1 at a depth of 1615-1828 meters where the illite content in illite-smectite
mixture reached 65%.
Mud Volcano and Its Evolution
405
LUSI muds contain various types of clay including smectite, kaolinite, illite and minor
chlorite. It is known that illite minerals form at temperatures between 220 to 320 °C, smectite
forms at surface temperatures of up to 180 °C and altered minerals chlorite forms at
temperatures between 140 - 340 °C. The XRD analyses carried out on core samples from
Banjarpanji-1 imply an intensive progressive smectite-illite transformation with the depth.
This suggests that the intersected Upper Kalibeng Formation was exposed to a minimum
temperature of 220 °C.
In the initial stages the volume of water in LUSI was very large reaching up to 70% of the
total volume of mud with an average salinity of 14,151 ppm NaCl. The lower salinity than
sea water suggests dilution. At the time of writing, the liquid composition made up 30% of
the total volume. The source of water has been debated by various researchers. Davies et al
(2007) states that the water originates from the carbonate Kujung formation, while Mazzini
et al (2007) based on geochemical data concluded that the high-pressure water is derived
from clay diagenetic dehydration of Upper Kalibeng Formation.
Indonesian Geological Agency, Ministry of Energy and Mineral Resources in 2008
conducted water analysis by using the Oxygen isotope method (σ18O) and Deuterium (σ D)
to determine the magmatic origin of LUSI. Results showed deuterium concentration (σD)
from -2.7‰ to -13.8 ‰ and Oxygen-18 (σ18O) from +7.59‰ up to +10.11‰, and high
Chloride content of 12,000 – 17,000 ppm. Based on the above they concluded that the water
source of LUSI is associated with igneous rock sourced from magma (Sutaningsih et al.,
2010).
Perhaps it is quite impossible to determine the source of water as it could be a mixture of
different sources, ie. clay diagenetic dehydration, carbonates, deeper source linked to
geothermal, trapped water due to disequilibrium compaction and mixing with shallow
meteoric waters. The importance of determining the source is for hydro-geological
purposes, in handling the impact of the mud flow, its effect to the environment and
contamination to the ground water. If the fluid is old (Tertiary), it is trapped water, whereas,
if the water is young (Quaternary), it is likely to be recharged upslope. For the former,
naturally, the eruption will stop after a certain time, whereas, for the later condition, the
eruption will never stop (Hutasoit, 2007). However, Sunardi et al., 2007 suggested that LUSI
will likely stop when hydrostatic pressure equilibrium is reached.
Groundwater samples from LUSI and its surrounding gas bubbles near the main vent have
been chemically analyzed for major anions (Cl
-
, HCO
3-
, and SO
4
2-
) and cations (Na
+,
K
+
, Ca
2+
,
and Mg
2+
). The result shows that there is a significant difference in water chemistry between
the main vent and the bubble. The concentration of Cl
-
, Na
+
, Ca
2+
, and Mg
2+
in the main vent
water are much higher. This suggests that the water may be from different sources, or both
are from the same source, but the gas bubble water has been diluted by shallow
groundwater. The second case implies that the pressure in the gas bubble areas may be
depleting so that shallow groundwater is mixed with deeper sourced water. If the pressure
is still high, then flow from the eruption area will contaminate the shallow groundwater. In
either case, the ongoing subsidence is also caused by the decreasing pore pressure as the
water is discharged to the surface.
The composition of the erupted gas sampled in July in the proximity of the crater showed
CO
2
contents between 9.9% and 11.3%, CH
4
between 83% and 85.4%, and traces of heavier
hydrocarbons. In September, the steam collected from the crater showed a CO
2
content up to
74.3% in addition to CH
4
. Simultaneously, the gas sampled from a 30.8 °C seep 500 m away
Earth Sciences
406
from the crater had a lower CO
2
content (18.7%). The four gas samples collected during the
September campaign were analysed for δ
13
C in CO
2
and CH
4
. The δ
13
C values for CO
2
and
CH
4
vary from − 14.3‰ to − 18.4‰ and from − 48.6‰ to − 51.8‰, respectively (Mazzini et
al., 2007). The relatively low δ
13
C
CH4
(− 51.8‰) indicates input from biogenic gas mixed with
a thermogenic contribution. The biogenic gas was derived from immature shale layers,
probably from the overpressured shale at a depth of 1323-1871 meters, whilst the
thermogenic gas was derived from shale layers that are more mature, probably of Eocene
age. The CO
2
is postulated to come from the dissolved CO
2
in the water of the shale layer, at
temperatures above 100 °C and low pressure. The constant presence of H
2
S since the
beginning of the eruption could also suggest a contribution of deep gas or, most likely, H
2
S
previously formed at shallow depth in layers rich in SO
4
and/or methane or organic matter.
The rapidly varying composition of the erupted gas indicates a complex system of sources
and reactions before and during the eruption (Mazzini, 2007).
Temperatures measured from a mud flow within 20 m of the LUSI crater revealed values as
high as 97 °C (Mazzini, 2007, 2009). Given the visible water vapor and steam this suggests
temperatures above 100 °C. The heat source of the erupted mud is believed to be from a
formation at a depth of over 1.7 km where the temperature is over 100 °C. Geothermal
gradients of c. 42 and 39 °C/km have been reported in the area. With such a high
temperature gradient, LUSI can be viewed as a geo-pressured low temperature geothermal
system that discharged hot liquid mud close to its boiling point the first four years of its life
(Hochstein and Sudarman, 2010). Hochstein believed that the high temperature gradients
are likely due to the low thermal conductivity of the highly porous, liquid saturated
reservoir rocks. Mazzini, on the other hand, believed that the high geothermal gradient is
due to the close proximity to Mount Arjuno-Welirang (about 40 km), which is part of the
Java volcanic arc that formed since the Plio-Pleistocene (Mazzini, 2007, 2009).
Two shallow ground temperature surveys carried out in 2008 showed anomalously low
temperatures at 1 m depth (possibly due to a Joule-Thompson effect of rising gases) and
liquid mud temperature that varied between 88 and 110 °C with the highest temperatures
occurring after a large, distant earthquake. The mud temperature of mud volcanoes is
controlled by the gas flux (endothermic gas depressurizing induces a cooling effect), and by
the mud flux (mud is a vector for convective heat transfer) Deville and Guerlais (2009).
2.12 Geomorphology of the area
In general, the geomorphology in Porong and the surrounding area is divided into 5 units:
Under the volcanic slopes unit, Foot volcanic plateau unit, Cuesta unit, Alluvial plains unit,
and Mud volcano unit. The geomorphological units division is based on morphology, the
height difference and slope (Desaunettes, 1977).
2.12.1 Under the volcanic slopes unit
The unit is located at the northern foot of the Penanggungan mountain or in the Proximal
facies. This unit is distributed mainly in the southern area of LUSI, adjacent to the mountain
range. Lithologic constituents of the unit are generally in the form of volcanic breccia, tuff,
lava, tuffaceous breccias, lava and agglomerates and the presence of shallow andesite
intrusions in small dimensions. The dominant process in this unit is volcanism. Volcanism
processes of Penanggungan Mountain produce volcanic cone morphology. The pattern of
distribution in this area is a radial pattern.
Mud Volcano and Its Evolution
407
2.12.2 Foot volcanic plateau unit
This unit has the morphology of the plains at the foot of Penanggungan mountain or in the
medial facies. The unit was formed from the deposition of material surrounding the volcano
eruption as laharic. Laharic deposits are found in the form of loose sand and gravel to boulder-
sized fragments as products of volcanic eruptions. There is a wide variety of bedding
igneous rock fragments to the level of weathering, colors and dimensions.
Lithologic constituents of this unit are fine tuff, sandy tuff, tuff and tuffaceous breccia. The
dominant processes in this unit are erosion and sedimentation. The pattern of distribution in
this area is a radial pattern.
2.12.3 Cuesta unit
The Cuesta unit is primarily distributed in the southern area of LUSI. The highest point is at
an elevation of 150 m at the top of the Watukosek hill. The lowest point is at an elevation of
20 m on the valley of Watukosek. The dominant process in this unit is a tectonic process of
faulting, which resulted in shear faults and the down thrown block to the West to form a
steep escarpment in the area of Watukosek. This escarpment is known as the Watukosek
Escarpment. Lithologic constituents are of andesite breccia, sandstone and tuff. Morphology
in the region reflects the existence of Watukosek fault as indicated by the presence of steep
slopes on the western escarpment while relatively gentle on the eastern slopes. The pattern
of distribution in this unit is trellis pattern.
2.12.4 Alluvial plain unit
Alluvial plains unit make up most of the area and are widely distributed near LUSI.
Geomorphological slope is approximately 0 -5%. Lithologic constituents are loose sand
deposits, clay, sandy clay.
Fig. 23. LUSI area showing the division of volcanic facies. The central facies is located at the
top Penanggungan mountain , proximal facies on the upper slopes and medial facies on the
foot slope below the mountain. LUSI overlies the alluvial plains which are approximately10
km from Penanggugan mountain.
Earth Sciences
408
This geomorphological unit is controlled by alluvial rivers. Geologic processes that act on
this unit are erosion, transport and deposition. Lateral erosion took place due to slopes of
the mountains to the South causing lateral erosion to be more effective than vertical erosion.
In this area there are large rivers namely Porong River which is flowing from West to East
that ends up in the Madura Strait. Structural control is clearly visible on the morphology in
this area evidenced by the abrupt deflections in the Porong River that follows the fault
pattern.
2.12.5 Mud volcano unit
The unit was formed due to discharge of mud from formations below the surface. The
morphology is like a low relief hill. The mud volcano Unit is limited by the retaining dykes
so that the mud does not spill over into surrounding areas. This unit includes the Village of
East Siring, Jatirejo, Tanggulangin Glagaharum, Ketapang and surrounding areas.
Lithologically this unit is predominantly the mud itself that contain some fossils.
Fig. 24. Geomorphology map of the Watukosek area.
The morphological shape of LUSI is a semi-conical buildup with a peak around the main
eruption vent. It is similar with the mud volcano models developed by Kholodov (1983) and
Kopf (2002) where LUSI is classified as a swampy mud volcano type. The peak is not high
due to the low viscosity of the extruding mud.
Mud Volcano and Its Evolution
409
2.13 Forming of the Crater
The series of photographs in figure 25 below represent the changes through time at the main
vent of LUSI Mud Volcano. In a time span of 5 years, LUSI has evolved from a small
eruption of steam, hot water and mud to a destructive high rate mud flow, engulfing
houses, schools, factories, neighboring villages and caused a large-scale ground
deformation, damaged the highways, railroad, pipelines, electrical power lines and others;
to presently a much more calm low rate ejection of mud and fluid and occasional
intermittent stopping of steam eruption. LUSI evolved through time from a localized
kilometre-scale fault zone in 2006 and expanded through pre-existing NE-SW Watukosek
fault zone pathways in 2010.
May 2006
LUSI mud volcano on its first day, May
29th, 2006. The mud eruption is
approximately 200 m from the Banjarpanji-1
well location. Initial eruption in the form of
mud and hot water and clouds of steam
with a discharge rate of less than 5,000
m
3
/day.
June 2006
In June, the crater had swelled and the
discharge has reached approximately 50,000
m3/day, with water temperatures as high as
97 °C.
August 2006
A semi conical structure is starting to form.
The volume of water in LUSI is very large
reaching up to 70% of the total volume of
mud, shown in the picture as water
reflection. The low viscosity of the mud
results in mud spreads across, extending to
large areas instead of building up vertically.
Earth Sciences
410
May 2007
In May 2007, retaining walls/dykes were
built to prevent the mud from spilling over
to the villages and major roads. The height
of the dykes encircling the center of
eruption reached approximately 15 m. The
average mud flow rate at the time was
around 100,000 m3/day.
May 2008
Ring levees/dyke were rebuilt and raised to
prevent overflow of mud into the closest
villages. Discharge rate was still around
100,000 m
3/day with surface water
temperatures remain constant at 97 °C.
February 2009
By February 2009, the ring dyke on the
south and north sides are rapidly sinking
due to subsidence and are difficult to
maintain despite efforts to continuously pile
with soil and gravel.
July 2009
The ring dyke around the main vent
collapsed and sank in July 2009. The
eruption discharge rate at this time is
reduced by 60% to approximately 40,000
m
3
/day.
Mud Volcano and Its Evolution
411
January 2010
The diameter of the main crater at this time
is approximately 120 m and flowing
continuously 30-50,000 m3/day. At times
instead of a single crater, it changes to two
or three points aligned in the direction of
the Watukosek fault. The flow is mainly
liquid and hot steam. A gently sloping cone
is starting to form. The mud covered area is
mostly wet, covering 80% of the total area.
January 2011
At this time the mud flow rates and the
scale of steam clouds are reduced. The
eruption rate has decreased to less than
10,000 m3/day. LUSI is now entering a new
phase, from an eruptive one to a mature and
quiescence phase. The mud around the
main vent is solidifying forming a dome.
May 2011
The mud volcano viewed from the west
side. Note the reduced scale of the clouds of
steam.
May 2011
The mud volcano viewed from the north
side with the Watukosek escarpment hills
and Mt. Penanggungan in the background.
Fig. 25. Changes from time to time at the main vent of LUSI Mud Volcano
Earth Sciences
412
Fig. 26. Map interpretation of the results around the center of LUSI from IKONOS imagery
using ERMAPPER Software from 2007 to 2011. The interpretation shows a decrease in the
volume of hot mud around the main vent. In 2007, almost all the fluid inside the dyke is
above 60
o
C. By November 2007, the rate of hot mud has begun to diminish. A year later, in
December 2008, the LUSI morphology dome has begun to form. The next phase was the
reduced production of hot mud in the main vent and the heightened dome coupled with the
formation of the patterns of mud and water flow in the vicinity. (source: BPLS 2011)
Mud Volcano and Its Evolution
413
2.14 Morphological changes
Spatial Aerial Photo Analysis was performed utilizing the CRISP satellite map regularly
obtained from the Centre for Remote Imaging, Sensing and Processing, at the National
University of Singapore (). Changes at the center of the
eruption and the adjacent slopes can be observed.
The area of observation was between -7°27'04" / 112°40'27" and -7°35'52" / 112°49'35" an area
of about 3.7 km x 4.0 km or 14.9 km
2
,
with the focus of the coverage area on the mud ponds.
The data processing stages were as follows:
1. Processed multitemporal IKONOS image data obtained from the CRISP in 2007 until
2010. ERMAPPER software was used for image enhancement, image correction,
interpretation and image classification.
2. Spatial or geographical information analysis, information visualization, organization of
information, combining thematic information using GIS software.
3. Classification of information based on the detection and identification of objects on the
surface of the earth from a satellite image, to the next as the primary identifier elements
and limits of an object is done by coloring.
3. Geohazard
The mud eruption in Sidoarjo has buried houses, villages, schools, factories, and displaced
thousands of people and continues to pose a geohazard risks in a densely populated area
with many activities and infrastructures. Studies of other mud volcanoes in East Java were
used in the geohazard assessment.
Fig. 27. Dramatical sinking of a village gate of Siring Timur, located to the west of the main
vent. The gate and the rubble was half buried but still visible in the 23 November 2007
photograph. Two months later just a part of the tile roof and walls remain visible on 20
January 2008.