Báo cáo hóa học: " Research Article Reliability-Based Decision Fusion in Multimodal Biometric Verification Systems" potx
Bạn đang xem bản rút gọn của tài liệu. Xem và tải ngay bản đầy đủ của tài liệu tại đây (1.29 MB, 9 trang )
Hindawi Publishing Corporation
EURASIP Journal on Advances in Signal Processing
Volume 2007, Article ID 86572, 9 pages
doi:10.1155/2007/86572
Research Article
Reliability-Based Decision Fusion in Multimodal
Biometric Verification Systems
Krzysztof Kryszczuk, Jonas Richiardi, Plamen Prodanov, and Andrzej Drygajlo
Signal Processing Institute, Swiss Federal Institute of Technology, 1015 Lausanne, Switzerland
Received 18 May 2006; Revised 1 February 2007; Accepted 31 March 2007
Recommended by Hugo Van Hamme
We present a methodology of reliability estimation in the multimodal biometric verification scenario. Reliability estimation has
showntobeanefficient and accurate way of predicting and correcting erroneous classification decisions in both unimodal (speech,
face, online signature) and multimodal (speech and face) systems. While the initial research results indicate the high potential of
the proposed methodology, the performance of the reliability estimation in a multimodal setting has not been sufficiently studied
or evaluated. In this paper, we demonstrate the advantages of using the unimodal reliability information in order to perform an
efficient biometric fusion of two modalities. We further show the presented method to be superior to state-of-the-art multimodal
decision-level fusion schemes. The experimental evaluation presented in this paper is based on the popular benchmarking bimodal
BANCA database.
Copyright © 2007 Krzysztof Kr yszczuk et al. This is an open access article distributed under the Creative Commons Attribution
License, which permits unrestricted use, distribution, and reproduction in any medium, provided the original work is properly
cited.
1. INTRODUCTION
Biometric verification systems deployed in a real-world en-
vironment often have to contend with adverse conditions
of biometric signal acquisition, which can be very different
from the carefully controlled enrollment conditions. Exam-
ples of such conditions include additive acoustic noise that
may contaminate the speech signal, or nonuniform direc-
tional illumination that can alter the appearance of a face
in a two-dimensional image. Methods of signal conditioning
and normalization as well as tailor-made feature extraction
schemes help reduce the recognition errors due to the de-
graded signal quality, however they invariably do not elimi-
nate the problem (see, e.g., [1, 2]). Combining independent
biometric modalities has proved to be an effective manner
of improving accuracy in biometric verification systems [3].
A fusion of discr iminative powers of independent biometric
traits, not equally affected by the same environmental condi-
tions, affords robustness to possible degradations of acquired
biometric signals.
Common methods of classifier fusion at the decision
level employ a prediction of the average error of each of
the unimodal classifiers, typically based on resampling of the
training data [3, 4]. This average modality error information
can be applied to weight the unimodal classifier decisions
during the fusion process. The drawback of this approach
is that it does not take into account the fact that individual
decisions depend on the acquisition conditions of the data
presented to the expert as well as on the discriminating skills
of the classifier. In the case of two available modalities, this
approach is also equivalent to the systematic use of the deci-
sions of the more accurate modality and thus defies the pur-
pose of fusion.
Signal quality and impostor/client score distributions
have been used to train weights for classifier combination in
multimodal biometric verification in [5]. The quality mea-
sures were used during the training of the decision module.
However, the quality measures for particular modalities were
subjective quality tags manually assigned to the training and
testing data. Also, the causal relationships between the envi-
ronmental conditions and the classification results were not
deliberately modeled.
In this paper, we investigate an alternative approach to
dynamic decision weighting in multimodal biometric fusion.
We propose to compare the single decision reliability esti-
mates in order to maximize the probability of making a cor-
rect fusion decision. The measure of reliability is defined in
probabilistic terms and expresses the degree of trust one can
have in a particular unimodal classifier decision. We pro-
posed a method of modeling influence of signal quality on
2 EURASIP Journal on Advances in Signal Processing
classifier scores and decisions with application to classifier
error prediction in [6]. The method uses a Bayesian network
trained to predict classification errors given the classification
score, classifier decision, and automatically obtained auxil-
iary information about the quality of the biomet ric data pre-
sented to the unimodal classifier. A system using a speech ex-
pert (a speech classifier combined with a decision reliability
estimator) was shown to sig nificantly reduce the total clas-
sification error rate for speech-based biometric verification
in a sequential repair strategy. In the presence of a second
biometric trait available, a sequential repair strategy can be
replaced by a parallel one where the unreliable decision of
one unimodal classifier can be replaced by a more reliable
decision for another modality. In [7], we presented an em-
bodiment of this parallel multimodal repair strategy, using
speech and face experts and a multimodal fusion module.
The proposed method yielded higher accuracy than any uni-
modal system alone through prediction and correction of the
verification decisions. The results reported in this work were
a proof of concept, demonstrated on an artificially created
chimerical database that by default contained as many classi-
fier errors as correct decisions. This is obviously not the case
in real applications where by definition the number of errors
is minimized. In this paper, we present the application of the
proposed method to a real multimodal database (BANCA),
where both modalities come from the same individual. In
[8], Poh and Bengio presented a method of estimating the
confidence of single classifier decisions using the concept of
margins, which proved to grant good fusion performance in
a multimodal scenario. In the current paper, we show that
our method of reliability based fusion outperforms the mar-
gin approach, thanks to the use of quality measures and the
modeling of their relationship with classifier decisions.
This paper is structured as follows: in Section 2,wesum-
marize the theoretical framework of reliability estimation
using Bayesian networks and signal-level quality measure-
ments. In Section 3 we discuss details of the multimodal
database and experimental protocols. Sections 4 and 5 detail
the speaker and face verification systems together with cor-
responding algorithms to estimate signal quality. Section 6
introduces the decision-level scheme for multimodal fusion
with reliability estimates. Section 7 presents the experimental
results and their discussion, and finally Section 8 concludes
the paper.
2. VERIFICATION DECISION RELIABILITY ESTIMATION
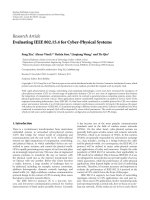
2.1. Bayesian networks for reliability modeling
We define decision reliability for a given modality MR as the
probability that the classifier for this modality has taken a
correct verification decision given the available evidence, that
is, the probability P (MR
| E). The evidence E that provides
information about the state of MR can come from several
sources: signal domain, feature domain, score domain, or de-
cision domain itself. In the present work, for each modal-
ity we use a vector of signal-domain quality measures QM,
classifier score information Sc, and classified identity CID
(CID
= 1 if the score for this biometric presentation is above
TID
CID
MR
Sc
QM
Figure 1: Bayesian network for modality decision reliability estima-
tion.
the decision threshold, otherwise CID = 0). Furthermore, in
training a decision reliability estimator, it is crucial to pro-
vide the ground truth about the user true user identity TID
(TID
= 1 if the biometric presentation really belongs to the
claimed client, otherwise TID
= 0) so that the influence of
the event “the user is a client” on other variables can be taken
into account in modeling. Thus, MR
= 1 represents “the de-
cision from this modality is reliable” (i.e., TID
= CID) and
MR
= 0 represents the opposite statement. These sources
of information and their interrelations are modeled proba-
bilistically using the Bayesian network shown on Figure 1.In
this model, the true user identity (TID) influences the classi-
fied user identity (CID), and the decision reliability for this
modality (MR) also impacts the classifier’s decision (CID).
MR, CID, and TID are all interdependent with the classifier
score Sc, and MR is related to the observed qualit y measures
QM. It should be noted that the number of nodes could be
reduced by removing the TID node, since functionally the
state of the CID and MR binary variables is sufficient to re-
cover TID. For more details on the rationale behind the cre-
ation of this model, original ly used in speaker verification,
the reader is referred to [6]. This model differs from the gen-
erative approach in [9] and the normalization approach in
[10], as we take into account the distribution of scores for
correct and erroneous base classifier decisions, and not only
for client and impostors. More importantly, we use a measure
of signal quality.
The Bayesian network is used for providing values for
P (MR
| E),whichinourcaseisP(MR | CID, Sc, QM).
This marginal probability, which we call the decision reliabil-
ity, expresses the probability that the classifier for this modal-
ity has taken a correct/wrong decision given available evidence.
Inference on P (MR
| CID, Sc,QM) is only possible once
the conditional distribution parameters for the variables have
been learned from training examples. The network param-
eters can be estimated using a maximum likelihood (ML)
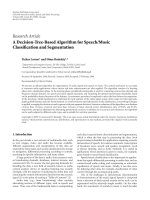
training technique [11]. Figure 2 provides a diagram of a
modality expert consisting of the baseline classifier for a
modality and the corresponding Bayesian network estimat-
ing the decision reliability. The classifier part of the expert
is trained from held-out data which is not used again (see
Section 7). The reliability estimator is trained on sets of vari-
able values (CID, Sc, QM, TID) obtained by feeding biomet-
ric data in diverse environmental conditions to the classifier
Krzysztof Kryszczuk et al. 3
Input
data
(speech/
face)
Front-
end
World model
User model
Classifier
Environmental
conditions
estimator
Veri fic at io n
result (CID)
Score (Sc)
Quality measures
(QM)
True identity (TID)
(only in training)
Bayes net
Modality
reliability
P(MR
| evidence)
Figure 2: Modality expert with modality classifier and modality reliability estimator.
and the environmental conditions estimator. The environ-
mental conditions estimator provides values for the QM vari-
able as described in Sections 4 and 5.
It should be noted that TID is only observed during train-
ing.
The probabilistic decision reliability for each modality,
for example, for speech P (MR
s
= 1 | CID, Sc,QM)andfor
face P (MR
f
= 1 | CID,Sc, QM) can be used to enhance the
accuracy of the final of the multimodal verification system.
2.2. Modeling confidence with margins
In the process of reliability estimation we seek a measure of
how likely it is that the classifier took the correct decision.
Many confidence measures have been proposed for speaker
verification [12]; for example, the computation of a margin
provides such a confidence measure [8]. It is an intuitive and
appealing way of estimating the reliability of a decision for
any biometric modality. For given classifier score Sc the mar-
ginfunctionisdefinedas
M(Sc)
=
CR(Sc) − CA(Sc)
,(1)
where CR(Sc) and CA(Sc) are, respectively, the identity claim
rejection and acceptance accuracies at a given threshold
(score). The absolute value of the difference in observed
probabilities represents a frequentist estimate of the certainty
of the classifier in having chosen one decision over the alter-
native one. In the general case, the function M(Sc) is esti-
mated empirically on a dataset not used during the training
and testing phases. In our case, the margin function was es-
timated on the development dataset. It must be noted that
the frequentist approach to reliability estimation is valid only
under the assumption that the scores of the testing data orig-
inate from similar distribution as the scores originating from
the development set. In our experiments that assumption is
supported by the similarities in the structure of the develop-
ment and testing datasets.
3. DATABASE AND EXPERIMENTAL CONDITIONS
We used face images and speech data from the BANCA
database, English part, which has recently become a bench-
marking multimodal database. BANCA contains data col-
lected from a pool of 52 individuals, 26 males and 26 females.
In this paper, we adhere to the ev aluation protocol P. For the
details on the BANCA database and the associated evaluation
protocol the reader is referred to [13].
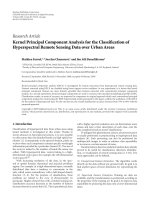
3.1. Face modality data
The face data from the BANCA database consists of images
collected in three different recording conditions: controlled,
degraded,andadverse. For each of the recording condition,
four independent recording sessions were organized, mak-
ing a total of 12 sessions. The faces in the images were lo-
calizedmanually,croppedoutandnormalizedgeometrically
(aligned eye positions) and photometrically (histogram nor-
malization). Examples of thus prepared images of controlled,
degraded, and adverse quality are presented in Figure 3.
3.2. Speech modality data
The BANCA database provides a large amount of training
data per user : 2 files per session (about 20 seconds. each)
×2
microphones
×12 sessions. In our case, we used only the
data from microphone 1. The first 4 sessions are in “clean”
conditions, the next 4 sessions are in “degraded” condi-
tions, and the last 4 sessions are in “adverse” conditions. The
only preprocessing we perform before feature extraction is
speech/pause detection based on energy.
3.3. Bimodal protocol
While being a bimodal database, BANCA has no predefined
reference protocols for multimodal testing. However, pre-
defined protocols are provided for single modality testing
scenarios. In our experiments we make use of the P proto-
col for unimodal testing since it closely corresponds to our
assumptions about the experimental design. Namely, it in-
volves t raining the classification models using high-quality
data recorded in the controlled conditions, and testing us-
ing data acquired in the controlled as well as deteriorated
conditions. The details of the testing protocol P can be in-
spected in [13]. The protocol declares that all database data
4 EURASIP Journal on Advances in Signal Processing
Controlled
(a)
Degraded
(b)
Adverse
(c)
Figure 3: Example of the images collected in the controlled, degraded, and adverse scenarios (left to r ight) from the same individual.
have to be subdivided into two subsets, g1 and g2, consist-
ing of different users. While data from one dataset is used for
user model training and testing, the other dataset (a develop-
ment set) may be used for parameter tuning. In accord with
this directive, we use the development set to adjust the deci-
sion thresholds for the test set, but also to train the Bayesian
networks used in the reliability estimation routines. The uni-
modal protocol strictly defines the assignment of user data to
the genuine access or impostor access pools. We respect this
assignment and in order to do so reduce the amount of client
face images to one per access (as opposed to the available five)
in order to match the amount of speech data at hand. In this
way, we maintain the compatibility with the P protocol and
at the same time we overcome the problems related to the use
of the chimerical databases [8].
4. SPEAKER VERIFICATION AND QUALITY MEASURES
The speech-based classifier is trained by using training files
from session 1 as defined by the BANCA P protocol. 12 mel-
frequency cepstral coefficients with first- and second-order
time derivatives are extracted with cepstral mean normaliza-
tion. Using the ALIZE toolkit [14], a world Gaussian mix-
ture model (GMM) of 200 Gaussian components with diag-
onal covariance matrices is trained from the pooled training
features of all users. The user models are then MAP-adapted
from the world model using the user-specific training data
from session 1. When training and testing on g1, the thresh-
olds are estimated on g2 a posteriori (corresponding to the
equal error rate (EER) point), then used on g1, and vice-
versa for g2. This classifier provides the CID and Sc variables
to the reliability estimator, and its performance is consistent
with baseline GMM results available in the litterature on the
BANCA P protocol.
The signal-to-noise ratio (SNR) contains information
about the level of acoustic noise in the speech signal, which is
one of the main factors of signal quality degradation. Thus,
the quality measure used for speech is an SNR-related mea-
sure. The SNR is defined as the ratio of the average energy of
the speech signal divided by the average energy of the acous-
tic noise in dB. We perform speech/pause segmentation using
an algorithm based on the “Murphy algorithm” described in
[15]. We then assume that the average energy of pauses is a s-
sociated with that of noise. Our SNR-related quality measure
(SQM) is given by the formula
SQM
= 10 log
10
N
i=1
Is(i)s
2
(i)
N
i=1
In(i)s
2
(i)
,(2)
where
{s(i)}, i = 1, , N is the acquired speech signal con-
taining N samples, Is(i)andIn(i) are the indicator func-
tions of the current sample s(i) being speech or noise during
pauses (e.g., Is(i)
= 1ifs(i) is a speech sample, Is(i) = 0
otherwise). Other experiments with a speech quality mea-
sure using entropy-based speech/pause segmentation are de-
scribed in [12].
5. FACE VERIFICATION AND QUALITY MEASURES
In our experiments we have used a face verification scheme
implemented in a similar fashion as presented in [16]with
the decision threshold set to training EER. The images from
the BANCA database (English part) were used to build the
world model (520 images, 26 + 10 individuals (g1 or g2 sub-
sets, resp.), 384 Gaussians in the mixture). Client models
were built using world model adaptation [15]. The images
used in the experiments were cropped, photometrically nor-
malized by histogram equalization, and scaled to the size of
64
× 80 pixels. The average half-total error rate (HTER) [8]
of the used classifier is comparable to the state-of-the-art al-
gorithms [17].
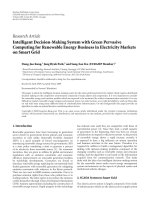
5.1. Correlation with an average face image
The goal of the relative quality measurement is to determine
to what degree the quality of the testing image departs from
that of the training images. The quality of the training images
can be modeled by creating an average face template out of all
the face images whose quality is considered as reference. We
have built an average face template using PCA reconstruc-
tion, in similar fashion as described in [16]. Specifically, we
have used the first eight averaged Eigenfaces to build the tem-
plate. Two average face templates built of images from the
BANCA database are shown in Figure 4.
For the experiments presented in this paper, we have cre-
ated two average face templates from the training images pre-
scribed by the P protocol (clients from the groups g1 and
Krzysztof Kryszczuk et al. 5
g1
(a)
g2
(b)
Figure 4: Average face template built using training images defined
in the BANCA P protocol for the datasets g1 and g2, respectively.
g2). It is noteworthy that the average face templates created
from the images of two disjoint sets of individuals are strik-
ingly similar. It is also apparent that high-resolution details
are lost, while low-frequency features, such as head pose and
illumination, are preserved. Therefore, in order to obtain a
measure of similarity of low-frequency face images, we pro-
pose to calculate the Pearson’s cross-correlation coefficient
between the face image I whose quality is under assessment,
and the respective average face template AVF:
FQM
1
= ρ(AVF, I). (3)
5.2. Image sharpness estimation
The cross-correlation with an average image gives an esti-
mate of the quality deterioration in the low-frequency fea-
tures. At the same time that measure ignores any quality de-
terioration in the upper range of spatial frequencies. The ab-
sence of high-frequency image details can be described as the
loss of image sharpness. In the case of the BANCA database,
the images collected in the degraded conditions suffer from a
significant loss of sharpness. An example of this deterioration
can be found in Figure 3. In order to estimate the sharpness
of an image I of x
× y pixels, we compute the mean of in-
tensity differences between adjacent pixels, taken in both the
vertical and horizontal directions:
FQM
2
=
1
2
1
(x − 1)y
y
m=1
x
−1
n=1
p
n,m
− p
n+1,m
+
1
(y − 1)x
y−1
m=1
x
n=1
p
n,m
− p
n,m+1
.
(4)
6. MULTIMODAL DECISION FUSION WITH
RELIABILITY INFORMATION
Figure 5 presents the schematic diagram of the system used
in our experiment. Biometric data of an individual (face im-
age and speech) are corrupted by extraneous conditions: in
the case of speech additive noise, and in the case of the face
departure from the nominal illumination and image sharp-
ness. The speech and face acquisition process consists of
all the signal-domain preprocessing and normalization steps
[6, 18] that make the speech data and face image usable for
Biometric data
Voice Face
Identity
claim
Acoustic
noise
Illumination
Speech
acquisition
Face image
acquisition
Speech
expert
Face
expert
P(MR
s
) CID
s
P(MR
f
) CID
f
Multimodal fusion
Final decision
Verification of the identity claim
Figure 5: Multimodal biometric verification system with reliability
information.
Table 1: Decision table for multimodal decision module.
Face Speech Final decision
CID
f
= 1 CID
s
= 11
CID
f
= 1 CID
s
= 0
1:ifP(MR
f
= 1) > P(MR
s
= 1),
0 : otherwise
CID
f
= 0 CID
s
= 1
1:ifP(MR
f
= 1) < P(MR
s
= 1),
0 : otherwise
CID
f
= 0 CID
s
= 00
the modality experts (see Figure 2). Each of the experts ac-
cepts two inputs: the conditioned data from the acquisition
process and the identity claim. On the output, the experts
produce verification decisions CID
f
and CID
s
(for face and
speech, resp.) and modality reliability information MR
f
and
MR
s
, on the base of w h ich the multimodal decision module
(see Table 1) returns the final verification decision.
The fusion of the verification information coming from
face and speech experts is performed using the classifier
decisions and the modality reliability data. If both experts
agree on the decision, the decision is preserved. If they are in
disagreement, the decision is taken in accordance to Table 1 .
This decision selection scheme is designed to maximize the
probability of making a correct decision.
7. EXPERIMENTAL RESULTS
We tested the performance of the unimodal experts and the
reliability they produce, as well as the use of the reliability
information in the multimodal decision-level fusion process.
6 EURASIP Journal on Advances in Signal Processing
Table 2: Decision reliability classification accuracy. All results are
in percent.
Modality acc
CA
acc
CR
acc
FA
acc
FR
acc
μ
Speech
rel
79.4 72.9 94.4 86.1 83.2
Speech
margin
51.7 55.1 100.0 97.2 76.0
Face
rel
54.7 54.5 75.6 92.7 69.4
Face
margin
48.2 67.8 75.9 78.5 67.6
7.1. Unimodal reliability on speech and face data
The baseline classifiers were trained and tested on g1 accord-
ing to protocol P. The test results on g1 were used as tr aining
data for the reliability model. Then, the baseline classifiers
were trained and tested on g2 according to protocol P, and
the test results on g2 were used as test data for the reliability
models. This procedure is repeated, inverting g1 and g2, and
the accuracies are computed as the mean of the errors for g1
and g2.
We use the classical definition of accuracy as
acc
x
=
n Correct Classifications (x)
n Samples (x)
,(5)
where x stands for correct accept (CA), correct reject (CR),
false accept (FA), or false reject (FR). Since the number of
cases of CA, CR, FA, FR is unbalanced in the training and
testing set, we also define a mean accuracy over all 4 cases as
acc
μ
=
1
4
acc
CA
+acc
CR
+acc
FA
+acc
FR
(6)
so that the reliability measure will be penalized if it performs
well only in certain cases.
As the accuracies in Tabl e 2 show, there is a large dis-
crepancy between the classification accuracy for correct de-
cisions and false decisions, in favor of false decisions. This
tendency is persistent over both modalities and both datasets
(g1 and g2). Taking into consideration the fact that the use
of a real database (BANCA) is bound to produce far more
correct than er roneous decisions, the unimodal decision rec-
tification scheme as described in [7] could not be applied.
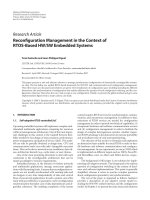
Figure 6(a) shows the relationship between the decision
reliability (reliability threshold) for each modality and the
corresponding error rates for the observations whose reli-
ability is equal or g reater than the reliability threshold, in
terms of 1-HTER. The monotonous increase of (1-HTER)
as a function of the reliability threshold shows that in-
deed a higher reliability estimate positively correlates with
the chances of making a correct classification decision. In
Figure 6(b) we show the relative count of decisions whose re-
liability is equal to or greater than the given reliability value,
as a function of the reliability threshold. Ta ble 3 gives the av-
erage reliability of both modalities. As the graphs and tabu-
lated means show, in our experiments the speech modality
was on average more reliable than the face modality.
10.90.80.70.60.50.40.30.20.10
Reliability threshold
70
75
80
85
90
95
100
1-HTER (%)
Face, g1
Face, g2
Speech, g1
Speech, g2
(a)
10.90.80.70.60.50.40.30.20.10
Reliability threshold
0
20
40
60
80
100
Relative decisions left (%)
Face, g1
Face, g2
Speech, g1
Speech, g2
(b)
Figure 6: Distribution of reliability values on the g1 and g2 datasets
for speech and face.
Table 3: Mean reliability estimates for face and speech (in percent).
Modality g1 g2 avg.
Speech 76.4 69.6 73.0
Face
51.5 54.1 52.8
7.2. Multimodal experiments
Since the work presented in this paper focuses on decision-
level fusion, all fusion experiments make use of only uni-
modal decisions obtained from the classifiers described in
Sections 4 and 5. In order to preserve compatibility with
the BANCA protocol, we report the fusion results in terms
of HTER separately for each of the datasets g1 and g2, as
well as the averaged results (g1 and g2). The theoretical limit
of the accuracy improvement achieved by multimodal fu-
sion can be expressed by computing the oracle accuracy,
that is, assuming that the correct decisions and errors of
each of the unimodal classifiers are labeled. The oracle sce-
nario therefore yields false decisions only if both of the uni-
modal classifiers were wrong. Oracle results are an efficient
way of telling the classifier errors due to data modeling im-
perfections from errors due to the inherent data problems
(e.g., nondiscriminative features). This interpretation, how-
ever, is straightforward only if both classifiers operate on
Krzysztof Kryszczuk et al. 7
Table 4: Error rates (HTER, FAR (false accept rate), FRR (false reject rate)), in percent, for speech and face baseline classifiers and for
different decision fusion methods. Conflicting classifier decisions are resolved by picking a decision F
1
at random, F
2
always from the classifier
more accurate on the training set (here-speech), F
R
according to the higher reliability estimate, F
M
according to a higher margin-derived
confidence measure, and F
O
from an oracle that always picks the classifier that makes a correct decision. Column Δ
av HTER
gives relative
performances with respect to the oracle.
g1 g2 Average(g1, g2)
HTER FAR FRR HTER FAR FRR HTER FAR FRR Δ
av HTER
Speech 9.7 17.5 1.9 8.2 3.8 12.5 8.9 10.7 7.2 21.0
Face
26.7 25.2 28.2 22.0 34.6 9.3 24.3 29.9 18.8 8.5
F
1
17.4 19.7 15.1 15.0 18.8 11.2 16.2 19.2 13.1 12.7
F
2
9.7 17.5 1.9 8.2 3.8 12.5 8.9 10.7 7.2 23.0
F
R
8.915.02.9 7.88.57.1 8.411.85.024.6
F
M
10.6 11.5 9.6 9.7 14.5 4.8 10.1 13.0 7.2 20.3
F
O
2.0 3.4 0.6 2.1 2.6 1.6 2.1 3.0 1.1 100
Table 5: Agreement statistics.
Face wins Speech wins Unanimous
g1 48 (8.8%) 102 (18.7%) 396 (72.5%)
g2
43 (7.9%) 83 (15.7%) 417 (76.4%)
the same data. Since in the case of biometric fusion the two
classifiers operate on presumably independent datasets (face
images and speech), the oracle fusion results should be rather
understood as a gauge of the fusion scheme used. The fusion
results, reported in terms of HTER and class accuracies are
collected in Table 4.
As descr ibed in Section 6, the final decision could be
unanimous, or be made upon the comparison of the modal-
ity reliability information in the case of disagreement. Table 5
shows the statistics of the decisions for the g1 and g2 groups.
7.3. Discussion
The experiments presented above confirm that the reliabil-
ity measures can be put into effective use in the fusion of
unimodal biometric verification decisions. The reliability ap-
proach outperformed the fusion scheme that uses margin-
derived confidence estimates. Decision-level fusion with
margin-derived confidence measures proved to be an unsuc-
cessful attempt altogether since the accuracies expressed in
terms of 1-HTER were lower than those of the accuracies
yielded by the speech modality alone. This result should be
attributed to the fact that margin estimates are very sensitive
to the relative shift of the development and testing distribu-
tions. The reliability estimates proved to be more robust to
this effect, due to the use of the quality measures in the es-
timation process. The average fusion accuracy is superior to
any of the unimodal approaches, and the accuracies for the
datasets g1 and g2 are higher than that of the speech modal-
ity alone. However, the proposed fusion scheme is still far
from perfect since it only reduced the gap b etween the best
unimodal results and the hypothetical oracle-fusion results.
In order to further diminish this difference, more sophis-
ticated signal quality measures should be investigated, and
score-based fusion schemes ought to be employed. It must
be noted here that the speech part of the BANCA database
does not offer similar qualitative spectrum of signals as the
face part, few samples are of really decreased quality. This fact
has its reflection in the plots of reliability estimates shown
in Figure 6. Since on average speech-based decisions were la-
beled as more reliable, the fusion algorithm ra rely made use
of less reliable face data (see Table 5), and consequently the
fusion results sport a limited improvement over speech re-
sults alone. It can be expected that given classification results
of comparable reliability the proposed scheme would show a
more pronounced improvement in fusion accuracy.
8. CONCLUSIONS
In this paper, we have demonstrated a method of per-
forming multimodal fusion using unimodal classifier data,
signal quality measures, and reliability estimates. We have
shown on the example of face and speech modalities that
the proposed method can be effectively applied to multi-
modal biometric fusion. Thanks to the use of the auxil-
iary quality information in the graphical model we managed
toachieveanimprovedrobustnesstodegradedsignalcon-
ditions. We evaluated our method on a standard biomet-
ric multimodal database (BANCA), and compared the re-
sults of the proposed method to state-of-the-art approach of
computing classification confidence margins. The proposed
method based on reliability measures proved to outperform
the alternative approaches.
ACKNOWLEDGMENT
This work was partly supported by the Swiss National Centre
of Competence in Research IM2.MPR.
REFERENCES
[1] J.Short,J.Kittler,andK.Messer,“Acomparisonofphotomet-
ric normalisation algorithms for face verification,” in Proceed-
ings of the 6th IEEE International Conference on Automatic Face
8 EURASIP Journal on Advances in Signal Processing
and Gesture Recognition (FGR ’04), pp. 254–259, Seoul, South
Korea, May 2004.
[2] C. Barras and J L. Gauvain, “Feature and score normalization
for speaker verification of cellular data,” in Proceedings of IEEE
International Conference on Acoustics, Speech, and Signal Pro-
cessing (ICASSP ’03), vol. 2, pp. 49–52, Hong Kong, April 2003.
[3] A. Ross, A. K. Jain, and J Z. Qian, “Information fusion in
biometrics,” in Proceedings of the 3rd International Conference
on Audio- and Video-Based Biometric Person Authentication
(AVBPA ’01), pp. 354–359, Halmstad, Sweden, June 2001.
[4] F. Roli, J. Kittler, G. Fumera, and D. Muntoni, “An experimen-
tal comparison of classifier fusion rules for multimodal per-
sonal identity verification systems,” in Proceedings of the 3rd
International Workshop Multiple Classifier Systems (MCS ’02),
pp. 325–336, Cagliari, Italy, June 2002.
[5] J. Bigun, J. Fierrez-Aguilar, J. Ortega-Garcia, and J. Gonzalez-
Rodriguez, “Multimodal biometric authentication using qual-
ity signals in mobile communications,” in Proceedings of the
12th International Conference on Image Analysis and Processing
(ICIAP ’03), pp. 2–11, Mantova, Italy, September 2003.
[6] J. Richiardi, P. Prodanov, and A. Drygajlo, “A probabilis-
tic measure of modality reliability in speaker verification,”
in Proceedings of IEEE International Conference on Acoustics,
Speech, and Signal Processing (ICASSP ’05), vol. 1, pp. 709–712,
Philadelphia, Pa, USA, March 2005.
[7] K. Kryszczuk, J. Richiardi, P. Prodanov, and A. Drygajlo, “Er-
ror handling in multimodal biometric systems using reliabil-
ity measures,” in Proceedings of the 13th European Signal Pro-
cessing Conference (EUSIPCO ’05), Antalya, Turkey, September
2005.
[8] N. Poh and S. Bengio, “Improving fusion with margin-derived
confidence in biometric authentication tasks,” in Proceedings
of the 5th International Conference on Audio- and Video-Based
Biometric Person Authentication (AVBPA ’05), pp. 474–483,
Hilton Rye Town, NY, USA, July 2005.
[9] N. Br
¨
ummer and J. du Preez, “Application-independent eval-
uation of speaker detection,” Computer Speech & Language,
vol. 20, no. 2-3, pp. 230–275, 2006.
[10] C. Fredouille, J F. Bonastre, and T. Merlin, “Similarity nor-
malization method based on world model and a posteriori
probability for speaker verification,” in Proceedings of the 6th
European Conference on Speech Communication and Technol-
og y (EUROSPEECH ’99), pp. 983–986, Budapest, Hungary,
September 1999.
[11] K. Murphy, Dynamic Bayesian networks: representation, infer-
ence and learning, Ph.D. thesis, Computer Science Division,
University of California - Berkeley, Berkeley, Calif, USA, July
2002.
[12] J. Richiardi, P. Prodanov, and A. Drygajlo, “Speaker verifica-
tion with confidence and reliability measures,” in Proceedings
of IEEE International Conference on Acoustics, Speech, and Sig-
nal Processing (ICASSP ’06), vol. 1, pp. 641–644, Toulouse,
France, May 2006.
[13] E. Bailly-Bailli
´
ere, S. Bengio, F. Bimbot, et al., “The BANCA
database and evaluation protocol,” in Proceedings of the 4th In-
ternat ional Conference on Audio- and Video-Based Biometric
Person Authentication (AVBPA ’03), J. Kittler and M. Nixon,
Eds., vol. 2688 of Lecture Notes in Computer Scie nce, pp. 625–
638, Guildford, UK, June 2003.
[14] J F. Bonastre, F. Wils, and S. Meignier, “ALIZE, a free toolkit
for speaker recognition,” in Proceedings of IEEE Interna-
tional Conference on Acoustics, Speech, and Signal Processing
(ICASSP ’05), vol. 1, pp. 737–740, Philadelphia, Pa, USA,
March 2005.
[15] D. Reynolds, A Gaussian mixture modeling approach to text-
independent speaker identification, Ph.D. thesis, Georgia Insti-
tute of Technology, Atlanta, Ga, USA, 1992.
[16] K. Kryszczuk and A. Drygajlo, “On face image quality mea-
sures,” in Proceedings of the 2nd Workshop on Multimodal User
Authentication
, Toulouse, France, May 2006.
[17] K. Messer, J. Kittler, M. Sadeghi, et al., “Face authentica-
tion competition on the BANCA database,” in Proceedings of
the 1st International Conference on Biometric Authentication
(ICBA ’04), pp. 8–15, Hong Kong, July 2004.
[18] C. Sanderson and S. Bengio, “Robust features for frontal face
authentication in difficult image conditions,” in Proceedings of
the 4th International Conference on Audio- and Video-Based
Biometric Person Authentication (AVBPA ’03), pp. 495–504,
Guildford, UK, June 2003.
Krzysztof Kryszczuk is a Ph.D. candidate
at the Signal Processing Institute, Swiss
Federal Institute of Technology Lausanne
(EPFL). Before joining EPFL he was a Re-
search Engineer at the National University
of Singapore. He obtained his M.S. degree
in psychology (cognitive systems engineer-
ing) from the Rensselaer Polytechnic Insti-
tute in 2001, and the M.S. degree in electri-
cal engineering from the Lublin Institute of
Technology in 1999. His research interests include statistical pattern
recognition, image processing, biometrics, and human-machine
interactions.
Jonas Richiardi received the B.Eng. (Hons)
degree in electronic engineering with first
class honours from the University of Essex,
UK, in 2001. He received the M.Phil. degree
in computer speech, text, and internet tech-
nology from the University of Cambridge,
UK, in 2002. He is currently pursuing the
Ph.D. degree at Signal Processing Institute
of the Swiss Federal Institute of Technology,
Lausanne, Switzerland. He is a member of
the IEEE and of the ISCA (International Speech Communication
Association). His research interests include probabilistic model-
ing, classifier combination, graphical models, handwritten signa-
ture verification, and speech processing.
Plamen Prodanov wasborninVarnaBul-
garia, where he received his M.S. degree in
telecommunications in 1998 at the Tech-
nical University of Varna, Bulgaria. After
his graduation, he spent two years in the
industry, working for radar development
projects in the Signal Processing Labora-
tory at Cherno More Co. in Varna. Then he
joined the Swiss Federal Institute of Tech-
nology, Lausanne (EPFL). From 2002 till
2006 he did a Ph.D. thesis titled “Error Handling in Multimodal
Voice-Enabled Interfaces of Tour-Guide Robots Using Graphical
Models” in the Speech Processing and Biometrics Group, EPFL.
Since September 2006, he has joined the team of TBS Holding AG,
where he is employed as a Research Engineer in the domain of 3D
fingerprint recognition.
Krzysztof Kryszczuk et al. 9
Andrzej Drygajlo is the head of the Speech
Processing and Biometrics Group at the
Swiss Federal Institute of Technology at
Lausanne (EPFL), where he conducts re-
search on technological, methodological,
and legal aspects of biometrics for secu-
rity and forensic applications. In 1993 he
created the EPFL Speech Processing Group
(GTP) and then the EPFL Speech Process-
ing and Biometrics Group (GTPB) and Bio-
metrics Centre Lausanne. His research interests include biomet-
rics, speech processing, and man-machine communication appli-
cations. He conducts research and teaches at the School of Engi-
neering in EPFL and at the School of Criminal Sciences in the Uni-
versity of Lausanne. He p articipates in and coordinates numerous
national and international projects and is member of various sci-
entific committees. Among ongoing European research projects,
the most relevant are the Network o f Ex cellence “BioSecure” and
COST 2101 Action “Biometrics for Identity Documents and Smart
Cards.” Recently, he has been elected as a Chairman of the COST
2101 Action. Dr. Drygajlo has been an advisor of numerous Ph.D.
theses. He is the author/co-author of more than 100 research pub-
lications, including several book chapters, together with his own
book. He is a member of the IEEE, EURASIP (European Associa-
tion for Signal Processing) and ISCA (International Speech Com-
munication Association) professional groups.