Báo cáo hóa học: " Performance Evaluation of Important Ad Hoc Network Protocols" potx
Bạn đang xem bản rút gọn của tài liệu. Xem và tải ngay bản đầy đủ của tài liệu tại đây (1.35 MB, 11 trang )
Hindawi Publishing Corporation
EURASIP Journal on Wireless Communications and Networking
Volume 2006, Article ID 78645, Pages 1–11
DOI 10.1155/WCN/2006/78645
Performance Evaluation of Important Ad Hoc
Network Protocols
S. Ahmed and M. S. Alam
Department of Electrical and Computer Engineering, University of South Alabama, Mobile, AL 36688-0002, USA
Received 15 July 2005; Accepted 12 December 2005
A wireless ad hoc network is a collection of specific infrastructureless mobile nodes forming a temporary network without any
centralized administration. A user can move anytime in an ad hoc scenario and, as a result, such a network needs to have routing
protocols which can adopt dynamically changing topology. To accomplish this, a number of ad hoc routing protocols have been
proposed and implemented, which include dynamic source routing (DSR), ad hoc on-demand distance vector (AODV) routing,
and temporally ordered routing algorithm (TORA). Although considerable amount of simulation work has been done to measure
the performance of these routing protocols, due to the constant changing nature of these protocols, a new performance evaluation
is essential. Accordingly, in this paper, we analyze the perfor mance differentials to compare the above-mentioned commonly used
ad hoc network routing protocols. We also analyzed the performance over varying loads for each of these protocols using OPNET
Modeler 10.5. Our findings show that for specific differentials, TORA shows better performance over the two on-demand protocols,
that is, DSR and AODV. Our findings are expected to lead to further performance improvements of various ad hoc networks in
the future.
Copyright © 2006 S. Ahmed and M. S. Alam. This is an open access article dist ributed under the Creative Commons Attribution
License, which permits unrestricted use, distribution, and reproduction in any medium, provided the original work is properly
cited.
1. INTRODUCTION
A collection of autonomous nodes or terminals that commu-
nicate with each other by forming a multihop radio network
and maintaining connectivity in a decentralized manner is
called an ad hoc network. There is no static infrastructure
for the network, such as a server or a base station. The idea
of such networking is to support robust and efficient oper-
ation in mobile wireless networks by incorporating routing
functionality into mobile nodes.
Figure 1 shows an example of an ad hoc network, where
there are numerous combinations of transmission areas for
different nodes. From the source node to the destination
node, there can be different p aths of connection at a given
point of time. But each node usually has a limited area of
transmission as shown in Figure 1 by the oval circle around
each node. A source can only transmit data to node B,butB
can transmit data either to C or D. It is a challenging task
to choose a really good route to establish the connection
between a source and a destination so that they can roam
around and transmit robust communication.
There are four major ad hoc routing protocols. At this
time, OPNET has three built-in models for DSR, AODV, and
TORA ad hoc routing protocols. The other major protocol is
destination sequence distance vector (DSDV). All these pro-
tocols are constantly being improved by IETF [1]. As a result,
a comprehensive performance evaluation is of ad hoc routing
protocols essential. In this work, OPNET Modeler 10.5 ver-
sion is used to simulate three ad hoc routing protocols, that
is, DSR, AODV, and TORA. We evaluated all available met-
rics supported by OPNET for these protocols and then per-
formed a comparative performance evaluation. Since these
protocols have different characteristics, the comparison of
all performance differentials is not always possible. However,
the following system parameters are utilized for comparative
study on the protocols:
(i) number of hops per route,
(ii) traffic received and sent,
(iii) route discovery time,
(iv) total route requests sent,
(v) total route replies sent,
(vi) control traffic received and sent,
(vii) data traffic received and sent,
(viii) retransmission attempts,
(ix) average power,
(x) throughput,
(xi) utilization.
2 EURASIP Journal on Wireless Communications and Networking
Source
B
C
D
E
Destination
Figure 1: Ad hoc networking example.
To the best of our knowledge, no published work is avail-
able in the literature, which compares as many criteria as
we have done in this research. Moreover, this work is the
first major comprehensive performance evaluation of ad hoc
routing protocols using OPNET Modeler 10.5. We also simu-
lated these protocols under different loads (number of nodes
in a network) and showed their corresponding performance
differences.
The rest of the paper is organized as follows. In the fol-
lowing section, we briefly review the TORA, DSR, and AODV
protocols. In Section 3, we present the performance metrics
of our simulation. Section 4 discusses performance compar-
ison of the protocols. Section 5 presents the result of sim-
ulation under various loads. We draw our conclusions in
Section 6 followed by recommendations for future work in
this regard.
2. AD HOC ROUTING PROTOCOLS
Among the various ad hoc routing protocols proposed in the
literature [1, 2], TORA, DSR, and AODV appear to be the
most promising. TORA [3, 4] is a distributed routing proto-
col for ad hoc networks, which uses a link reversal algorithm.
TORA performs the routing portion of the protocol but de-
pends for other functions on the internet MANET encapsu-
lation protocol (IMEP) [5, 6]. A few important characteris-
tics of TORA are listed below:
(i) it is an adaptive protocol, that is, it finds out routes
when required,
(ii) it reacts minimally to topological changes and thus
minimizes the communication overhead,
(iii) for any message, TORA ensures to provide more than
one route to destination,
(iv) routes are not necessarily optimal,
(v) it uses a loop-free algorithm for routing,
(vi) it is a fast route finder algorithm,
(vii) it is more scalable.
TORA involves four major functions: creating, maintaining,
erasing, and optimizing routes [7–9]. To create a route, it se-
lects the height of each node in a way that leads to the
creation of a directed sequence of links up to the destina-
tion. Since it is an ad hoc network, there will be considerable
topological changes. Maintaining routes in reaction to such a
change is a major task. Since every node must have a height,
any node which does not have a height is considered as an
erased node. By making the height as null, the routing pro-
tocol performs that j ob. Sometimes the routers are given new
heights to improve the linking structure. This function is
called the optimization of routes.
The foremost feature of the DSR protocol [1, 10, 11]is
that it uses source routing. It is also an on-demand protocol
thatallowsnodestofindoutarouteoveranetworkdynam-
ically. The interesting idea behind source routing is that all
the packet headers of DSR contain a complete list of nodes
through which they will pass to reach their destination. As a
result, there is no route discovery mechanism of broadcasting
packets in DSR. This reduces network bandwidth overhead.
However, if there is a better route, the nodes update their
route cache. DSR has two modes of operations: route dis-
covery and route maintenance [9].
The AODV algorithm [12] is a confluence of both DSR
and destination sequenced distance vector (DSDV) [13]pro-
tocols. It shares on-demand characteristics of DSR, and adds
the hop-by-hop routing, sequence numbers, and periodic
beacons from DSDV. It has the ability to quickly adapt to
dynamic link conditions with low processing and memory
overhead. AODV offers low network utilization and uses des-
tination sequence number to ensure loop freedom. It is a re-
active protocol implying that it requests a route when needed
and it does not maintain routes for those nodes that do not
actively participate in a communication. An important fea-
ture of AODV is that it uses a destination sequence number,
which corresponds to a destination node that was requested
by a routing sender node. The destination itself provides the
number along with the route it has to take to reach from the
request sender node up to the destination. If there are multi-
ple routes from a request sender to a destination, the sender
takes the route with a higher sequence number. This ensures
that the ad hoc network protocol remains loop-free. AODV
keeps the following information with each route table entry
[12]:
(i) destination IP address (IP address for the destination
node),
(ii) destination sequence number,
(iii) valid destination sequence number flag,
(iv) network interface,
(v) hop count, that is, number of hops required to reach
the destination,
(vi) next hop (the next valid node that did not rebroadcast
the RREQ message),
(vii) list of precursor,
(viii) lifetime, that is, expiration or deletion time of a route.
3. PERFORMANCE METRICS
We evaluated key performance metrics for three different ap-
plications using DSR, TORA, and AODV protocols, which
includes wireless LAN, radio receiver, and radio transmit-
ter. The effects of load variation on different protocols
were also investigated. The parameters used for wireless LAN
S. Ahmed and M. S. Alam 3
Mobile nodes
Mobile nodes
1
2
3
4
5
6
7
8
9
10
2345678910
Figure 2: A setup model of the ad hoc network protocol simulation.
application performance evaluation include: control traffic
received and sent, data traffic received and sent, through-
put, and retr ansmission attempts. We evaluated radio re-
ceiver and radio transmitter applications using the follow-
ing parameters: utilization, throughput, and average power.
We used the following parameters for evaluating the effect
of load variation on different protocols: routing trafficre-
ceived and sent, total traffic received and sent, number of
hops, route discovery time, and ULP traffic received and sent.
4. PERFORMANCE COMPARISON OF THE PROTOCOLS
For performance evaluation of different protocols, the latest
version of OPNET was u sed, which supports DSR, TORA,
and AODV protocols. For all simulations, the same move-
ment models were used, and the number of trafficsources
was fixed at 40. Figure 2 shows a model of nodes used to sim-
ulate different ad hoc network protocols. A square of 10 me-
ters is used to define the area of node’s mobility. We used a
mobility model of var iable trajectory.
In the simulation, the following parameters are used:
(i) duration: 20 minutes,
(ii) speed: 128, 256, 512,
(iii) values per statistics: 100,
(iv) update interval: 100000,
(v) nodes: 40,
(vi) simulation kernel: based on “kernel-type” preference
(development).
4.1. Wireless LAN
Figure 3 shows the control traffic received in packets/s for
DSR, TORA, and AODV protocols for a wireless LAN ap-
plication. Figure 2 shows that the TORA protocol performs
better than the other two. Although AODV does not perform
well at the beginning, later it does well. DSR’s performance
remains average during the entire evaluation time. Figure 4
shows the control traffic sent in packets/sec. It is obvious that
TORA performs better than AODV and DSR. Although DSR
1400120010008006004002000
Time (s)
−0.5
0
0.5
1
1.5
2
2.5
3
3.5
4
Control traffic received (packets/s)
DSR
TORA
AODV
Figure 3: Control trafficreceivedfordifferent protocols in wireless
LAN.
1400120010008006004002000
Time (s)
−0.5
0
0.5
1
1.5
2
2.5
Control traffic sent (packets/s)
DSR
TORA
AODV
Figure 4: Control trafficsentfordifferent protocols in wireless
LAN.
and AODV have shown an average perfor mance throughout
the entire simulation, they show better performance com-
pared to TORA at the end. TORA uses a fast router-finder
algorithm, which is critical for TORA’s better performance.
Both DSR and AODV have to go through route creation us-
ing RREQ and RREP messages. Once the routes are created,
DSR and AODV tend to do better than TORA. As a result,
we observe from Figures 3 and 4 that, near the end of simu-
lation time, both AODV and DSR show better performance
than TORA.
4 EURASIP Journal on Wireless Communications and Networking
1400120010008006004002000
Time (s)
−1
0
1
2
3
4
5
6
7
8
Data traffic received (packets/s)
DSR
TORA
AODV
Figure 5: Data trafficreceivedfordifferent protocols in wireless
LAN.
Figures 5 and 6 show the data traffic received and data
traffic sent in packets/sec, respectively, for DSR, AODV, and
TORA protocols. From Figure 5, it is evident that, at the be-
ginning of the simulation TORA appears to dominate over
AODV and DSR, but at the end, AODV yields the best re-
sult. DSR shows poor performance and the traffic remains
always at the lower level, w hereas AODV performs well most
of the time. In Figure 6, we observe that TORA performs well
during most of the simulation time. AODV shows consistent
performance and peaks at the end of the simulation. DSR
does not show any positive traffic except for the last few sec-
onds of the simulation.
Figure 7 shows the throughput in bits/sec for DSR,
TORA, and AODV protocols, where AODV shows signif-
icantly better performance than the other two, and TORA
performs slightly better than DSR. Figure 8 shows the re-
transmission attempts in packets/sec as a function of time
for wireless LAN involving different protocols. It is evident
from Figure 8 that TORA requires a lot of retransmission
attempts before it can successfully transmit data due to the
fact that only TORA uses UPD packet. When a node first gets
a QRY message for a destination, if it does not have a route
for the requested destination, it broadcasts a UPD message
and increases the height of the node. In this way, it tries to
transmit the UPD message until it gets the destination node.
DSR and AODV have almost the same logic to find a route
and show almost similar performance near the end of the
simulation time.
4.2. Radio receiver
Figure 9 shows the radio receiver utilization of DSR, TORA,
and AODV protocols for channel bandwidth. From Figure 9,
we observe a high network utilization (full usage of channel
bandwidth) for AODV. This may be due to the storage of a
large amount of information with each table entry. TORA
1400120010008006004002000
Time (s)
−1
0
1
2
3
4
5
6
Data traffic sent (packets/s)
DSR
TORA
AODV
Figure 6: Data trafficsentfordifferent protocols in wireless LAN.
1400120010008006004002000
Time (s)
−500
0
500
1000
1500
2000
2500
3000
3500
4000
4500
Throughput (bits/s)
DSR
TORA
AODV
Figure 7: Throughput of different protocols in wireless LAN.
shows consistent performance in the range of 0.25 (1/4th us-
age of channel bandwidth) due to the reason of route dis-
covery algorithm. Since there is no mechanism of route dis-
covery broadcasting packets in DSR, the network bandwidth
utilization is reduced. At the beginning , DSR reaches 1 (full
usage of channel bandwidth), then it remains at 0 (no usage)
for a considerable amount of time. For the last half of simula-
tion time, it shows a performance of about 0.75 (3/4th usage
of channel bandwidth).
Figure 10 shows the throughput in packets/sec for differ-
ent MANET protocols, which shows that for average number
of packets received by the receiver, the TORA protocol shows
good performance followed by AODV and DSR. Although
AODV shows consistent performance, DSR shows inconsis-
tency . Figure 11 shows the average power for radio receivers
S. Ahmed and M. S. Alam 5
1400120010008006004002000
Time (s)
0
5
10
15
20
25
30
35
40
Retransmission attempts (packets)
DSR
TORA
AODV
Figure 8: Retransmission attempts for different protocols in wire-
less LAN.
1400120010008006004002000
Time (s)
−0.5
0
0.5
1
1.5
2
2.5
3
Radio receiver utilization (packets)
DSR
TORA
AODV
Figure 9: Radio receiver utilization for different protocols in wire-
less LAN.
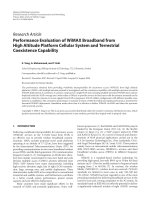
using DSR, TORA, and AODV protocols. The average power
of a packet arriving at a receiver channel is so low that it
could not be show n in the graph. However, a snapshot of the
OPNET screen is shown in Figure 11, where the y-axis repre-
sents the power (in joules) and the x-axis represents the sim-
ulation time (in minutes). It is evident that DSR shows better
performance compared to TORA and AODV. DSR shows al-
most similar average power over the entire simulation time.
However, for TORA and AODV, the average power increases
after a considerable amount of time and then it remains al-
most constant.
1400120010008006004002000
Time (sec)
−2
0
2
4
6
8
10
12
14
Radio receiver throughput (packets)
DSR
TORA
AODV
Figure 10: Radio receiver throughput for different protocols in
wireless LAN.
4.3. Radio transmitter
Figure 12 shows the radio transmitter utilization for DSR,
AODV, and TORA protocols. TORA uses a lot of packets
to create, maintain, erase, and optimize routes for the ra-
dio transmitter link. As a result, TORA performs better than
AODV and DSR for most of the simulation time except at
the end when AODV outperforms TORA. AODV shows con-
sistent performance after 200 simulated seconds. However,
DSR shows a spike at the end of the simulation and remains
at the zero level for most of the earlier portion of simula-
tion time. The behavior of AODV and DSR are consistent
with the fact that once routes are created, the utilization of
radio channel remains high for node communication. For
transmitter utilization, radio transmitter throughput also
shows the same t ype of performance. Figure 13 displays the
throughput for different protocols, where TORA shows a lot
of spikes throughout the entire simulation time. However,
TORA shows better throughput over DSR and AODV except
at the end when AODV exceeds TORA. AODV shows consis-
tent performance for most of the time and DSR remains at
zero until the end of simulation time.
5. EFFECT OF LOAD VARIATION
To study the effect of load (number of nodes in a network)
variation, the following number of nodes were used to evalu-
ate the performance of the different protocols: 20, 40, and 80.
For some cases, we used 40, 80, and 100 nodes to achieve bet-
ter statistical results for a few characteristics. Figures 14 and
15 show the routing traffic received and routing trafficsent
in packets/sec, respectively, for different loads using the DSR
algorithm. Figures 14 and 15 show that the whole network is
very sensitive towards load variation. However, in case of 20
and 40 nodes, the difference is minor. Figures 16 and 17 show
6 EURASIP Journal on Wireless Communications and Networking
0.0000000000
My
MANET DSR 40 nodes
My
MANET TORA 30 nodes
My
MANET AODV 40 nodes
Figure 11: Average power for different protocols in wireless LAN.
1400120010008006004002000
Time (s)
−0.1
0
0.1
0.2
0.3
0.4
0.5
0.6
0.7
Radio transmitter utilization (packets)
DSR
TORA
AODV
Figure 12: Radio transmitter utilization for di fferent protocols in
wireless LAN.
the total trafficreceivedandtotaltraffic sent in packets/sec,
respectively , for different loads in DSR protocol. In Figures 16
and 17, we observe the same phenomenon, that is, the whole
network increases its usage of trafficreceivedandtrafficsent
as the load increases. As the number of nodes increases, the
performance of the protocols is highly affected. One possi-
ble reason may be due to the broadcasting of RREQ mes-
sage during route discovery. DSR creates RREQ packets and
broadcasts the RREQ to all the neighbors. In a network of
80 nodes, the number of total neighbors of a particular node
1400120010008006004002000
Time (s)
−1
0
1
2
3
4
5
6
7
Radio transmitter throughput (packets)
DSR
TORA
AODV
Figure 13: Radio transmitter throughput for different protocols in
wireless LAN.
is always higher than that of a network involving 20 or 40
nodes. As a result, the routing traffic received and routing
traffic sent is higher in a network of 80 nodes compared to
40 or 20 nodes.
Figure 18 shows the performance characteristics of the
DSR algorithm in terms of the number of hops per route as
a function of time involving 40, 80, and 100 nodes. Figure 19
shows route discovery time for all destinations as a func-
tion of time (in seconds) for DSR protocols under various
loads. From Figures 18 and 19,weobservethateachnetwork
S. Ahmed and M. S. Alam 7
1400120010008006004002000
Time (s)
−5
0
5
10
15
20
25
30
35
40
45
Routing traffic received (packets/s)
20 nodes
40 nodes
80 nodes
Figure 14: Routing traffic received for DSR protocols under various
loads.
1400120010008006004002000
Time (s)
−5
0
5
10
15
20
25
30
Routing traffic sent (packets/s)
20 nodes
40 nodes
80 nodes
Figure 15: Routing traffic sent for DSR protocols under various
loads.
behaves in a similar manner regardless of the number of
nodes. DSR keeps a cache of the entire destination in a packet
header. As a result, even if the number of nodes changes, the
characteristics of keeping a large cache of destination nodes
do not change. Hence, we get similar performance for differ-
ent loads.
We also investigated the effect of different loads on TORA
protocol perfor mance by changing the number of nodes to
40, 80, and 100, respectively. Figures 20, 21, 22,and23
show the performance characteristics of IMEP control traf-
fic received, IMEP control traffic sent, IMEP ULP trafficre-
ceived, and IMEP ULP traffic sent, respectively, for the TORA
1400120010008006004002000
Time (s)
−10
0
10
20
30
40
50
60
Tota l t ra ffic received (packets/s)
40 nodes
80 nodes
100 nodes
Figure 16: Total traffic received for DSR protocols under various
loads.
1400120010008006004002000
Time (s)
−5
0
5
10
15
20
25
30
35
40
Tota l t ra ffic sent (packets/s)
40 nodes
80 nodes
100 nodes
Figure 17: Total traffic sent for DSR protocols under various loads.
protocol for different loads. It is obvious that the character-
istics vary a lot due to the difference in loads. The differences
are mainly due to the number of packets TORA uses to create
and maintain routes. TORA uses query and update packets
to create routes. Moreover, for any message, TORA provides
more than one route to a destination, which requires a lot of
control overhead. For large number of nodes, these control
messages are higher than those of lower numbers of nodes,
thus exhibiting a difference between their respective charac-
teristics.
Next, we investigated the effect of different loads (40, 60,
and 80 nodes) on AODV protocol performance. Figures 24
8 EURASIP Journal on Wireless Communications and Networking
1400120010008006004002000
Time (s)
0
2
4
6
8
10
12
Number of hops per route
40 nodes
80 nodes
100 nodes
Figure 18: Number of hops for DSR protocols under various loads.
1400120010008006004002000
Time (s)
0
0.005
0.01
0.015
0.02
0.025
0.03
0.035
0.04
Route discovery time to all destinations (s)
40 nodes
80 nodes
100 nodes
Figure 19: Route discovery time for DSR protocols under various
loads.
and 25 show AODV performance of routing trafficsentand
routing trafficreceived,fordifferent loads, respectively. We
observe that the number of packets received and sent per
second increases with incremental load increase. This is due
to the route cache AODV uses for creating and maintaining
routes. AODV keeps a large amount of data in routing cache,
which increases with the increase in the number of nodes in
a network. However, at the beginning all networks, regard-
less of load, take a few moments to set up the network before
starting routing traffic. Therefore, we see almost zero perfor-
mance for al l loads in the initial time period.
Figure 26 shows AODV protocol performance for route
discovery time (in packets/sec) for different loads. None of
1400120010008006004002000
Time (s)
0
20
40
60
80
100
120
140
160
180
200
Tota l t ra ffic received (packets/s)
40 nodes
80 nodes
100 nodes
Figure 20: Total traffic received for TORA protocols under various
loads.
1400120010008006004002000
Time (s)
0
20
40
60
80
100
120
140
160
180
200
Tota l t ra ffic sent (packets/s)
40 nodes
80 nodes
100 nodes
Figure 21: Total traffic sent for TORA protocols under various
loads.
the networks show any similar character istics. This is due
to the algorithm AODV uses for routing. Since AODV uses
the joint algorithm of DSR and DSDV, it takes hop-by-hop
routing from DSDV. Usage of the Bellman-Ford algorithm
in DSDV [13] ensures that each router provides its routing
information to its neighbors. For any network size, the re-
ceiving router picks the routing information which has the
lowest cost in terms of the shortest path and rebroadcasts it.
This algorithm works efficiently no matter how large the net-
work is. Hence, we do not find any dependence of route dis-
covery time on the number of loads.
Figure 27 shows the performance of the AODV protocol
in terms of the number of hops per route as a function of
S. Ahmed and M. S. Alam 9
1400120010008006004002000
Time (s)
−20
0
20
40
60
80
100
120
140
160
180
ULP traffic received (packets/s)
40 nodes
80 nodes
100 nodes
Figure 22: ULP traffic received for TORA protocols under various
loads.
1400120010008006004002000
Time (s)
−5
0
5
10
15
20
25
30
35
40
45
ULP traffic sent (packets/s)
40 nodes
80 nodes
100 nodes
Figure 23: ULP traffic sent for TORA protocols under various
loads.
time for different loads. It is clear that none of the different
sized networks have significantly different characteristics. It
is due to the hop count entry used in each AODV route table.
With each route table entry, AODV keeps the information
on the number of hops required to reach destination, as well
as, the next valid hop w h ich increases with the increment of
number of loads in the network.
6. CONCLUSION
This work is the first attempt towards a comprehensive per-
formance evaluation of three commonly used mobile ad hoc
1400120010008006004002000
Time (s)
−10
0
10
20
30
40
50
60
70
80
90
Routing traffic sent (packets/s)
40 nodes
60 nodes
80 nodes
Figure 24: Routing traffic sent for AODV protocols under various
loads.
1400120010008006004002000
Time (s)
−50
0
50
100
150
200
250
300
350
Routing traffic received (packets/s)
40 nodes
60 nodes
80 nodes
Figure 25: Routing traffic received for AODV protocols under var-
ious loads.
routing protocols (DSR, TORA, and AODV). Over the past
few years, new standards have been introduced to enhance
the capabilities of ad hoc routing protocols. As a result, ad
hoc networking has been receiving much attention from the
wireless research community.
In this paper, using the latest simulation environment
(OPNET Modeler 10.5), we evaluated the performance of
three widely used ad hoc network routing protocols using
packet-level simulation. The simulation characteristics used
in this research, that is, the control traffic received a nd sent,
data traffic received, throughput, retransmission attempts,
utilization, average power, route discovery time, and ULP
10 EURASIP Journal on Wireless Communications and Networking
1400120010008006004002000
Time (s)
−0.2
0
0.2
0.4
0.6
0.8
1
1.2
1.4
Route discovery time (packets/s)
40 nodes
60 nodes
80 nodes
Figure 26: Route discovery time for AODV protocols under various
loads.
1400120010008006004002000
Time (s)
0
1
2
3
4
5
6
Number of hops
40 nodes
60 nodes
80 nodes
Figure 27: Number of hops per route for AODV protocols under
various loads.
traffic received, are unique in nature, and are very impor-
tant for detailed performance evaluation of any networking
protocol.
Performance evaluation results for some ad hoc network
protocols were previously reported [1, 14], which primar-
ily covered the impact of the fraction of packets delivered,
end-to-end delay, routing load, successful packet delivery,
and control packets overhead. In our work, we perform a
thorough analysis that includes additional important perfor-
mance parameters.
For comparative performance analysis, we first simulated
each protocol for ad hoc networks with 40 nodes. In case
of wireless LAN, TORA shows good performance for the
control traffic received, control traffic sent, and data traf-
fic sent. However, AODV shows better performance for data
traffic received and throughput. DSR and AODV show poor
performance as compared to TORA for the control traffic
sent and throughput. However, TORA and AODV show an
average level of performance for the data trafficreceivedand
data traffic sent, respectively.
In case of radio receiver performance evaluation, TORA
shows better performance for successful transmission of
packets, while AODV shows better channel utilization. DSR
shows an average level of performance in both power and
channel utilization over time. AODV shows average results
in case of throughput performance. For radio transmitter,
TORA shows better performance for both utilization and
throughput measure, whereas AODV shows average perfor-
mance, and DSR shows poor performance. To determine
how different protocols perform under increased loads, we
tested all protocols for three different scenarios (40, 80, and
100 nodes). For DSR, the number of packets in routing traf-
fic received and sent, as well as the number of packets in total
traffic received and sent, increase with increasing load. How-
ever, for route discovery time and the number of hops per
route, the performance depends primarily on the algorithm
rather than on the load. For TORA, the number of packets in
control traffic received and sent, as well as in ULP trafficre-
ceived and sent, increases with the increment of loads. In the
case of AODV, varying the number of nodes has no effect on
the number of hops per route or route discovery time. How-
ever, it is a significant factor for routing trafficreceivedand
routing trafficsent.
Ad hoc network routing is a new area of research, and
recommended standards are published almost every month.
Recommendations for future studies that can improve the re-
liability of this kind of work include the following.
(i) We only studied a network of m oderate size due to lim-
itations of the simulator. Increasing loads up to a few
hundreds of nodes could provide strength in terms of
real-life applications.
(ii) This study included only one mobility model through-
out the simulation. Different mobility models may give
different results for ad hoc routing protocols. Future
studies should measure performance parameters based
upon different mobility models.
(iii) A simulation model that includes performance relative
to security issues could provide future researchers, as
well as ad hoc network protocol users, a well-deserved
criterion for choosing a reliable and safe protocol.
(iv) Since we used OPNET Modeler 10.5, our simulation
was confined to three protocols, DSR, AODV, and
TORA. Additional ad hoc network protocols, such as
DSDV and ZRP, could be added in OPNET for com-
prehensive performance evaluation.
REFERENCES
[1] E. Celebi, “Performance evaluation of wireless multi-hop ad-
hoc network routing protocols,” />∼ecelebi/
esim.pdf.
S. Ahmed and M. S. Alam 11
[2] J.Broch,D.A.Maltz,D.B.Johnson,Y.C.Hu,andJ.Jetcheva,
“A performance comparison of multi-hop wireless ad-hoc
network routing protocols,” in Proceedings of the 4th Annual
ACM/IEEE International Conference on Mobile Computing and
Network (MobiCom ’98), pp. 85–97, Dallas, Tex, USA, October
1998.
[3] V. D. Park and M. S. Corson, “A highly adaptive distributed
routing algorithm for mobile wireless network,” in Proceedings
of 16th IEEE Conference on Computer and Communications So-
cieties (INFOCOM ’97), vol. 3, pp. 1405–1413, Kobe, Japan,
April 1997.
[4] V. D. Park and S. Corson, “Temporarily-ordered routing al-
gorithm (TORA) version 1 functional specification,” corson-
draft-ietf-manet.tora-spec-00.txt, IETF, Internet draft, 1997.
[5] M. S. Corson, S. Papademetriou, P. Papadopolous, V. D. Park,
and A. Qayyum, “An Internet MANET Encapsulation Protocol
(IMEP) Specification,” Internet draft, draft-ietf-manet-imep-
spec01.txt, August 1998.
[6] V. Park and S. Corson, Internet draft, March 2004, http://www.
ietf.org/proceedings/02mar/I-D/draft-ietf-manet-tora-spec-
04.txt.
[7] D. B. Johnson and D. A. Maltz, “Dynamic source routing in
ad-hoc wireless networks,” in Mobile Computing,T.Imielinski
and H. Korth, Eds., chapter 5, pp. 153–181, Kluwer Academic,
Hingham, Mass, USA, 1996.
[8] D. B. Johnson and D. A. Maltz, “Protocols for adaptive wire-
less and mobile computing,” IEEE Personal Communications,
vol. 3, no. 1, 1996.
[9] T. Larsson and N. Hedman, “Routing protocols in wireless ad-
hoc network—a simulation study,” Lulea University of Tech-
nology, Stockholm, Sweden, 1998.
[10] D. Bertsekas and R. Gallager, Data Network, Prentice Hall, En-
glewood Cliffs, NJ, USA, 2nd edition, 1992.
[11] J. Hoebeke, B. Latre, I. Moerman, B. Dhoedt, and P. De-
meester, “Routing in mobile ad-hoc networks,” March 2004,
/>design/research/topics/
2003/FTW
PhD30 Jeroen.pdf.
[12] C. Perkins and S. Das, “Ad-hoc on-demand distance vector
(AODV) routing,” Network Working Group, RFC: 3561, July
2003, .
[13] C. E. Perkins and P. Bhagwat, “Highly dynamic destination-
sequenced distance-vector routing (DSDV) for mobile com-
puters,” in Proceedings of the ACM Special Interest Group on
Data Communications (SIGCOM ’94), vol. 24, pp. 234–244,
London, UK, August-September 1994.
[14] S. R. Das, R. Castaneda, J. Yan, and R. Sengupta, “Compara-
tive performance evaluation of routing protocols for mobile,
ad hoc networks,” in Proceedings of 7th International Confer-
ence on Computer Communications and Networks (IC3N ’98),
pp. 153–161, Lafayette, La, USA, October 1998.
S. Ahmed was born in Faridpur, Bangla-
desh, on December 1, 1975. He has an M.S.
degree in electrical and computer engi-
neering from University of South Alabama,
Mobile, Ala, USA. He did his Bachelors in
computer science and engineering from
Indian Institute of Technology, Kharagpur,
India. His research interests include ad hoc
networking, VLSI technology and fabri-
cation, fault-tolerant and software testing.
He has given invited seminar on related topic at IEEE NETC 2005
Conference in Bellevue, Washington. A Graduate Assistantship
was awarded to him from fall 2002 to fall 2003 at USA. His M.S.
thesis was funded by National Science Foundation (NSF). He was
recognized by the Prime Minister of Bangladesh for his special
achievement in secondary school examination in 1992. Currently,
he is working as a Test Engineer at the United Online Inc., USA.
Today wherever, whichever position he stands for is because of Al-
lah the Almighty and for his greatest parents, siblings, and fianc
´
ee
Farhana Sultana.
M. S. Alam is a Professor and Chair of the
Electrical Computer Enigineering Depart-
ment at the University of South Alabama,
Mobile, Ala, USA. His research interests in-
clude ultra fast computer architectures and
algorithms, image processing, pattern rec-
ognition, fiber optics, infrared systems, dig-
ital system design, and smart energy man-
agement and control. He is the author or
coauthor of more than 275 published pa-
pers, including 117 articles in refereed journals and 10 book chap-
ters. He received numerous excellences in research, teaching, and
service awards including the 2003 Scholar of the Year Award from
USA. He served as the PI or Co-PI of many research projects total-
ing nearly $12 million, supported by NSF, FAA, DoE, ARO, AFOSR,
WPAFB, and I TT Industry. He presented over 55 invited papers,
seminars, and tutorials at international conferences and research
institutions in USA and abroad. He is a Fellow of OSA, IEE (UK),
the SPIE, a Senior Member of IEEE, ASEE, and AIP. He was the
Chairman of the Fort Wayne Section of IEEE for 1995–1996.