Báo cáo hóa học: " Research Article Real-Time Cardiac Arrhythmia Detection Using WOLA Filterbank Analysis of EGM Signals" pot
Bạn đang xem bản rút gọn của tài liệu. Xem và tải ngay bản đầy đủ của tài liệu tại đây (1.34 MB, 8 trang )
Hindawi Publishing Corporation
EURASIP Journal on Advances in Signal Processing
Volume 2007, Article ID 76256, 8 pages
doi:10.1155/2007/76256
Research Article
Real-Time Cardiac Arrhythmia Detection Using WOLA
Filterbank Analysis of EGM Signals
Hamid Sheikhzadeh, Robert L. Brennan, and Simon So
AMI Semiconductor Canada Company, 611 Kumpf Drive, Unit 200, Waterloo, Ontario, Canada N2V 1K8
Received 27 April 2006; Revised 13 October 2006; Accepted 13 October 2006
Recommended by William Allan Sandham
Novel methods of cardiac rhythm detection are proposed that are based on time-frequency analysis by a weighted overlap-add
(WOLA) oversampled filterbank. Cardiac signals are obtained from intracardiac electrograms and decomposed into the time-
frequency domain and analyzed by parallel peak detectors in selected frequency subbands. The coherence (synchrony) of the
subband peaks is analyzed and employed to detect an optimal peak sequence representing the beat locations. By further analysis
of the synchrony of the subband beats and the periodicity and regularity of the optimal beat, various possible cardiac events (in-
cluding fibrillation, flutter, and tachycardia) are detected. The Ann Arbor Electrogram Library is used to evaluate the proposed
detection method in clean and in additive noise. The evaluation results show that the method never misses any episode of fibril-
lation or flutter in clean or in noise and is robust to far-field R-wave interference. Furthermore, all other misclassification errors
were within the acceptable limits.
Copyright © 2007 Hamid Sheikhzadeh et al. This is an open access article distributed under the Creative Commons Attribution
License, which permits unrestricted use, distribution, and reproduction in any medium, provided the original work is properly
cited.
1. INTRODUCTION
The objective of this research is rhythm classification and
event detection based on the intracardiac electrogram (E-
GM) signals. The proposed methods are designed for im-
plantable devices that should operate on extremely low-
power budgets. In the meantime, these methods should op-
erate in real time and the processing delay should be in the
minimal range acceptable for such applications. The detec-
tion methods should be very reliable and robust to interfer-
ence, noise, and morphology variations.
Current practical methods of cardiac rhythm detection
employed in implantable cardioverter defibrillators (ICDs)
are generally based on beat-by-beat time-domain analysis.
Although research has been conducted to exploit more so-
phisticated signal processing such as wavelet transform and
template matching for event detection [1–3], the new meth-
ods have rarely been employed in practical systems due to
their computational and power demands and issues related
to the reliability of their detection.
Current challenges in reliable rhythm detection for im-
plantable cardiac rhythm management (CRM) systems such
as ICDs are the following.
(1) Inappropriate device therapy (IDT) amount to a con-
siderable rate (between 10 to 30%) in various devices
[4]. IDTs occur due to low EGM signal quality, sinus
tachycardia, supraventricular tachycardia (SVT), my-
opotential interference, external interference, and T-
wave oversensing [5]. IDT is painful to the patient and
depletes the device battery power more quickly. IDT
is also potentially harmful to the patient as it puts the
patient at risk of device-induced VT (proarrhythmia)
that might be dangerous and hard to detect by the ICD
[4, 5].
(2) Missing serious cardiac events compromises the relia-
bility of the CRM devices. This happens due to many
reasons including quick morphology, rate, and even
polarity changes of the EGM signal, abnormally wide
R-waves a nd P-waves, and external noises [1]. The
problems are aggravated due to the fact that often pa-
tients have to simultaneously use medicines that alter
the EGM waveforms.
(3) Following a device therapy (low-energy pacing or
high-energy cardioversion), it is essential to quickly re-
detect the EGM rhythm to analyze the effectiveness of
the therapy. Quick redetection, however, is tricky as
2 EURASIP Journal on Advances in Signal Processing
often the device therapy polarizes the EGM electrodes
or causes baseline variations of the EGM signal (some-
times in form of low-frequency oscillations with mag-
nitudes larger than the EGM beat itself). Often a black-
out period has to be applied before any reliable new
sensing.
(4) As increasingly sophisticated multichamber CRM de-
vicesbecomeavailableoffering the physicians more
choices in programming the devices, more powerful
signal processing is required to efficiently handle the
multichannel information while offering the physician
less complicated and reliable programming scenar ios.
Also, increased immunity to cross-channel interfer-
ence is necessary.
To cope with the mentioned problems and to improve the
rhythm detection accuracy, we propose a multitiered de-
tection method that is based on time-frequency analysis of
the EGM signals by a weighted overlap-add (WOLA) filter-
bank. The WOLA filterbank can be efficiently implemented
on an ultra-low power platform [6] targeted for real-time
low-delay and implantable devices.
Methods based on time-frequency analysis have already
been proposed for electrocardiogram (ECG) and QRS detec-
tion [7]. However, the proposed methods are not qualified
for ultra-low power implementation on implantable devices
since they are either (a) too complex or unsuitable for real-
time applications or (b) specifically designed for (and eval-
uated on) ECG signals and do not provide the robust and
reliable performance essential for EGM signal processing.
Possibly, the most relevant to our work is the research by
Afonso et al. on ECG beat detection in real time [8]. They an-
alyze the ECG signal by a critically sampled polyphase filter-
bank, extracting six features that are all based on the accumu-
lated energy (or absolute value) of groups of subbands. Each
energy feature is processed by a peak detector that compares
the signal moving average to a threshold that is determined
based on an estimation of the background noise. Peaks are
then refined in a cascade of five stages (levels). In one stage,
two different thresholds are used to detect the peaks of the
same feature. The peaks are then combined in parallel. The
method is evaluated on a standard ECG database with satis-
factory performance.
The objective of this research is to present a real-time de-
tection method for cardiac event detection using the intra c-
ardiac EGM signals. Sensed EGM signals differ from ECG
signals in many aspects. Major differences are summarized
here.
(1) EGM signals provide direct access to individual heart
chambers, most importantly right ventricular and
right atrial, at the signal source. In contrast, ECG sig-
nals provide a combined signal after propagation of
various waves to the body surface.
(2) RelativetimingofvariousEGMsignalsisveryimpor-
tant as it could be employed to discriminate various
cardiac events (e.g., SVT versus VT) a ccurately. For
ECG signals, however, such timing information is not
available.
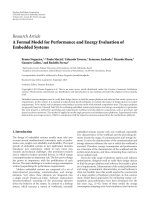
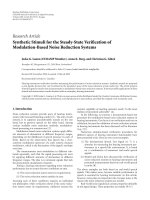
Analysis filterbank
h
0
(n)
h
K 1
(n)
R
R
z
0
(m)
Subband
rhythm
detection
x(n)
z
K 1
(m)
.
.
.
Figure 1: WOLA oversampled filterbank analysis for subband
rhythm detection.
(3) Unlike ECG sig nals, sensed EGM signals are prone
to cross-talk. For example, far-field R-waves (FFRWs)
might occur when the much stronger ventricular sig-
nal interferes with sensing of the weaker atrial signal.
Although FFRWs are a major problem with unipolar
electrodes, they interfere with bipolar elect rodes to a
lesser degree.
Signal processing str a tegies are therefore greatly different for
EGM signals as compared to ECG signals.
Rather than critically sampled polyphase filterbanks of
[8], we employ a very efficient WOLA oversampled filterbank
[6] for time-frequency analysis of the EGM signals. Subband
peaks are detected directly from the subband signals (abso-
lute values) by recursive averaging with no absolute thresh-
olds. Subband peaks are combined in parallel by exploiting
the synchrony of the subband signals at the beat time. Fur-
thermore, to cope with the wide range of possible beat rates
and morphologies of the EGM signal, the narrowband (com-
plex) subbands are merged to obtain wideband-subband sig-
nals to be used for wideband event detection. The results of
the wideband and narrowband detections are then combined
for robust detection.
As the intention here is to describe the basis for the detec-
tion method, we limit our attention to sing le-electrode anal-
ysis; extension to multiple-electrode analysis is straightfor-
ward. Also, the algorithm simplicity has been a major con-
sideration in this research since we are targeting low-power,
real-time, and implantable applications.
This paper is organized as follows: Section 2 presents de-
tails of the detection algorithm, Section 3 discusses evalua-
tion of the methods using the EGM signals in clean and in
additive noise, and Section 4 presents research conclusions.
2. THE PROPOSED DETECTION METHOD
2.1. General
A time-domain EGM signal x(n)isanalyzedbyanoversam-
pled filterbank (depicted in Figure 1) that is efficiently im-
plemented using a WOLA structure [6]. The filterbank pa-
rameters, adjusted by optimization for this application, are
K
= 32 subbands, analysis window length of L = 256, sub-
band decimation factor of R
= 4, and oversampling factor of
OS
= K/R = 8.
Hamid Sheikhzadeh et al. 3
At the output of WOLA analysis, K complex-valued sub-
band signals are obtained: Z
k
(m), k = 0, 1, , K − 1, where
m is the subband time index. For real input signals, only
half of the subbands are stored and processed due to Hermi-
tian symmetry. The subband time-index m is updated every
R
= 4 input s amples when a new block of WOLA subband
signals is available.
Subband signals are then framed with a frame length of
3 seconds and a frame shift of 2 seconds. The frame length
should be chosen long enough to cover more than one beat
for slow beats (around 60 beats per minute, bpm) and to pro-
vide enough beats for statistical analysis. At the same time,
the frame should be as short as possible to track the dy-
namics of the quickly varying beats. The choice of frame
shift is rather arbitrary and depends on how often a deci-
sion is needed. Notice that ir respective of the frame length
and frame shift, the WOLA analysis is continuously applied
to the input signal, yielding a new block of subband sig nals
for every R input samples.
The cardiac beat is often represented by a sharp pulse in
the EGM signal. As a result, the magnitudes of subband sig-
nals (
|Z
k
(m)|, k = 0, 1, , K − 1) exhibit mainly coherent
peaks at the time of cardiac depolarization. A major objective
in this research is to exploit this subband coherence (termed
“synchrony” here) between various subbands. Among many
possible methods, we designed a simple and robust approach
based on binary operations to measure the synchrony.
Based on the synchrony analysis, a final beat sequence
(called “optimal beat” in this paper) is detected for every
frame as detailed in the next section. Then the periodicity
and the regularity of the optimal beat are combined with the
synchrony measure to detect the underlying cardiac event.
2.2. Subband peak detection and synchrony analysis
In the first stage, peaks are detected in selected subbands.
Given the subband magnitude signal
|Z
k
(m)| for subband
k, its maximum is t racked with a two-time-constant first-
order recursive filter. Considering two filter coefficients of
0.9 <α
m1
< 1and0.1 <α
m2
< 0.5, the following pseudocode
describes how the maximum signal (M
k
(m)) is calculated:
α
= α
m1
,
If
Z
k
(m)
>M
k
(m − 1), α = α
m2
,
M
k
(m) = M
k
(m − 1) · α +
Z
k
(m)
·
(1 − α).
(1)
Aftereachpeak,thefilteractsasaleakyintegrator.Accord-
ingly, the first filter coefficient (α
m1
) is selected close to one.
This controls the so-called “release time” of the filter. The
other coefficientisselectedsmallerforthefiltertoreact
quickly to the next peak.
Similarly, the average signal A
k
(m)istrackedbyatwo-
time-constant recursive filter with 0.7 <α
a1
< 1and0.5 <
α
a2
< 0.7. At each time-instance m,apeakvalue(P
k
(m)) is
detected by comparing the three values of
|Z
k
(m)|, M
k
(m),
44 44.54545.54646.547
1000
0
1000
Inst.
Peak
Max.
Avg.
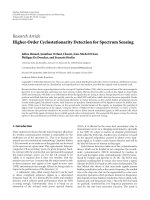
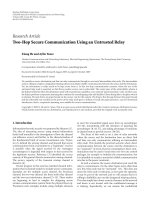
Figure 2: From top to bottom, a segment of ventricular EGM sig-
nal, four WOLA subband energies with their average, maximum,
instantaneous, and peak signals, their corresponding binary pulses
B
k
(m) (rows 6–9), and the optimal-detected pulse (bottom row).
and A
k
(m) (the instantaneous, maximum, and average val-
ues) as described in the following pseudocode:
P
k
(m) = 0,
If
Z
k
(m)
>A
k
(m − 1)&
Z
k
(m)
> 0.5M
k
(m − 1)
&
A
k
(m − 1) < 0.9M
k
(m − 1)
, P
k
(m) =
Z
k
(m)
.
(2)
Between two distant cardiac beats, it is possible that A
k
(m)
and M
k
(m)convergetoeachother.Topreventpeakdetec-
tion in this situation, the last term in the condition above
is included. Notice that no absolute threshold is used in the
peak detection and only relative thresholds are employed.
By analyzing various beats in subband domain, it was ob-
served that peaks appear more distinctively in the first half
of the subbands. As a result, we limited peak detection to
subbands 2–9 (out of 1–16). The first subband is ignored as
it mostly captures noise and baseline wander. Figure 2 illus-
trates a frame of atrial EGM signal (top graph), and four sets
of WOLA subband signals of
|Z
k
(m)|, M
k
(m), A
k
(m), and
P
k
(m) (instantaneous, maximum, average, and peak).
Following the peak detection, each subband peak signal
P
k
(m) is converted to a binary (0/1 for peak/no-peak) sig-
nal B
k
(m). This greatly simplifies further processing. To em-
bed more robustness in the algorithm and to avoid detecting
short-term spurious peaks, we search every frame of binary
peak signal B
k
(m) for a pattern of consecutive peaks (1s) fol-
lowed by a block of zeros (e.g.,
{111000}). For every pat-
tern found, the falling edge of the binary peak signal is regis-
teredasavalidpeak.Thepeaklocationismarkedbyablock
of three 1s (
{111}) and the rest of the peak signal is reset
to zero. Replacing the peak by a block of 1s (rather than a
4 EURASIP Journal on Advances in Signal Processing
single 1) increases robustness in the next stage of synchrony
analysis. All further steps of processing are applied to the bi-
nar y peak signals B
k
(m).
2.3. Synchrony analysis and robust beat detection
In the next stage, the degree of synchrony between various
subbands is measured by applying simple AND operations
to the binary peak signals. For each possible pair of signals
B
k
(m)andB
l
(m), k = l, synchrony of the pair S
k,l
(in per-
centage) is calculated as follows:
S
k,l
=
100 NP
B
k
(m)&B
l
(m)
max
NP
B
k
(m)
,NP
B
l
(m)
,
(3)
where function NP(
·) denotes the number of peaks in a
frame of binary peaks and & denotes the logical AND op-
eration. The synchrony is evaluated for all nonidentical pairs
(for 8 subbands this involves 28 AND operations on frame
pairs). To minimize the effect of noise and interference, only
the top 3 synchrony s cores are considered as measures of the
framesynchrony.Thetop3scoresarecomparedtofixedsyn-
chrony thresholds to classify the frame of subband beats as
perfectly synchronous (Syn
= 4), as borderline synchronous
(Syn
= 2), or asynchronous (Syn = 0).
We also employ the top 3 binary pulse pairs to robustly
detect the beat times. Applying a majority-voting rule, beats
are detected from the 3 pairs (after the logical AND opera-
tion within each pair) when 2 out of the 3 p airs exhibit si-
multaneous beats. Considering the peak extension to a block
of three 1s, this method proved to be very robust when the
signal quality was compromised by noise or due to flutter
and fibrillation. As a result of beat detection, an optimal beat
sequence OB(m) is obtained for every frame. Depicted in
Figure 2 (rows 6–9) are binary subband pulses for the EGM
segment together with the optimal-detected beat (bottom
row).
2.4. Analysis of periodicity and regularity
Once an optimal beat sequence OB(m) is obtained, it is an-
alyzed to find the beat rate and the regularity of the beats.
A set of thresholds for periods of various cardiac events is
used to set histogram edges as [0, FibPer/2, FibPer, FlutPer
+1, TachyPer +1, SRMax, infinity]; where FibPer, FlutPer,
TachyPer, a nd SRMax indicate the largest acceptable periods
for fibrillation, flutter, tachycardia, and sinus rhythm, respec-
tively. T he beats are classified in a period histogram with 6
bins specified by the above edges. The mode (bin index for
the most populated bin) of the histogram (T
m
) is an indi-
cator of the periodicity. For the periods in the “acceptable”
range of (FibPer/2, SRMax), the mean period (
T) and the
standard deviation-to-mean ratio (σ/μ)arecalculated.Ifei-
ther of the
T and T
m
fall in the fibrillation, flutter or tachy-
cardia range, the period zone indicator would be set to show
the corresponding event. For sinus rhythm, however, both
T
and T
m
should indicate a sinus rhythm. In all cases, we chose
to use the mean period
T to find the rate as beat per minute,
bpm
= 60/T. So, it is possible that the period zone indicator
show a flutter since T
m
is pointing to a flutter while average
beat rate is stil l slightly below the minimum flutter rate.
σ/μ (of periods) is an indicator of the regularity; typi-
cally for very regular beats σ/μ < 20%, for very irregular
beats σ/μ > 40%, and σ/μ values between the two ranges
indicate moderate regularity. In case unusual lack of EGM
activity (longer than the slowest possible rhythm) is detected
within the frame, the irregular ity flag is set (Ireg
= 1).
2.5. Event detection based on subband features
The synchrony analysis provides both the optimal beat
OB(m) and the synchrony score (Syn
= 0, 2, 4). Based on
these and the periodicity and regularity of the optimal beat
(
T, T
m
, σ/μ, and Ireg), cardiac events are classified as one of
the following eight events:
(1) stable sinus r hythm (SR),
(2) transitional SR (T-SR),
(3) stable tachycardia (VT or AT),
(4) transitional tachycardia (T-VT or T-AT),
(5) flutter(VFLUTorAFLUT),
(6) fibrillation (VFIB or AFIB),
(7) synchronous but irregular rhythm (Syn-Irg),
(8) unclassified,
where VT, VFLUT, and VFIB represent ventricular events of
tachycardia, flutter, and fibrillation, respectively. Similarly,
AT, AFLUT, and AFIB represent the corresponding atrial
events. When the mean period is within the range for sinus
rhythm but the rhythm is irregular, a transitional event of
T-SR is detected. A similar criterion is used in detection of T-
VT or T-AT. Event (7) is detected when the synchrony i s per-
fect but periods are too irregular or insufficient in number to
be considered for other classes. Finally, event (8) is reserved
for unclassified rhythms.
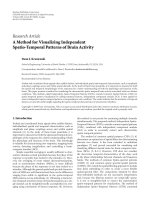
A flowchart of the event detection algorithm is depicted
in Figure 3. As shown, the algorithm sets a series of traps
for various events. It first tries to identify fibrillation or flut-
ter (classes
{5, 6}). If none is detected (state A in the fig-
ure), it searches for fast beats (classes
{3, 4, 7}) and then sinus
rhythm (classes
{1, 2, 7}). If none of the t raps succeeds in de-
tection, the beat remains unclassified (class 8).
2.6. Detection by wideband filterbank
The expected range of cardiac beat rates is very wide, from
less than 50 bpm to over 300 bpm. As a result of the classic
time-frequency resolution trade-off, the time resolution of
the nar rowband filterbank (WOLA analysis with K
= 32) is
insufficient to separate two closely spaced beats. The prob-
lem is compounded when the signal quality is further com-
promised during flutter or fibrillation.
An effective solution is to use a filterbank with wider
subbands. In uniform filterbanks, it is possible to merge the
subbands through a simple postprocessing [9]. Specifically,
in the WOLA filterbank, we can combine, for example, ev-
ery neighboring pair of complex subband signals to obtain
a wideband analysis, doubling the time resolution. Since all
Hamid Sheikhzadeh et al. 5
Start
No
No
Syn
= 2&
(Ireg
= 1or
σ/μ > 40)
Syn > 0&
rate
flut
No
A
Yes
σ/μ > 50
Det
= 5Det= 6
No
Yes
Yes
Yes
Syn
= 0or
rate
Fib
rate
A
No
B
Syn
= 4
Yes
No
Ireg
= 0
Yes
No
Tachy r a te
Yes
σ/μ range
[40, 60] (60, 100]
[0, 40) [0, 40)
Det
= 4Det= 3Det= 7Det= 1Det= 2Det= 8
(60, 100]
σ/μ range
[40, 60]
Yes
SR rate
No
B
Syn
= 2&
Ireg
= 0&
σ/μ < 60
No
Yes
Tachy SR
Other
Rate
Figure 3: Flowchart of the event detection algorithm.
of the subband signals have baseband spectrums, to combine
subbands one has to modulate the bands to line them up se-
quentially. For merging two subbands, for example, one has
to apply a complex modulation to the higher-frequency sub-
band and add the results with the lower-frequency one.
To achieve a higher temporal resolution, we combined
the low-frequency subbands in pairs (subbands 2–7) and in
a group of four (subbands 2–5) resulting in four new wider
subband signals. In merging subbands, the limiting factor is
the filterbank oversampling factor (OS
= K/R). As the effec-
tive number of bands (K) decreases for wider subbands, the
potential for aliasing increases. The aliasing is kept minimal
with our proposed WOLA setup ( K
= 32, OS = 8), when
grouping in pairs (equivalent to K
= 16 bands) or in fours
(effective K of 8) since the oversampling factor for the com-
bined bands is at least OS
= 2. Aliasing and distortion are
also greatly reduced by proper prototype filter design but we
refrain from discussion here for brevity .
Using the four wider subbands, we applied a wideband
peak detection, synchrony, periodicity, and regularity analy-
sis similar to the nar rowband case.
2.7. Low-frequency detection
The EGM wave morphology is very diverse. Among all vari-
ous forms, there are cases where the EGM beat lacks a clear
strong impulse at the beat instance. Instead, a periodic wave-
form with wide R-waves or P-waves (for the ventricular or
atrial signals, resp.) is observed with weak impulses at the
beat locations. Detecting such beats is problematic in noise
since the EGM waveform, exhibiting a low-pass behavior, is
presented mostly in very low frequency bands. To increase
noise robustness for such cases, we added a third method of
beat detection by using only the peaks detected in subbands
2 and 3. The synchrony between the two subbands as well as
the periodicity and regularity of optimal beat (AND result of
the two) is calculated as before. This is called low-frequency
(LF) detection here.
2.8. Multitiered beat and event detection
Taking the narrowband filterbank detection as the default,
the wideband system is selected when all of the following
conditions are met.
(1) Wideband detection shows perfect synchrony (Syn
=4).
(2) Wideband detection has σ/μ < 40% or less than the
corresponding value for the narrowband detection.
Switching to the LF detection occurs when all of the follow-
ing conditions are met.
(1) Both the narrow and wideband systems are not syn-
chronous (Syn < 4); or σ/μ of the LF detection is su-
perior to (less than) each of the other two systems by
at least 40%.
(2) The LF system detects less than four pulses in the
frame.
(3) The LF system is not detecting fibrillation or flutter.
3. SYSTEM PERFORMANCE EVALUATION
The EGM data from Vol. I of the Ann Arbor Electrogram
Libraries (AAEL) [10] was used for system evaluation. For
most experiments, the EGM signals recorded with bipolar
electrodes were utilized since the y provide the best quality.
The two bipolar signals were recorded from Right Ventricu-
lar Apex and High Right Atrium, called RVAb and HRAb in
the AAEL documentation, respectively. All of the RVAb and
HRAb signals (more than 330 minutes of EGM data for 60
patients in 214 files) were used for system evaluation.
6 EURASIP Journal on Advances in Signal Processing
20 40 60 80
Time (s)
0
200
400
1 7 13 19 25 31 37 43 49 55 61 67 73 79
0
2
4
AT
SR-Irg
AT
AFLUT
AFIB
SR
Figure 4: Algorithm performance for an HRAb EGM signal (AAEL
file: SET1, A241563.SIG), top view: detected events in time, bot-
tom view: detected rate in beats per minute (solid line) in time, and
AFIB, AFLUT, and AT rate thresholds (dashed lines, from top to
bottom, resp.).
To evaluate the system performance for FFRWs, we also
employed most of the usable High Right Atrium unipolar
(HRAu) signals from the database.
The EGM signal was digitally decimated from the origi-
nal sampling frequency of 1000 Hz down to Fs
= 250 Hz. Us-
ing a small subset of the AAEL representing various events,
the system parameters were tuned until there were no missed
events, and the fr ame-by-frame classification was as accurate
as possible. Then, for every case in the AAEL library, the de-
tection algorithm was tested and the results were compared
to the physician-certified AAEL annotations. Figure 4 depicts
a typical output summary of the detection system showing
various detected events and the beat rate. Notice that there
is no “training” involved in the proposed detection system;
rather system parameters had to be optimized on a subset of
the EGM data.
3.1. Statistical performance evaluation
After optimizing the detection system and testing on the
whole database in clean, we needed to evaluate the perfor-
mance of the system in noise. Also of interest was the per-
formance of reduced versions of the detection algorithm in
clean and in noise. For practical applications, noise robust-
ness is a very desired feature of any cardiac event detec-
tion. For a statistical analysis, we compared the performance
in noise (or with reduced algorithms) against the bench-
mark detection, that is, the results for the algorithm in clean.
Frames representing cardioversion, lead failure, and lead dis-
lodgement (in total around 28 minutes) were excluded from
the comparisons.
To simulate various noise conditions, five different noises
were added to the EGM signals:
(1) white Gaussian noise, (0, π) band,
(2) lowpass noise, (0, π/4) band,
(3) bandpass noise, (π/4, π/2) band,
(4) highpass noise, (3π/4, π) band,
(5) tonal 60 Hz noise.
Noises (2)–(4) were obtained by filtering white noise. To ad-
just the noise level for a given signal-to-noise ratio (SNR),
one needs to measure the EGM signal power. Due to the vari-
ability of the EGM signal in terms of magnitude, polarity, and
morphology (very wide waves to very sharp ones), measure-
ment of long-term power is inadequate. Instead, we adjusted
the noise level based on tracking the short-term (4 second)
EGM signal envelope (rather than power).
To evaluate the performance for EGM signal corrupted
with additive noise, output summaries (similar to that of
Figure 4) were carefully compared to the output summaries
for the clean EGM signals to ensure that no block of event
was lost. This was done for the whole EGM database (214
signal files). Increasing the noise level, the detection system
performed well up to 15 dB SNR for noise types 1–3, while
fornoises4-5theperformancewasfineupto0dBSNRnoise
power.
To quantify the performance, we grouped the 8 car-
diac events (Section 2.5 ) in two separate groups,
{1–4}
(SR/Tachy) and {5-6} (Fib/Flut), and measured the detec-
tion performance using frame counts of TP, TN, FP, and FN
defined as follows.
(1) TP, true positive: correct detection of
{5-6}.
(2) TP, true negative: correctly not detecting
{5, 6}.
(3) FP, false positive: falsely detecting
{5, 6}.
(4) FN, false negative: falsely not detecting
{5, 6}.
From these frame counts, the Fib/Flut positive predictivity
(+P) and negative predictivity (
−P) were calculated as fol-
lows:
+P
=
TP
TP + FP
,
−P =
TN
TN + FN
. (4)
Depicted in Table 1 are the total frame counts of TP, FP, TN,
and FN for the five noise types. Also, Tabl e 2 summarizes the
+P and
−P measures for the five noises. As expected, the ad-
verse effects of white noise on subband detection are worse
as they corrupt all the bands equally. On the other extreme,
the system shows immunity to even 0 dB SNR tonal (60 Hz)
and highpass noises. Our careful observations revealed that
no block event was missed or misrecognized with five noise
types in Tab le 2. Moreover, most of the recognition errors
in noise occurred before or after fibrillation or flutter events
when the quality of EGM signal was already compromised.
3.2. Evaluation in presence of FFRWs
As described in Section 1, FFRWs pose more difficulties
when sensing with unipolar electrodes. We analyze the sys-
tem performance in the presence of FFRWs to demonstrate
the general robustness of the detection system to interfer-
ences.
In the AAEL Vol. I EGM database, FFRWs are present in
a few cases (encompassing 19 files in sets 1 and 8) that in-
clude usable (noise-free sensing) unipolar recording of the
Hamid Sheikhzadeh et al. 7
Table 1: Number of TP, FP, TN, and FN frames for five noise types
of (1) white, (2) lowpass, (3) bandpass, (4) highpass, and (5) 60 Hz,
with noise types (1)–(3) at 15 dB and types (4)-(5) at 0 dB SNR.
Actual
FIB/FLUT SR/VT
Detected
FIB/FLUT
Tru e p os it ive False positive
(1) 1005 (1) 43
(2) 1114 (2) 27
(3) 1001 (3) 11
(4) 1027 (4) 0
(5) 1020 (4) 0
SR/VT
False negative True negative
(1) 38 (1) 8777
(2) 29 (2) 8786
(3) 42 (3) 8825
(4) 16 (4) 8895
(5) 23 (5) 8882
Table 2: Positive and negative predictivity for five noise types of (1)
white, (2) lowpass, (3) bandpass, (4) highpass, and (5) 60 Hz.
Noise type +P% −P%
(1) 15 dB SNR 95.9 99.6
(2) 15 dB SNR
97.4 99.7
(3) 15 dB SNR
98.9 99.5
(4) 0 dB SNR
100.0 99.8
(5) 0 dB SNR
100.0 99.7
atrial signal (HRAu signal). As the ventricular interfering sig-
nal propagates through the heart medium to reach the atrial
electrode; it is inevitably filtered by the medium. As a re-
sult, the subband synchrony of the interfering beats is much
weaker than the synchrony of the at rial signal, even when the
FFRWs are larger in magnitude. This enables the subband-
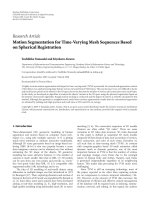
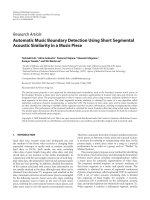
based detection system to reject the FFRWs safely. Figure 5
depicts a segment of the EGM signal sensed by a unipolar
electrode (HRAu signal) including clear FFRW interference.
For comparison, the same segment sensed by the bipolar
electrode (HRAb signal) is also shown. The detected beats
(c) are the same for both HRAb and HRAu signals demon-
strating the robustness of the detection to FFRWs. We em-
ployed all available FFRW cases (19 files) for evaluation by
comparing the results with the HRAb signal. The detection
system performed reliably in 16 (out of 19) cases. In 3 c ases,
the FFRWs were so dominant that the detection system could
not discriminate them from the atrial beats.
4. CONCLUSIONS
The subband-based methods proposed in this paper for pro-
cessing intracardiac EGM sig nals offer a robust and reliable
performance by employing parallel narrowband peak de-
tectors. Pr oper and efficient combination of subband peaks
by synchrony analysis is a major milestone in this research.
86 87 88 89
FFRW
500
0
500
1000
HRAu
Time (s)
(a)
86 87 88 89
500
0
500
1000
HRAb
Time (s)
(b)
86 87 88 89
0
0.5
1
Time (s)
(c)
Figure 5: The EGM signals of (a) HRAu (with FFRW interference),
(b) HRAb, and (c) the detected beats.
The method, extensively evaluated using the AAEL EGM
database, demonstrates excellent performance in terms of ac-
curate e vent detection and beat-rate measurement even in
fibrillation or flutter when the signal quality is compromised.
Evaluation in noise and in the presence of far-field R-waves
has also demonstrated significant robustness to noise and in-
terference. This method is simple enough for implementa-
tion on an ultra-low power WOLA filterbank platform and
requires only simple operations as a result of using binary
peak signals.
For future work, we propose the use of subband features
for morphology analysis and pattern matching. This could
outperform comparable time-domain methods due to supe-
rior and more robust representation of signal spectral fea-
tures in the subband domain. Also, research is being con-
ducted towards an ultra-low power implementation of the
WOLA-based detection algorithm at power levels compara-
ble to current ICDs (typically less than one μ W). Our initial
findings confirm the feasibility of this implementation.
8 EURASIP Journal on Advances in Signal Processing
The proposed robust WOLA-based detection method
may beneficially be combined with t ime-domain methods
when time response is crucial (e.g., in pacing).
REFERENCES
[1] M. Astrom, S. Olmos, and L. Sornmo, “Wavelet-based event
detection in implantable cardiac rhythm management de-
vices,” IEEE Transactions on Biomedical Engineering, vol. 53,
no. 3, pp. 478–484, 2006.
[2] M.L.Brown,J.L.Christensen,andJ.M.Gillberg,“Improved
discrimination of VT from SVT in dual-chamber ICDs by
combined analysis of dual-chamber intervals and ventricular
electrogram morphology,” in Proceedings of of the 29th Annual
Meeting on Computers in Cardiology, pp. 117–120, Memphis,
Tenn, USA, September 2002.
[3] L.A.Koyrakh,J.M.Gillberg,andN.M.Wood,“Wavelettrans-
form based algorithms for EGM morphology discrimination
for implantable ICDs,” in Proceedings of the 26th Annual Meet-
ing on Computers in Cardiology, pp. 343–346, Hannover, Ger-
many, September 1999.
[4] J. L. Rojo-Alvarez, A. Arenal-Maiz, and A. Artes-Rodriguez,
“Discriminating between supraventricular and ventricular
tachycardias from EGM onset analysis,” IEEE Engineering in
Medicine and Biology Magazine, vol. 21, no. 1, pp. 16–26, 2002.
[5] B. Schaer and S. Osswald, “Methods of minimizing inappro-
priate implantable cardioverter-defibrillator shocks,” Current
Cardiology Reports, vol. 2, no. 4, pp. 346–352, 2000.
[6] R. Brennan and T. Schneider, “Flexible filterbank str ucture for
extensive signal manipulations in digital hearing aids,” in Pro-
ceedings of IEEE International Symposium on Circuits and Sys-
tems (ISCAS ’98), vol. 6, pp. 569–572, Monterey, Calif, USA,
May 1998.
[7] B U. Kohler, C. Hennig, and R. Orglmeister, “The principles
of software QRS detection,” IEEE Engineering in Medicine and
Biology Magazine, vol. 21, no. 1, pp. 42–57, 2002.
[8]V.X.Afonso,W.J.Tompkins,T.Q.Nguyen,andS.Luo,
“ECG beat detection using filter banks,” IEEE Transactions on
Biomedical Engineering, vol. 46, no. 2, pp. 192–202, 1999.
[9] R. L. de Queiroz, “Uniform filter banks with nonuniform
bands: post-processing design,” in Proceedings of IEEE Interna-
tional Conference on Acoustics, Speech and Signal Processing
(ICASSP ’98), vol. 3, pp. 1341–1344, Seattler, Wash, USA, May
1998.
[10] Ann Arbor Electrogram Libraries, Ann Arbor MI, USA, http://
electrogram.com/.
Hamid Sheikhzadeh obtained his B.S.
(1986) and M.S. (1989) degrees in electri-
cal engineering both from Amirkabir Uni-
versity of Technology (AUT) in Tehran. He
received his Ph.D. degree from the E&CE
Department of the University of Waterloo
in Canada in 1994 and continued his re-
search as a Postdoctoral Fellow for about a
year. From October 1994, he served as a Fac-
ulty Member of the EE Department of AUT
for six years. In the meantime, he held positions as Vice Chair-
man of Academic Affairs and Head of Communications Group of
the EE Department for about two years each. In November 2000,
he joined the early research team at AMI Semiconductor Canada
(then Dspfactory Ltd.) and since then has been working as a Senior
Member of the R&D team. Also, since April 2001, he has been col-
laborating with the E&CE Department of University of Waterloo
as an Adjunct Professor. His research interests include digital signal
processing, speech and audio processing, modeling of the central
and peripheral auditory system, adaptive signal processing, signal
processing for ultra-low power and portable devices, and biomedi-
cal signal processing. He is a Senior Member of IEEE and a Member
of ISCA.
Robert L. Brennan received the B.A.Sc.,
M.A.Sc. degrees in electr ical engineering
from the University of Waterloo in Canada
in 1985 and 1986, respectively. He received
his Ph.D. degree in 1991 from the Univer-
sity of Waterloo, investigating algorithms
and architectures for extremely low bit-
rate speech coders. At Unitron, a Canadian
manufacturer of hearing aids, he led the
company toward developing high perfor-
mance digital architectures replacing the almost exclusive analog
technology deployed at the time. This work has expanded and con-
tinued through the formation of Dspfactory and now, AMI Semi-
conductor. As a Senior Scientist, he continues working on digital
signal processing and filterbank multirate methods in audio, in-
dustrial, automotive, and medical applications.
Simon So is in his final year of the under-
graduate program at the Systems Design
Engineering Department of the University
of Waterloo. In 2005, during his work term
at AMI Semiconductor Canada Company in
Waterloo, he worked as a Member of the re-
search and development team on Cardiac
Rhythm Management project, contributing
to the current paper. His current inter-
ests include digital signal processing, digital
video and image processing, and video/audio compression algo-
rithms.