EURASIP Journal on Applied Signal Processing 2003:5, 437–448 c 2003 Hindawi Publishing pdf
Bạn đang xem bản rút gọn của tài liệu. Xem và tải ngay bản đầy đủ của tài liệu tại đây (1.33 MB, 12 trang )
EURASIP Journal on Applied Signal Processing 2003:5, 437–448
c 2003 Hindawi Publishing Corporation
Dynamic Chest Image Analysis: Model-Based Perfusion
Analysis in Dynamic Pulmonary Imaging
Jianming Liang
Turku Centre for Computer Science, DataCity, Lemminkă isenkatu 14 A, 20520 Turku, Finland
a
Email:
ă
Timo Jarvi
Turku Centre for Computer Science, DataCity, Lemminkă isenkatu 14 A, 20520 Turku, Finland
a
Email:
Aaro Kiuru
Department of Diagnostic Radiology, Turku University, 20520 Turku, Finland
Email: aaro.kiuru@tyks.fi
Martti Kormano
Department of Diagnostic Radiology, Turku University, 20520 Turku, Finland
Email: martti.kormano@utu.
ă
Erkki Svedstrom
Department of Diagnostic Radiology, Turku University, 20520 Turku, Finland
Email: erkki.svedstrom@tyks.fi
Received 31 January 2002 and in revised form 25 October 2002
The “Dynamic Chest Image Analysis” project aims to develop model-based computer analysis and visualization methods for
showing focal and general abnormalities of lung ventilation and perfusion based on a sequence of digital chest fluoroscopy frames
collected with the dynamic pulmonary imaging technique. We have proposed and evaluated a multiresolutional method with
an explicit ventilation model for ventilation analysis. This paper presents a new model-based method for pulmonary perfusion
analysis. According to perfusion properties, we first devise a novel mathematical function to form a perfusion model. A simple
yet accurate approach is further introduced to extract cardiac systolic and diastolic phases from the heart, so that this cardiac
information may be utilized to accelerate the perfusion analysis and improve its sensitivity in detecting pulmonary perfusion
abnormalities. This makes perfusion analysis not only fast but also robust in computation; consequently, perfusion analysis becomes computationally feasible without using contrast media. Our clinical case studies with 52 patients show that this technique
is effective for pulmonary embolism even without using contrast media, demonstrating consistent correlations with computed
tomography (CT) and nuclear medicine (NM) studies. This fluoroscopical examination takes only about 2 seconds for perfusion
study with only low radiation dose to patient, involving no preparation, no radioactive isotopes, and no contrast media.
Keywords and phrases: chest images, dynamic chest image analysis, pulmonary perfusion, perfusion model, effects of contrast
media.
1.
INTRODUCTION
The lungs take air in order to absorb oxygen from air into
blood. This means that sufficient pulmonary ventilation (air
flow) and perfusion (blood flow) are essential for the lungs
to function properly; inadequate lung function may be due
to failure in ventilation or perfusion among other factors. In
order to detect abnormalities in lung ventilation and perfusion, ventilation isotope scan and perfusion isotope scan are
conventionally used. They can provide a static, coarse geographic 2D distribution of air/blood in the lungs, but they
have the disadvantage of using radioactive isotopes.
Chest X-ray is the primary imaging method for the diagnosis of pulmonary disorders. Automated analysis of chest
438
EURASIP Journal on Applied Signal Processing
X-ray images was one of the first areas to receive attention
[1, 2]. Since then, many good results have been reported (e.g.,
[3, 4, 5, 6]). However, the previous work is mostly restricted
to a single chest image and limited to using spatial information for diagnosis with a few exceptions (e.g., [7, 8]). The information about pulmonary function (ventilation and perfusion) that may be gleaned from a single chest X-ray is rather
limited, but it is evident that, for effective diagnosis, the function of lungs must be carefully examined.
Functional imaging has become increasingly prominent
in recent years as an important new frontier in medical
imaging sciences. Turku University Central Hospital has developed a technique called dynamic pulmonary imaging
[9, 10, 11, 12], which can grab a sequence of digital chest fluoroscopy frames. This present research—dynamic chest image analysis—aims to develop model-based computer analysis and visualization methods for showing focal and general
abnormalities of lung ventilation and perfusion based on a
sequence of digital chest fluoroscopy frames collected with
the dynamic pulmonary imaging technique. We have proposed and evaluated a multiresolutional method with an explicit ventilation model for ventilation analysis [13, 14]. This
paper reports a new model-based method for pulmonary
perfusion analysis.
In the balance of this paper, the patient examination procedure is first reviewed in Section 2. After the definition of
perfusion signals in Section 3.1, we devise a mathematical
function serving as a perfusion model in perfusion analysis
in Section 3.2. In order to accelerate pulmonary perfusion
analysis and improve its sensitivity in detecting pulmonary
embolism, Section 3.3 introduces a simple, yet accurate, approach to extract cardiac systolic and diastolic phases from
the heart, so that this cardiac information may be utilized
to constrain the optimization processes. We illustrate the effects of contrast media with clinical cases in Section 4 and
present our clinical evaluation with 52 patients without using contrast media in Section 5, followed by a conclusion in
Section 6.
2.
IMAGE ACQUISITION
2.1. Patient examination
The image acquisition system developed at Turku University Central Hospital in the Dynamic Pulmonary Imaging
project can grab a sequence of chest X-ray images of up to
512 × 512 pixels at the sampling frequency of 25 Hz over a
short period of time with a copper filter of 3 mm (previously,
1.4 mm) [9, 10, 11, 12]. Two separate examination procedures are used for ventilation and perfusion studies. In ventilation study, the patient is asked to breathe naturally and
normally in supine position with posteroanterior projection.
It takes about 3–5 seconds for the lungs to complete a full
ventilation cycle in most cases. Therefore, in general, an image sequence of 55 frames with 192 × 144 pixels is collected
in 4.32 seconds with the sampling frequency of 12.5 Hz. In
perfusion study, the patient is also in supine position with
posteroanterior projection but with the breath held in order
to effectively remove the ventilation component. An intravenous bolus of X-ray contrast media may be further used
to enhance the perfusion signal strength. Comparing with
ventilation, perfusion has a higher frequency. Two to three
seconds would be sufficient to capture a full cycle of perfusion, but this higher frequency requires a higher temporal sampling frequency in the image acquisition. Furthermore, pulmonary perfusion is asynchronous.1 It demands
a higher spatial resolution [15]. Therefore, we grab an image sequence of 52 frames with 384 × 288 pixels at the
sampling frequency of 25 Hz in 2.04 seconds for perfusion
analysis.
The resulting image sequence can be represented with intensity function I(x, y, t), where 0 ≤ I ≤ 255, 1 ≤ x ≤ width
(192 for ventilation and 384 for perfusion), 1 ≤ y ≤ height
(144 for ventilation and 288 for perfusion), and t is a discrete time point in [0, examtime] (4.32 seconds for ventilation and 2.04 seconds for perfusion). We may also represent
it as I(x, y, i), where i is the frame index. The relation between the time index t and the frame index i is t = (i − 1)/ f ,
where f is the sampling frequency of 12.5 Hz for ventilation
analysis and of 25 Hz for perfusion analysis.
Because of the very short examination time and the use
of a copper filter, the radiation dose to patient is low. The
entrance skin dose of a patient is about 0.1–0.2 mGy [11]. For
comparison, radiation dose of a normal chest X-ray image
varies between 0.1 mGy and 0.2 mGy, and radiation dose of
fluoroscopy is about 2 mGy per minute [9, 11].
2.2.
Image properties
The 2D image sequence obtained from the patient examination carries valuable information for ventilation and perfusion studies thanks to the X-ray physical property: the attenuation of X-rays in air is much lower than in blood and soft
tissue. As a result, the average pixel intensity of an area in the
lung field varies over time due to the respiratory and cardiac cycles; this variation—called an observation—reflects
the air and blood volume change in the corresponding 2D
projectional area of the lung when the patient breathes naturally. When the patient is asked to hold the breath, we will
only observe the perfusion signal disturbed by noise. The
ventilation intensity variation depends on the depth of the
tidal volume ventilation and also on lung area. It is usually between 5–15 units in the grey scale of 8 bits. The image intensity variation for perfusion is about 1–3 units without contrast media. The ventilation signal-to-noise ratio is
about 10 : 1 and perfusion signal-to-noise ratio is about
2 : 1 [10]. This source of information (image property)
may be utilized for detecting pulmonary ventilation abnormalities and pulmonary perfusion abnormalities. This paper is to employ this source of information for perfusion
study.
1 The speed of blood flow is roughly 10 cm/s. When the blood flows in
the lungs, the phase (i.e., timeshifts) of a pulse signal at one location may
be different from that at another location although they have the same pulse
frequency.
Dynamic Chest Image Analysis
3.
439
MODEL-BASED PERFUSION ANALYSIS USING
CARDIAC INFORMATION
where
t = (t − S) mod(D + U),
3.1. Perfusion signals
For a given ROI (region of interest) in a sequence of chest
images I(x, y, t), we define a lung functional signal (i.e., an
observation) as the average pixel intensity of the ROI over
time
O(t) =
x,y ∈ROI I(x,
| ROI |
y, t)
,
(1)
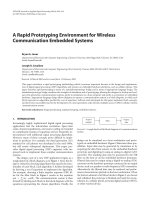
where | ROI | is the number of the pixels in the region of interest. When the patient breathes naturally, an observation
includes both ventilation and perfusion components plus
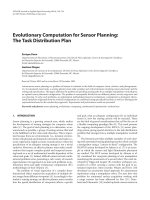
noise, as illustrated in Figure 1. Here, we are only interested
in the perfusion component. Therefore, the patient is asked
to hold the breath to effectively remove the ventilation component. For convenience, an observation in case of the breath
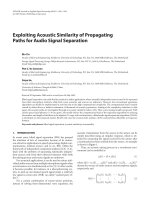
held is called perfusion signal. The perfusion signal strength
can be enhanced with an intravenous bolus of X-ray contrast
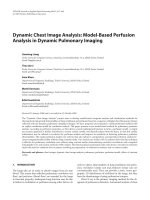
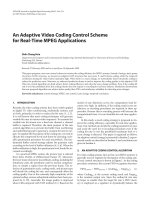
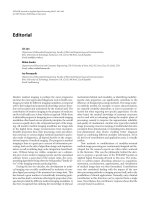
media as shown in Figure 2. For comparison, Figure 3 shows
a perfusion signal without using contrast media on the same
scale.
Pulmonary perfusion analysis is to extract meaningful
medical perfusion parameters (e.g., perfusion amplitude,
systolic and diastolic phases, etc.) from perfusion signals and
visualize the extracted parameters for showing pulmonary
perfusion abnormalities. Since the patient only needs to lie
down for about two seconds, our experiments show that
there is no need to register the lungs in order to perform perfusion analysis.
3.2. A perfusion model
In order to extract perfusion parameters, for instance, systolic phase and diastolic phase, from a perfusion signal, it
requires to accurately locate the “turning points” from the
signal. Obviously, it is rather difficult if solely based on the
perfusion signals as shown in Figures 2 and 3 due to the low
perfusion signal-to-noise ratio. Therefore, it becomes necessary to model the physiological process of pulmonary perfusion. The blood volume change in a lung area is continuous,
smooth, and periodical with two distinct phases for systole
and diastole. To this end, we introduce a perfusion model as
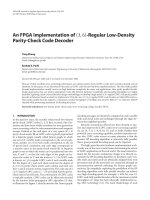
depicted in Figure 4. This perfusion model looks like a sinusoidal function, but it is not symmetrical, so as to explicitly model the two distinct, systolic, and diastolic phases. The
model can be expressed as a mathematical function with five
parameters: amplitude A, downtime D, uptime U, timeshift S,
and level L:
M(A, D, U, S, L, t)
=
A cos(πt /D) + L
A cos π(t − D)/U + π + L
if 0 ≤ t < D,
if D ≤ t < (D + U),
(2)
(3)
and t indicates time. Note that t is always in the interval
[0, D + U). The five parameters have the following medical
meanings:
(i) amplitude A: perfusion strength;
(ii) uptime U: time corresponding to the diastolic phase in
the lung area;
(iii) downtime D: time corresponding to the systolic phase
in the lung area;
(iv) timeshift S: time from the first image to the completion
of the first diastolic phase;
(v) level L: intensity mean—a mathematically necessary
parameter without well-defined medical meaning (i.e.,
its value depends on many factors).
Our novel perfusion model has all the intuitive properties one would like to have in modeling the physiological
process of pulmonary perfusion, but it still remains simple enough for efficient model realization. Once a perfusion
model M( · · · ) is available, a set of perfusion parameters
(A∗ , D∗ , U ∗ , S∗ , and L∗ ) can be extracted from a perfusion
signal O(t) by minimizing the error function
2
e=
M(A, D, U, S, L, t) − O(t) .
(4)
t∈[0,examtime]
with the Levenberg-Marquardt method [16, 17, 18].
In the perfusion literature,Wolfkiel and Rich [19, 20,
21], among other researchers, have developed mathematical
models for estimating myocardial contrast-medium transport process. Their models are not suitable for modeling the
blood volume change of pulmonary perfusion in a specific
lung area because of their lack of the necessary periodical and
nonsymmetrical properties.
3.3.
Robustly accelerating perfusion analysis
with cardiac information
We have formulated the extraction of perfusion parameters
as a nonlinear least squares optimization problem. It is well
known that the convergence speed and result accuracy depend on the initial guess. Therefore, it is essential to have a
good guess when fitting the model to an observation. However, due to the low signal-to-noise ratio, it is difficult to estimate an initial guess from a perfusion signal. It is also the
low signal-to-noise ratio that gives more local minima for the
error function in optimization, consequently, it takes longer
time to converge to a solution. Clearly, it would be desirable
if we can reduce the number of free perfusion model parameters, because it not only reduces the optimization time but
also improves its stability and result accuracy. In the following, we present a simple, yet accurate, approach to extract
cardiac systolic and diastolic phases from the heart, so that
this cardiac information may be utilized to constrain the optimization process, making perfusion analysis not only fast
but also robust.
440
EURASIP Journal on Applied Signal Processing
120
115
100
60
110
Intensity
80
105
40
100
20
95
0
1
2
3
Time (s)
0
(a)
4 4.32
(b)
Figure 1: A case in quiet breath. (a) An ROI in the right lung field and (b) its corresponding lung functional signal (observation), which
reflects the air and blood change in the corresponding lung area over time during the examination, due to the X-ray physical property.
The image gets whiter (higher intensity) during inhalation (more air in the lungs). The ROI shown here is a rectangle, but it may be of an
arbitrary shape. The ROI may be as large as a whole lung and may be as small as a single pixel.
179
180
178.5
160
100
178
Intensity
140
120
177.5
177
176.5
80
60
176
40
175.5
0
0.5
20
(a)
1
Time (s)
1.5
2
(b)
Figure 2: A case with the breath held and an intravenous bolus of X-ray contrast media. (a) An ROI in the right lung field and (b) its
corresponding observation—an enhanced lung perfusion signal, which, due to the X-ray physical property, reflects the blood flow in the
corresponding lung area with contrast media. The image gets darker (lower intensity) during the systolic phase (more blood in the lungs).
Comparing to ventilation in Figure 1, the perfusion signal is very noisy and weak (only about 3 intensity-unit variation).
158
160
80
60
40
20
0
(a)
157
Intensity
140
120
100
157.5
156.5
156
155.5
155
154.5
0
0.5
1
Time (s)
1.5
2
(b)
Figure 3: A case with the breath held but no X-ray contrast media. (a) An ROI in the right lung and (b) its corresponding observation—a
perfusion signal reflecting the blood flow in the lung area due to the X-ray physical property. It is plotted on the same scale as in Figure 2 for
comparison.
441
Level
Timeshift Downtime
Amplitude
Intensity
Dynamic Chest Image Analysis
corresponds to the diastolic phase of the heart. By fitting the
perfusion model to this observation, the systolic and diastolic
phases are available. Mathematically, from the heart observation Oh (t), the fitting can determine a set of parameters (A∗ ,
h
∗
∗
Dh , Uh , S∗ , and L∗ ) which minimize
h
h
2
M Ah , Dh , Uh , Sh , Lh , t − Oh (t) .
Uptime
Examination time (t)
Figure 4: A perfusion model with five free primitive parameters:
amplitude A (perfusion strength in the lung area), downtime D
(time for the systolic phase in the lung area), uptime U (time for
the diastolic phase in the lung area), timeshift S (time from the
first image to the completion of the first diastolic phase), and
level L (the mean intensity but with no well-defined medical
meaning). This function models the blood volume change of pulmonary perfusion. It increases during the diastolic phase and decreases during the systolic phase. The systolic phase is generally
shorter than the diastolic phase. The free parameters downtime D
and uptime U may be further constrained with the cardiac systolic
and diastolic phases extracted from the heart to make the optimization process fast and robust (see Section 3.3).
3.3.1 Extracting systolic and diastolic phases
from the heart
The perfusion examination takes only 2–3 seconds; it is reasonable to assume that the duration of the patient’s systolic
phase is the same anywhere in the lungs during the examination and so is the duration of the diastolic phase. Consequently, the patient’s pulse frequency is the same anywhere
in the lungs during the examination. Based on this assumption, we can extract the systolic and diastolic phases from one
source, the heart, so that the estimated results of the systolic
and diastolic phases can be used as fixed parameters to accelerate the convergence of the optimization processes.
More specifically, first we employ a trick by using an ROI
on the heart border2 as shown in Figure 5a and Figure 6a to
have an observation (also called a heart signal) (see Figure 5b
and Figure 6b). The dominant information this observation
carries is the change of the heart proportion in the ROI from
one frame to another. This signal is generally strong, and the
initial guesses for those parameters can be conveniently estimated from the signal itself. The uptime of this signal corresponds to the systolic phase of the heart, while its downtime
This method is simple and easy to use, but the true magic
is its power to extract accurate systolic and diastolic phases
from the heart without segmentation. We have developed
a technique called united snakes [22, 23], which can accurately extract the cardiac boundary. With united snakes, we
have justified that the simple method is actually accurate
in extracting systolic and diastolic phases for the perfusion
analysis in [15]. However, for measuring the effectiveness of
cardiac function, which is beyond the scope of this paper
and which has been addressed with the united snakes technique in [15], the simple method does have a limitation since
the extracted amplitude parameter cannot be fully trusted.
In perfusion examination, the patient is asked to hold the
breath. The amount of air held in the lungs may differ from
patient to patient and may differ from examination to examination even for the same patient. As a result, when there is
more air kept in the right lung, even if the heart does not
pump effectively, we still may have a higher amplitude due to
the higher contrast along the cardiac boundary. However, for
the purpose of accelerating perfusion analysis, we only need
the estimated systolic and diastolic phases and the amplitude
is not useful in the presented perfusion analysis. Therefore,
in this case, we would prefer this simple and working trick.
3.3.2
Constraining the fitting process
∗
∗
The estimated systolic and diastolic phases (Uh and Dh )
from the heart signal are then used as fixed parameters in extracting the perfusion parameters from observations in the
lung fields (see Figures 7 and 8). However, it should be noted
that the uptime and downtime of an observation in the lung
fields have completely different meanings from those of the
heart signal: the downtime of the signal in the lung areas corresponds to the systolic phase; while its uptime corresponds
to the diastolic phase. Mathematically, from the lung signal
Ol (t), we determine a set of parameters (A∗ , Dl∗ , Ul∗ , S∗ , and
l
l
L∗ ) which minimize
l
M Al , Dl , Ul , Sl , Ll , t − Ol (t)
2
(6)
t ∈[0,examtime]
subject to the constraints
∗
Dl = Uh ,
2 One might argue for using an ROI within the heart area to extract the
systolic and diastolic phases. However, the resulting signal is rather noisy
and weak because of the nature of cardiac motion in the current patient orientation. Moreover, there are no well-defined medical meanings associated
with its parameters if extracted due to the overlapping lung area.
(5)
t ∈[0,examtime]
∗
Ul = Dh .
(7)
∗
Ul∗ = Dh .
(8)
Naturally, we always have
∗
Dl∗ = Uh ,
442
EURASIP Journal on Applied Signal Processing
103
180
102
160
101
Intensity
140
120
100
100
99
80
98
60
97
96
40
0
0.5
20
(a)
1
Time (s)
1.5
2
(b)
Figure 5: An example for extracting the systolic and diastolic phases from the heart in the case with contrast media. (a) An ROI on the
heart border. (b) The corresponding observation and the parameter extraction process. The observation indicated by “◦” mainly reflects the
change of the heart proportion in the ROI from frame to frame. The initial guess is plotted as dashed curve and the final solution as the
solid curve. During the systolic phase, the heart proportion in the ROI becomes smaller and smaller, thus, the average intensity values of
the ROI gets bigger and bigger. In other words, the uptime of this signal corresponds to the systolic phase of the heart; while its downtime
corresponds to the diastolic phase of the heart—the uptime and downtime extracted from a heart signal have completely different medical
meanings from those of an observation in the lung (see Figure 7). The medical meaning of the extracted amplitude from the heart signal is
undefined since not only does it depend on the heart pumping strength but also on the amount of air in the lungs.
115
160
114
140
80
113
Intensity
120
100
112
111
110
60
109
108
40
20
0
(a)
0
0.5
1
Time (s)
1.5
2
(b)
Figure 6: An example for extracting the cardiac systolic and diastolic phases in the case without using contrast media. The same convention
is used as in Figure 5.
Therefore, the perfusion analysis gives three parameters (perfusion amplitude, timeshift, and level). However, our experiments showed that we only need the perfusion amplitude
which appears to be sufficient for detection of pulmonary
embolism.
3.4. ROI-based analysis and pixel-based analysis
The perfusion analysis we have seen so far is called ROIbased analysis, because the user specifies an ROI in the lung
field and the system automatically extracts the perfusion amplitude parameter from its corresponding perfusion signal.
This type of analysis is flexible and convenient in examining
a particular area of lungs since the ROI can be placed anywhere in the lung fields; it may be of arbitrary shape, may
be as large as a whole lung, and may be as small as a single pixel. Meanwhile, we are also interested in a whole picture of the pulmonary perfusion in both lungs. This is what
a pixel-based analysis does. In a pixel-based analysis, we first
construct all the perfusion signals by regarding each single
pixel in the lung fields as an ROI, then we visualize the extracted amplitude parameters from all these perfusion signals
as an image, which is called perfusion amplitude image. In a
perfusion amplitude image, a white area (with high intensity
values) indicates strong perfusion in the area, while the dark
areas are those with weak perfusion or no perfusion.
4.
EFFECTS OF CONTRAST MEDIA
The major challenge we face in perfusion analysis is to deal
with the low perfusion signal-to-noise ratio. Contrast media can significantly enhance the pulmonary perfusion signal
strength as illustrated in Figure 9. The perfusion amplitude
image in Case (a) shows the inflow of contrast media into the
pulmonary arteries causing strong arterial signal indicated
by an arrow, while Case (b) represents the inflow period of
contrast media through the right subclavian vein. However,
Dynamic Chest Image Analysis
443
179
180
178.5
160
178
Intensity
140
120
100
177.5
177
80
176.5
60
40
176
175.5
0
0.5
20
(a)
1
Time (s)
1.5
2
(b)
Figure 7: Using the cardiac systolic and diastolic phases to constrain the parameter extraction from an enhanced pulmonary perfusion
signal with contrast media. (a) An ROI in the right lung field. (b) The perfusion signal (indicated by “◦”, first shown in Figure 2b) and the
parameter extraction process. The downtime of a pulmonary perfusion signal corresponds to its systolic phase (more blood in the lung
area); while the uptime corresponds to its diastolic phase (less blood in the lung area). Comparing to the model fitting to a heart signal in
Figure 5b, this fitting to the perfusion signal seems inaccurate; actually, this seemingly inaccurate fitting demonstrates that the model-based
approach constrained with cardiac information is robust in extracting the perfusion component from a weak perfusion signal without being
disturbed by the strong noise.
158
160
157.5
140
80
60
40
20
0
157
Intensity
120
100
156.5
156
155.5
155
154.5
(a)
0
0.5
1
Time (s)
1.5
2
(b)
Figure 8: Using the cardiac systolic and diastolic phases to constrain the parameter extraction from a pulmonary perfusion signal. (a) An
ROI in the lung field. (b) The perfusion signal and the parameter extraction process. The same convention is used as in Figure 7.
this also means that contrast media may cause some artifacts
disturbing the parameter image interpretation. Furthermore,
contrast media are expensive, carry a risk of contrast media reactions, should not be used in patients with pulmonary
edema or any renal problem, and also require timing in taking the X-ray series. Therefore, it is ideal that no contrast
media are used in perfusion analysis. We show in Section 5
that our model-based approach can make it possible without
contrast media by utilizing the cardiac information extracted
from the heart.
medicine (NM). Both CT and NM are the “golden standard” method in detection of pulmonary perfusion disturbances (e.g., pulmonary embolism). NM shows the distribution of pulmonary perfusion, while CT reveals the thrombotic masses causing pulmonary embolism. In the following, we classify the perfusion abnormal findings into three
types, and illustrate the three types of perfusion abnormalities with three representative cases, followed by a summary
of our findings from the clinical case studies.
5.1.
5.
CLINICAL CASE STUDIES
In clinical evaluation, 52 patients were referred to this examination by the chest physician mainly to exclude pulmonary
embolism. All of them were examined with no contrast media at their request. In order to validate our findings with this
new technique, these patients were also examined with computed tomography (CT) and pulmonary perfusion nuclear
Three types of perfusion abnormalities
Based on the perfusion amplitude image, we have classified
perfusion abnormal findings into the following three types.
(i) No perfusion (NP): the perfusion amplitude is extremely small or zero. This is associated with the
complete occlusion of pulmonary arteries by an embolism, and often seen in the upper and middle parts
of the lung. When the no-perfusion area becomes
444
EURASIP Journal on Applied Signal Processing
Table 1: Statistics of perfusion abnormalities, where the number,
for instance, 6/8, means that no perfusion is found in 6 and 8 cases
out of the 52 patients in the upper region of the right and left lung,
respectively.
Right/Left
NP
RP
OP
Upper
Middle
Lower
6/8
6/4
4/7
15/16
9/10
20/15
3/2
7/20
4/9
(a)
Case 2 (see Figure 11). Pulmonary embolism in the right
lung and in the superior segment of the left lower lobe shown
by CT and NM studies is correlated to RP of the right lung
and RP of the left apex and a small area in the upper left lung
field. OP is seen centrally in the left lung.
Case 3 (see Figure 12). Generally, RP of the right lung and
NP of the lateral recess in the left lung. These findings are
consistent with CT and NM studies. OP seen centrally in the
left lung is due to the redirection of blood flow.
(b)
Figure 9: Perfusion amplitude images of two clinical cases with
contrast media. An amplitude image gives an overall picture of lung
perfusion, which is constructed from the amplitude parameters extracted from all the perfusion signals when regarding each single
pixel in the lung fields as an ROI. (a) There is an inflow of contrast
media into pulmonary arteries causing strong arterial signal (indicated by an arrow). (b) This case represents the inflow period of
contrast media through the right subclavian vein and pulmonary
arteries indicated by arrows.
larger, likely there will be associated overactive perfusion (OP) in the normal part(s) of the lungs.
(ii) Reduced perfusion (RP): the perfusion amplitude becomes smaller than expected and can be seen as darker
areas in the perfusion amplitude image. This is the typical phenomenon of pulmonary embolism with partial
occlusion.
(iii) Overactive perfusion (OP): the perfusion amplitude is
bigger than expected and the area should be considered as normal. This is the phenomenon caused by the
excessive blood flow redirected into the normal area
due to no-perfusion and reduced perfusion in other
parts of the lungs.
5.2. Three representative clinical cases
In order to illustrate the three types of perfusion abnormalities, here we include three representative cases.
Case 1 (see Figure 10). Pulmonary embolism of the right
middle lobe and the right upper lobe is associated with RP
in the middle and upper fields of the right lung. In addition,
there is RP in the left upper lobe and perihilar region of the
left lower lobe. The reason for a very high amplitude (OP) in
the right lower lung field is due to the high concentration of
the blood in this area. These findings show a good correlation
with both CT and NM studies.
5.3.
Statistics of perfusion abnormalities
The lung field may be visually divided into three regions (upper, middle, and lower). The statistics of perfusion abnormalities found in the 52 patients are summarized in Table 1.
The abnormal patterns with the amplitude parameter images of the 52 patients were identified by the authors. We
have established 100% correlations with the CT and NM
studies. However, by correlation, we do not mean an exact
mapping (equivalence) of our results to the CT and NM results. Actually, we have found that our results are complementary to the CT and NM studies in some cases. For instance, in Case 1 (Figure 10), the overactive perfusion seen
in the right lower lung field convinces us that the right pulmonary artery is only partially filled with embolic masses,
while in Case 2 (Figure 11), the reduced perfusion of the
lower part of the right lung seen in the amplitude image cannot be justified by the NM study but later confirmed by the
thrombotic mass in the hilar region of the right lung with
CT.
5.4.
Summary and discussion
In our clinical evaluation, we have found that it is fairly
easy to identify the three types of perfusion abnormalities
in a perfusion amplitude image. Actually, all the perfusion
abnormal patterns were first recognized by the first author
(Liang)—a computer scientist—without knowing the findings from the CT and NM studies, then confirmed by the
medical coauthors (Kormano and Svedstră m). The CT and
o
NM studies were performed routinely by the CT and NM
specialists in the hospital, and their reports were further
verified by the medical coauthors for our clinical evaluation when necessary. Based on our own classification experience with the 52 patients, we are developing a patternclassification procedure for automatically partitioning an
amplitude image into normal and abnormal (NP, RP, and
OP) regions.
Dynamic Chest Image Analysis
(a) Perfusion amplitude.
445
(b) CT slice 1.
(c) CT slice 2.
Figure 10: Case 1. (a) OP is seen in the right lower lung field (indicated by a bracket), while slightly RP is shown in the rest of the right lung.
RP is revealed in the central part of the left lung (indicated by an arrow). The CT images, (b) and (c), of the same patient show embolic
masses partially filling the right pulmonary artery and also material in the left lower lobe artery (indicated by arrows).
(a) Perfusion amplitude.
(a) Perfusion amplitude.
(b) Nuclear machine.
(b) Nuclear machine.
Figure 11: Case 2. (a) Overall RP of the right lung. OP is seen centrally in the left lung, while RP is shown in the left apex and a small
area (indicated by an arrow) in the upper left lung field. Pulmonary
embolism in the right lung and in the superior segment of the left
lower lobe shown by CT and NM (b) studies. Generally, the NM image shows the perfusion activity in the anterior parts of the lungs,
while our perfusion amplitude image reveals perfusion through the
lungs. Therefore, the reduced perfusion of the lower part of the right
lung shown by our method (a) may be explained by the thrombotic
mass in the hilar region of the right lung as reported by CT.
Figure 12: Case 3. (a) Generally RP of the right lung. NP of the lateral recess in the left lung (indicated by an arrow). OP seen centrally
in the left lung. These findings are consistent with NM (b) studies.
The clinical evaluation shows that our model-based
method for pulmonary perfusion analysis is effective for
pulmonary embolism even without using contrast media,
demonstrating consistent correlations with CT and NM
studies. This gives our present technique some advantages.
It takes only about 2 seconds and involves no radioactive isotopes, no contrast media, and only low radiation dose. The
NM study takes much longer (over 20 minutes) and it is
not readily available in any hospital. The CT study uses high
amount of contrast media and has side effects. Furthermore,
CT is expensive and cannot be used for all patients (e.g.,
anxiety and contrast media reactions). In perfusion analysis,
our focus is on detecting pulmonary embolism, while our
ventilation analysis is more effective for detecting other pulmonary diseases (such as, pulmonary emphysema, pneumonia, fibrosis, and scar changes, etc.) [13, 14]. In the future,
446
EURASIP Journal on Applied Signal Processing
Figure 13: Case 3. Perfusion amplitude image obtained from an
analysis without using cardiac information. Compared with the amplitude image in Figure 12a, this amplitude image is rather noisy
in the no-perfusion and reduced perfusion areas. The no-perfusion
area of the lateral recess in the left lung is not so visible as that in
Figure 12a.
we plan to apply many general methods reported in the literature to our data for detecting various pulmonary diseases
(e.g., [5, 6, 7, 8, 24, 25, 26, 27, 28]), while developing new
computer methods oriented to our special imaging modality.
In the image acquisition process, the lungs in 3D is projected onto a 2D image plane and some anatomical inaccuracy has been introduced. However, this imaging modality
is appealing for achieving our goal to provide an efficient
and rapid imaging solution to detect lung ventilation and
perfusion abnormalities. It appears to have no serious consequences when powered with our model-based approach.
This performance of our computer analysis method is the
consequence of the idea of reducing the number of free perfusion model parameters (see Section 3.3), which makes the
optimization process not only fast but also robust in computation. For comparison, we present here a test on Case 3
without constraining uptime and downtime with the cardiac
information. It takes about 10 times longer and the results
are rather sensitive to noise, specially in the no-perfusion
and reduced perfusion areas as shown in Figure 13. Perfusion analysis is to show pulmonary perfusion abnormalities
(i.e., no-perfusion and reduced perfusion). In a reduced perfusion area, the signal component with the pulse frequency
is weak, while in a no-perfusion area its observation has no
such a component. When the uptime and downtime are constrained, the extraction process will only search for the component with the pulse frequency in the observation, consequently, it will be able to quickly and robustly give a small
value or zero to the amplitude parameter in the reduced perfusion area or no-perfusion area without being disturbed by
noise.
6.
CONCLUSION
We have presented a computer analysis method for pulmonary perfusion study in dynamic pulmonary imaging.
Two clinical cases have been used to illustrate the effects
of contrast media. To enable comparison with CT and NM
studies, perfusion abnormal findings are classified into three
types. The clinical evaluation has shown that our computer
analysis method is effective for pulmonary embolism even
without using contrast media, demonstrating consistent correlations with CT and NM studies. This performance is
the consequence of the idea that the cardiac information,
recorded in the perfusion image sequence, may be utilized
to accelerate pulmonary perfusion analysis and improve its
sensitivity in detecting pulmonary embolism. In doing so, a
simple, yet accurate, approach has been introduced to extract
cardiac systolic and diastolic phases from the heart for constraining the optimization processes. This idea has not only
made perfusion analysis fast but also robust; consequently,
perfusion analysis becomes feasible without using contrast
media. This fluoroscopical examination has several advantages: it takes only about 2 seconds for perfusion study, involving no preparation, no radioactive isotopes, no contrast
media, and only low radiation dose to patient.
ACKNOWLEDGMENTS
This research has been sponsored by the National Technology
Agency of Finland, the Academy of Finland, Turku Centre for
Computer Science, and the Instrumentarium Foundation. J.
Liang wishes to thank the Faculty of Mathematics and Natural Sciences of the University of Turku for the Faculty Research Award to the Dynamic Chest Image Analysis project.
The authors would like to thank Professor Milan Sonka and
the anonymous reviewers for their insightful comments and
suggestions.
REFERENCES
[1] H. C. Becker, W. J. Nettleton, P. H. Myers, J. W. Sweeney, G. R.
Mechstroth, and C. M. Nice, “Digital computer determination of a medical diagnostic index directly from chest X-ray
images,” IEEE Transactions on Biomedical Engineering, vol. 11,
pp. 67–72, 1964.
[2] P. H. Myers, C. M. Nice, H. C. Becker, W. J. Nettleton, J. W.
Sweeney, and G. R. Mechstroth, “Automated computer analysis of radiographic images,” Radiology, vol. 83, pp. 1029–1033,
1964.
[3] D. H. Ballard, Hierarchic Recognition of Tumors in Chest
Radiographs with Computer, Birkhauser, Basel, Switzerland,
1976.
[4] Y. P. Chien and K.-S. Fu, “Recognition of X-ray picture patterns,” IEEE Trans. Systems, Man, and Cybernetics, vol. 4, no.
2, pp. 145–156, 1974.
[5] M. L. Giger, K. Doi, H. MacMahon, et al., “An “intelligent”
workstation for computer-aided diagnosis,” RadioGraphics,
vol. 13, pp. 647–656, 1993.
[6] X. W. Xu, K. Doi, T. Kobayashi, H. MacMahon, and M. L.
Giger, “Development of an improved CAD scheme for automated detection of lung nodules in digital chest images,” Medical Physics, vol. 24, no. 9, pp. 1395–1403, 1997.
[7] S. G. Armato 3rd, M. L. Giger, H. MacMahon, C. T. Chen,
and C. J. Vyborny, “Automated registration of ventilation/perfusion images with digital chest radiographs,” Academic Radiology, vol. 4, no. 3, pp. 183–192, 1997.
[8] A. Kano, K. Doi, H. MacMahon, D. D. Hassell, and M. L.
Giger, “Digital image subtraction of temporally sequential chest images for detection of interval change,” Medical
Physics, vol. 21, no. 3, pp. 453–461, 1994.
Dynamic Chest Image Analysis
[9] A. Kiuru, E. Svedstră m, and I. Kuuluvainen, “Dynamic imago
ing of pulmonary ventilation: Description of a novel digital
fluoroscopic system,” Acta Radiologica, vol. 32, pp. 114–119,
1991.
[10] A. Kiuru, E. Svedstră m, J. Mă ki, and K. Kă rpijoki, “Dynamic
o
a
a
pulmonary ventilation imaging: Clinical usage with Windows
interface,” in CAR ’96: Computer Assisted Radiology, pp. 179–
184, Paris, France, June 1996.
[11] E. Svedstră m, Dynamic pulmonary imaging: development and
o
evaluation of a new technique with a special reference to pediatric ventilation studies, Academic dissertation Med.-Odont.
89, Turku University, Turku, Finland, March 1992.
[12] E. Svedstră m, A. Kiuru, and H. J. Puhakka, Dynamic imago
ing of pulmonary ventilation in children using digital subtraction radiography,” Acta Radiol., vol. 31, pp. 5358, 1990.
[13] J. Liang, T. Jă rvi, A. J. Kiuru, M. Kormano, E. Svedstră m, and
a
o
R. Virkki, “Dynamic chest image analysis: model-based ventilation study with pyramid images,” in Medical Imaging 1997:
Physiology and Function from Multidimensional Images, E. A.
Hoffman, Ed., vol. 3033 of SPIE Proceedings, pp. 81–92, Newport Beach, Calif, USA, February 1997.
[14] J. Liang, R. Virkki, T. Jă rvi, A. Kiuru, M. Kormano, and
a
E. Svedstră m, “Dynamic chest image analysis: evaluation of
o
model-based ventilation study with pyramid images,” in IEEE
1st International Conference on Intelligent Processing Systems,
R. Zurawski and Z.-Q. Liu, Eds., pp. 989–993, Beijing, China,
October 1997.
[15] J. Liang, Dynamic chest image analysis. New model-based
methods for dynamic pulmonary imaging and other applications, TUCS Dissertations No. 31, Turku Centre for Computer
Science, Turku, Finland, December 2000.
[16] K. Levenberg, “A method for the solution of certain nonlinear problems in least squares,” Quarterly Applied Mathematics, vol. 2, pp. 164–168, 1944.
[17] D. W. Marquardt, “An algorithm for least-squares estimation
of nonlinear parameters,” SIAM J. Appl. Math., vol. 11, pp.
431–441, 1963.
[18] L. E. Scales,
Introduction to Non-Linear Optimization,
Macmillan Publishers, London, UK, 1985.
[19] C. J. Wolfkiel, “Local motion identification and correction
schemes for ultrafast CT flow studies,” in Proc. 5th IEEE
Symposium on Computer-Based Medical Systems, pp. 582–585,
Durham, NC, USA, 1992.
[20] C. J. Wolfkiel, “Correction of UFCT regional myocardial time
density curve artifactual heterogeneities,” in Proc. IEEE Computers in Cardiology, pp. 737–739, Bethesda, Md, USA, October 1994.
[21] C. J. Wolfkiel and S. Rich, “Analysis of regional pulmonary
enhancement in dogs by ultrafast computed tomography,” Investigative Radiology, vol. 27, no. 3, pp. 211–216, 1992.
[22] J. Liang, T. McInerney, and D. Terzopoulos, “Interactive medical image segmentation with united snakes,” in Proc. 2nd International Conf. on Medical Image Computing and ComputerAssisted Intervention (MICCAI ’99), pp. 116–127, Springer,
Cambridge, England, September 1999.
[23] J. Liang, T. McInerney, and D. Terzopoulos, “United snakes,”
in Proc. 7th International Conf. on Computer Vision (ICCV
’99), vol. 2, pp. 933–940, IEEE Computer Society Press, Corfu,
Greece, September 1999.
[24] E. A. Hoffman and G. Mclennan, “Assessment of the
pulmonary structure-function relationship and clinical outcomes measures: quantitative volumetric CT of the lung,”
Academic Radiology, vol. 4, no. 11, pp. 758–776, 1997.
[25] J. K. Tajik, B. Q. Tran, and E. A. Hoffman, “CT-based assessment of regional pulmonary blood flow parameters: an update,” in Medical Imaging 1999: Physiology and Function from
447
Multidimensional Images, vol. 3660 of SPIE Proceedings, pp.
181–187, San Diego, Calif, USA, 1999.
[26] R. Uppaluri, E. A. Hoffman, M. Sonka, P. G. Hartley, G. W.
Hunninghake, and G. McLennan, “Computer recognition of
regional lung disease patterns,” American Journal of Respiratory and Critical Care Medicine, vol. 160, no. 2, pp. 648–654,
1999.
[27] R. Uppaluri, E. A. Hoffman, M. Sonka, G. W. Hunninghake,
and G. McLennan, “Interstitial lung disease: A quantitative
study using the adaptive multiple feature method,” American
Journal of Respiratory and Critical Care Medicine, vol. 159, no.
2, pp. 519–525, 1999.
[28] R. Uppaluri, T. Mitsa, M. Sonka, E. A. Hoffman, and
G. McLennan, “Quantification of pulmonary emphysema
from lung computed tomography images,” American Journal
of Respiratory and Critical Care Medicine, vol. 156, no. 1, pp.
248–254, 1997.
Jianming Liang was born in 1965 in Shanxi,
China. He received his B.S. degree in 1987
from the University of Science and Technology, Beijing, China, M.S. degree in 1990
from the North China Institute of Computing Technology, Beijing, China, and Ph.D.
degree in 2000 from the Turku Centre
for Computer Science, University of Turku,
Finland, all in computer science. He was an
NSERC Industrial Research Fellow (2001–
2002, NSERC: the Natural Sciences and Engineering Research
Council of Canada). Presently, he is with Siemens Medical Solutions USA, Inc. in Malvern, Pa. His research interests include computer vision, medical image analysis, optimization, probabilistic
reasoning, and software engineering.
Timo Jă rvi was born in 1942 in Helsinki,
a
Finland. He received his M.S. degree in 1967
in mathematics, Ph.D. degree in 1973 in
applied mathematics, both from the University of Turku, Finland. He worked as a
Lecturer (1971–1974), Associate Professor
(1974–1975), and Professor (from 1975 till
now) of computer science in the University of Turku. Since 2002 he is a Director
of Turku Centre for Computer Science. His
research interests include databases, computer architecture, and
medical informatics.
Aaro Kiuru was born in 1940 in Helsinki,
Finland. He received his M.S. degree in 1966
in physics, mathematics, and theoretical
physics, Lic.Ph. degree in 1970 in physics,
and Ph.D. degree in 1972 in nuclear physics
from the Department of Physics, University
of Helsinki. He was a Chief Physicist (1990–
1992) at Central Laboratory, Helsinki University Central Hospital. Presently, he is a
Chief Physicist in the Department of Oncology and Radiotherapy & Department of Radiology, Turku University Central Hospital. He was a docent (since 1980) in medical
physics in the Faculty of Medicine, University of Turku and (since
1977) in Physics in the Faculty of Natural Sciences, University of
Helsinki. His research interests include dynamic pulmonary imaging, image processing, medical physics, and picture archive communications system (PACS).
448
Martti Kormano was born in 1941 in
Savonlinna, Finland. He was a Doctor
(1967) in medical science at the University of Helsinki, Finland, Resident Professor in radiology at the University Central
Hospital, Helsinki (1969–1971), Docent of
diagnostic radiology at the University of
Helsinki (1979–1985), Associate Professor
of diagnostic radiology at the University of
Turku, Finland (1972–1985), and Professor
and Chairman of the Department of Radiology at the Helsinki
University Central Hospital, Turku, Finland (from 1985 till now).
His research interests include differential diagnosis, magnetic resonance imaging, medical image processing and transfer.
Erkki Svedstră m was born in 1953. He is
o
the Chief Paediatric Radiologist at the University Hospital of Turku, Finland. Since
1994, he works as Senior Lecturer in diagnostic radiology and paediatric radiology at the University of Turku, Finland.
His Ph.D. thesis was entitled Dynamic Pulmonary Imaging: Development and Evaluation of a New Technique with a Special Reference to Pediatric Ventilation Studies (1992).
His research covers mainly clinical pediatric radiology, pulmonary
radiology, uroradiology, and distribution of radiology in Scandinavia.
EURASIP Journal on Applied Signal Processing