EURASIP Journal on Applied Signal Processing 2003:4, 378–391 c 2003 Hindawi Publishing ppt
Bạn đang xem bản rút gọn của tài liệu. Xem và tải ngay bản đầy đủ của tài liệu tại đây (1.43 MB, 14 trang )
EURASIP Journal on Applied Signal Processing 2003:4, 378–391
c
2003 Hindawi Publishing Corporation
Collaborative In-Network Processing for Target Tracking
Juan Liu
Palo Alto Research Center, 3333 Coyote Hill Road, Palo Alto, CA 94304, USA
Email:
James Reich
Palo Alto Research Center, 3333 Coyote Hill Road, Palo Alto, CA 94304, USA
Email:
Feng Zhao
Palo Alto Research Center, 3333 Coyote Hill Road, Palo Alto, CA 94304, USA
Email:
Received 21 December 2001 and in revised form 4 October 2002
This paper presents a class of sig nal processing techniques for collaborative signal processing in ad hoc sensor networks, focusing
on a vehicle tracking application. In particular, we study two types of commonly used sensors—acoustic-amplitude sensors for tar-
get distance estimation and direction-of-arrival sensors for bearing estimation—and investigate how networks of such sensors can
collaborate to extract useful information with minimal resource usage. The information-driven sensor collaboration has several
advantages: tracking is distributed, and the network is energy-efficient, activated only on a when-needed basis. We demonstrate
the effectiveness of the approach to target tracking using both simulation and field data.
Keywords and phrases: sensor network, target tracking, distributed processing, Bayesian filtering, beamforming, mutual infor-
mation.
1. INTRODUCTION
Sensors of various types have already become ubiquitous
in modern life, from infrared motion detectors in our light
switches to silicon accelerometers in the bumpers of our cars.
As the cost of the sensors comes down rapidly due to ad-
vances in MEMS fabrication and because these sensors in-
creasingly acquire networking and local processing capabili-
ties, new types of software applications become possible, dis-
tributed among these everyday devices and performing func-
tions previously impossible for any of the devices indepen-
dently. Enabling such functionality without overtaxing the
resources of the existing devices, especially when these de-
vices are untethered and running on batteries, may require
us to rethink some important aspects of how sensing systems
are designed.
1.1. Advantages of distributed sensor networks
There are a number of reasons why networked sensors have a
significant edge over existing, more centralized sensing plat-
forms.
An ad hoc sensor network can be flexibly deployed in an
area where there is no a priori sensing infrastructure. Cover-
age of a large area is important for tracking events of a sig-
nificant spatial extent as in tracking e vents of a significant
spatial extent, as in tracking a large number of events simul-
taneously, or for tracking dynamic events traversing the sens-
ing ranges of many individual sensors, as in tracking a mov-
ing vehicle.
In cases of tracking low-observable phenomena, such as a
person walking in an obstacle field in an urban environment
or a stealthy military vehicle, the signal-to-noise ratio (SNR)
of data collected from a central location may be unaccept-
able. As sensor density increases, the mean distance f rom the
nearest sensor to a target decreases and the SNR received at
the nearest sensor improves.
A large-area sensor network may also activate different
parts of the network to process different queries from users,
supporting a multimode, multiuser operation.
1.2. Sensor network challenges
The design of signal processing applications for the sensor
networks involves a number of significant challenges. The
primary concern is the limited energy reserve at each node.
Combining information from spatially distributed sensor
nodes requires processing and communicating sensor data,
hence consumes energy. Second, the network must be able to
scale to large numbers of nodes and to track many events.
To address these challenges, the sensor network must
blend sensing application with network routing so that the
Collaborative In-Network Processing for Target Tracking 379
communication is informed by the application needs. Data
source selection is key to conserving network resources,
managing network traffic, and achieving scalabilit y.
1.3. Collaborative signal processing
Traditional signal processing approaches have focused on op-
timizing estimation quality for a set of available resources.
However, for power-limited and multiuser decentralized sys-
tems, it becomes critical to carefully select the embedded sen-
sor nodes that participate in the sensor collaboration, balanc-
ing the information contribution of each against its resource
consumption or potential utility for other users.
This approach is especially important in dense networks,
where many measurements may be highly redundant. The
data required to choose the appropriate information sources
may be dynamic and may exist solely on sensors already par-
ticipating in the collaboration. We use the term collaborative
signal processing to refer to signal processing problems dom-
inated by this issue of selecting embedded sensors to partici-
pate in estimation.
There already exist a number of approaches to col-
laborative signal processing. Brooks et al. [1]describeda
prediction-based sensor collaboration that uses estimation
of target velocities to activate regions of sensors. Our ap-
proach builds on an information-driven approach to track-
ing that exploits information from both residual uncertain-
ties of the estimation as well as vehicle dynamics (e.g., dy-
namics as in the Brooks et al. approach). Estrin et al. [2]
developed the directed diffusion approach to move sensor
data in a network that seeks to minimize communication dis-
tance between data sources and data sinks. Their approach
has been successfully demonst rated in experiments. Our al-
gorithms build on the directed diffusion so that the network
routing is further informed by application-level knowledge
about where to send information and where to get useful in-
formation.
1.4. Organization of this paper
In this paper, we describe a particular approach to collabora-
tive signal processing. A class of signal-processing algorithms
will be presented to support the so-called information-
driven sensor collaboration. The application of tracking a
maneuvering vehicle will be used a s a primary example
throughout the discussion. Finally, experimental results from
simulation and field data will be presented to validate the ap-
proach.
2. SENSOR NETWORK AND TARGET TRACKING
The ability to track a target is essential in many commer-
cial and military applications. For example, battlefield situ-
ational awareness requires an accurate and timely determi-
nation of vehicle locations for targeting purposes. Other ap-
plications include facility security and highway trafficmon-
itoring. Networked sensors are often ideally suited for tar-
get tracking because of their spatial coverage and multiplic-
ity in sensing aspe ct and modality. Each sensor acquires local,
partial, and relatively crude information from its immediate
environment; by exploiting the spatial and sensing diversity
of a multitude of sensors, the network can arrive at a global
estimation by suitably combining the information from the
distributed sources.
In this paper, we follow the information-driven sensor
querying (IDSQ) framework in which sensors are selectively
activated based on their utility and cost [3]. The applica-
tion focus will be on tracking a moving vehicle through
a two-dimensional sensor field. Because of the constraints
on sensing range, computation, communication bandwidth,
and energy consumption, we consider a leader-based track-
ing scheme, where at any time instant there is only one sensor
active, namely, the leader sensor, while the rest of the net-
work is idle. The leader applies a measurement to its predic-
tion of vehicle position and produces a posterior belief about
the target location. The updated belief is then passed on to
one of the neighboring sensors. The original leader goes back
to sleep, and the sensor which receives the belief becomes
the new leader, and the process of sensing, estimation, and
leader selection repeats. The leader-based scheme has several
advantages. Selective sensor activation and communication
make the network energy-efficient of lower probability of de-
tection, and are capable of supporting multiuser operation or
multitarget tracking.
We use the following notations throughout this paper:
(i) superscript t denotes time. We consider discrete time
t ∈ Z
+
,
(ii) subscript k ∈{1, ,K} (where applicable) denotes
sensor index. This K is the total number of sensors in
the network,
(iii) the target state at time t is denoted as x
(t)
. Without
loss of generality, we consider the tracking application,
where x
(t)
is the location of the moving object in a two-
dimensional plane,
(iv) the sensor measurement of sensor at time t is denoted
z
(t)
,
(v) the measurement history up to time t is denoted as z
(t)
,
that is, z
(t)
={z
(0)
,z
(1)
, ,z
(t)
},
(vi) the collec tion of all s ensor measurements at time t are
denoted as z
(t)
, that is, z
(t)
={z
(t)
1
,z
(t)
2
, ,z
(t)
K
}. This is
used only in Section 2.2 when our distributed tracking
system is compared to a fully centralized system.
2.1. Distributed Bayesian estimation
The goal of tracking is to obtain a good estimate of the tar-
get location x
(t)
from the measurement h istory z
(t)
. For this
problem, we use the classic Bayesian approach. We would like
our estimate x( z
(t)
) to be, on average, as close to the true
value x
(t)
as possible according to some measure. That is, the
estimate should minimize the average cost
Ᏹ = E
d
x
z
(t)
,x
(t)
, (1)
where d(
·, ·) is a loss function to measure the estimator per-
formance. For example, d(x,x) =x − x
2
measures the
square of l
2
distance between the estimate and its true value.
380 EURASIP Journal on Applied Signal Processing
x
(t)
: target position at time t; z
(t)
: sensor measurement at time t;
v
max
: upper bound on target speed; ᏺ :neighborlist.
Step 0. Sleep until receive handoff package (t, p(x
(t)
|z
(t)
)).
Step 1. Diffuse belief using vehicle dynamics
p(x
(t+1)
|z
(t)
) =
p(x
(t+1)
|x
(t)
) · p(x
(t)
|z
(t)
)dx
(t)
.
Step 2. Do sensing:
compute z
(t+1)
;
compute p(z
(t+1)
|x
(t+1)
).
Step 3. Compute p(x
(t+1)
|z
(t+1)
) ∝ p(z
(t+1)
|x
(t+1)
)p(x
(t+1)
|z
(t)
).
Step 4. For sensor k ∈ ᏺ,
compute information utility I
k
= I(x
(t+2)
; z
(t+2)
|z
(t+1)
)
select k
next
= arg max I
k
.
Step 5. Handoff (t +1,p(x
(t+1)
|z
(t+1)
)) to k
next
.Gobacktostep0.
Algorithm 1: Algorithm for IDSQ tracker at each node.
For this loss function, the estimate is
x
(t)
MMSE
= E
x
(t)
z
(t)
=
x
(t)
p
x
(t)
z
(t)
dx
(t)
. (2)
This estimator is known as the minimum mean-squared er-
ror (MMSE) estimator [4]. We informally refer to the current
a posteriori distribution p(x
(t)
|z
(t)
) as the belief. The key is-
sue is how to compute the belief efficiently.
As briefly explained earlier, we use a leader-based tracker
to minimize computation and power consumption require-
ments. At time t, the leader receives a belief state p(x
(t)
|z
(t)
)
from the previous leader, and takes a new measurement
z
(t+1)
. We assume that the following conditional indepen-
dence assumptions are satisfied:
(i) conditioned on x
(t+1)
, the new measurement z
(t+1)
is
independent of the past measurement history z
(t)
;
(ii) conditioned on x
(t)
, the new position x
(t+1)
is indepen-
dent of z
(t)
.
These are standard assumptions in dynamics and fairly mild
in practice. Under these assumptions, based on the new mea-
surement, the leader computes the new belief p(x
(t+1)
|z
(t+1)
)
using the sequential Bayesian filtering
p
x
(t+1)
z
(t+1)
∝ p
z
(t+1)
x
(t+1)
·
p
x
(t+1)
x
(t)
· p
x
(t)
z
(t)
dx
(t)
.
(3)
Sequential Bayesian filtering includes the traditional Kalman
filtering [5] as a special case. While the former is restricted to
linear systems and explicitly assumes Gaussian belief states
and error models, the latter is suitable for more general dis-
crete time dynamic systems. This is useful in multisensor tar-
get tracking, where the sensor models and vehicle dynamics
are often non-Gaussian and/or nonlinear, as will be discussed
in Section 3.
In (3), p(x
(t)
|z
(t)
) is the belief inherited from the previous
step; p(z
(t+1)
|x
(t+1)
) is the likelihood of observ ation given the
target location; p(x
(t+1)
|x
(t)
) is related to vehicle dynamics.
For example, if the vehicle is moving at a known velocity v,
then p(x
(t+1)
|x
(t)
) is simply δ(x
(t+1)
− x
(t)
− v). However, in
practice, the exact vehicle velocity is rarely known. We as-
sume that the vehicle has a speed “uniformly” (i.e., distance
traveled per sample interval) distributed in [0,v
max
], and the
vehicle heading is uniform in [0, 2π). Therefore, p(x
(t+1)
|x
(t)
)
is a disk centered at x
(t)
with radius v
max
. Under this model,
the predicted belief p(x
(t+1)
|z
(t)
) (the integral in (3)) is ob-
tained by convolving the old belief p(x
(t)
|z
(t)
) with the uni-
form circular disk kernel. The convolution reflects the dilated
uncertainty about target location due to motion.
Once the updated belief p(x
(t+1)
|z
(t+1)
) is computed, the
current leader hands it off to one of its neighboring sensors
and goes back to sleep. An information-driven sensor selec-
tion criterion, described in Section 4, is used to decide which
neighboring sensor to hand the belief to based on the ex-
pected contribution from that sensor. The most “informa-
tive” sensor is selected and becomes the leader for the next
time step t + 1. The IDSQ tracking algorithm is summarized
in Algorithm 1.
Note that minimal assumptions are made in this formu-
lation. We do not require any knowledge about the road con-
figuration, and do not make the exclusive a ssumption that
the vehicle travels only on a road. In particular, the vehicle
dynamics model is rather crude. The vehicle can accelerate,
decelerate, turn, or stop. We assume that the vehicle velocity
sequence sampled at the tracking interval is statistically inde-
pendent. Only v
max
has to be known or assumed. These min-
imal assumptions allow the algorithm to achieve simplicity,
flexibility, and wide applicability. On the other hand, more
accurate prior knowledge can be incorporated to further im-
prove the performance. For example, adding road constraints
could further improve the tracking accuracy and decrease the
Collaborative In-Network Processing for Target Tracking 381
Table 1: Single-step cost for centralized and distributed Bayesian t racking. In the second row, ᏺ is the leader’s neighbor list. The last row is
the power needed to communicate reliably through radio. We assume a particular model where the communication power is adjustable and
is proportional to the communication distance raised to the power of RF attenuation exponent α (α ≥ 2). RF overhead consumption and
power consumption of sensing and is neglected.
Centralized Distributed
Computation
O(K ·|belief|), if (4)istrue
O(|ᏺ|·|belief|)
O(K
2
·|belief|), else
Bits to be communicated O(K ·|belief|) O(|belief|)
Wireless comm. power O(|belief|·
k
ζ
k
− ζ
center
α
) O(|belief|·ζ
next leader
− ζ
leader
α
)
computational load. We are currently exploring more realis-
tic vehicle dynamics models, which take into account higher-
order dynamics and other complex characteristics of vehicle
trajectories. However, for the purposes of this paper, we have
opted for the lower-computational complexity of this simple
model.
This algorithm is ful ly distributed. There is no single cen-
tral node in the network. Note that the sensor nodes do
not have a global knowledge about the network such as its
topology. Each node is only aware of its immediate neigh-
bors and their specifications. The communication is exclu-
sively neighbor-to-neighbor. Only local computation is in-
volved in computing the measurement z
(t)
and updating the
belief state. As discussed in Section 1, such fully decentral-
ized characteristics are often desirable to ensure reliability,
survivability, and scalability of the sensor network.
2.2. Comparisons to centralized Bayesian estimation
It is interesting to see how this distributed sensor network
compares to a fully centralized one. Consider a centralized
sensor network consisting of K sensors. At any time instant
t, each sensor k (k = 1, 2, ,K) informs the central process-
ing unit of its measurement z
(t)
k
. The central processing unit
updates the belief state using the same sequential Bayesian fil-
tering technique as in (3), with the difference that instead of
using the single sensor measurement z
(t)
(which is a scalar),
it uses the measurement vector z
(t)
={z
(t)
1
,z
(t)
2
, ,z
(t)
K
}.If
the sensors measurements are mutually independent when
conditioned on the target locations, then
p
z
(t)
x
(t)
=
k=1, ,K
p
z
(t)
k
x
(t)
. (4)
Compared to the centralized tracking algorithm, which
utilizes all K measurements at every time step, our dis-
tributed algorithm incorporates only one out of |ᏺ| mea-
surements each step, where |ᏺ| is the size of the leader node’s
local neighbor hood, and in general, |ᏺ|K. Hence the dis-
tributed algorithm suffers from decreased tracking accuracy
but scales much better in computation and communication
as the network grows. Tabl e 1 summarizes the cost for each
step of tracking in the centralized and distributed schemes.
Unlike the centralized algorithm whose complexities go up
linearly or superlinearly with K, the distributed algorithm
has complexities independent of K.
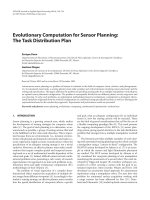
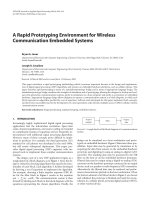
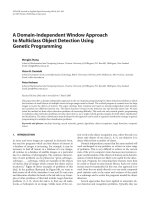
Figure 1: Nonparametric representation of belief state.
2.3. Nonparametric belief representation
As we will see in Section 3, the observational model is non-
linear; the likelihood p(z
(t)
|x
(t)
) is non-Gaussian, as is the
posterior belief p(x
(t)
|z
(t)
). In view of these characteristics,
we use a nonparametric representation for probability distri-
butions (see Figure 1). The distributions are represented as
discrete grids in the two-dimensional plane. The grey level
depicts the probability distribution function (pdf) evaluated
at the grid location. The lighter the grid square, the higher
the pdf value.
The nonparametric representation of likelihood and pos-
terior belief admits an efficient computation. The MMSE es-
timate (2) is simply the average of the grid locations in the
belief cloud weighted by the belief value. The predicted be-
lief p(x
(t+1)
|z
(t)
) (the integral in (3)) is a weighted sum of the
vehicle dynamics pdf conditioned on each grid point in the
original belief cloud.
The resolution of the grid representation is constrained
by the computational capacity, storage space, and commu-
nication bandwidth of the leader node. For our choices of
sensors, as will be detailed Section 3 , the likelihood functions
are relatively smooth. This smoothness allows low-resolution
representation without much loss in performance. Further-
more, in our experiment, we store only the grid points which
have likelihood value above a fixed threshold. The grid points
below this likelihood are neglected.
3. SENSOR MODELS
We use two types of sensors for tracking: acoustic ampli-
tude sensors, and direction-of-arrival (DOA) sensors. The
382 EURASIP Journal on Applied Signal Processing
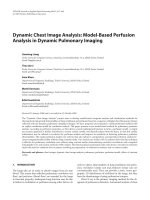
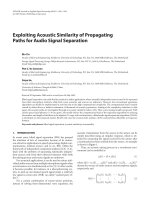
Figure 2: Likelihood function p(z|x) for acoustic amplitude sen-
sors. The circle is the sensor location ζ and the cross is the true tar-
get location.
acoustic amplitude sensors calculate sound amplitude mea-
sured at each microphone and estimate the distance of the
vehicle based on the physics of sound attenuation. The DOA
sensors are small microphone arrays. Using beamforming
techniques, they determine the direction where the sound
comes from, that is, the bearing of the vehicle.
The nonparametric Bayesian approach we are using
poses few restrictions on sensor type and allows the network
to easily fuse data from multiple sensor t ypes. Relatively low-
cost sensors such as microphones are attractive because of af-
fordability as well as simplicity in computation, compared to
imagers. However, there are no barri ers to adding other sen-
sor types, including imaging, motion, or magnetic sensors.
3.1. Acoustic amplitude sensors
Assuming that the sound source is a point source and sound
propagation is lossless and isotropic, a root mean-squared
(rms) amplitude measurement z is related to the sound
source position x as
z =
a
x − ζ
+ w, (5)
where a is the rms amplitude of the sound source, ζ is the
location of the sensor, and w is rms measurement noise [6].
For simplicity, we model w as Gaussian with zero mean and
variance σ
2
. The sound source amplitude a is also modeled as
a random quantity. Assuming the a is uniformly distributed
in the interval [a
lo
,a
hi
], the likelihood has a closed-form ex-
pression
p
z|x
=
a
hi
a
lo
p
z|x, a
p(a)da
=
1
∆
a
a
hi
a
lo
1
√
2πσ
2
e
−(z−a/r)
2
/2σ
2
da
=
r
∆
a
Φ
a
hi
− rz
rσ
− Φ
a
lo
− rz
rσ
,
(6)
×10
−3
2
1.8
1.6
1.4
1.2
1
0.8
0.6
0.4
0.2
0
0 5 10 15 20 25 30 35 40
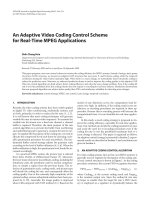
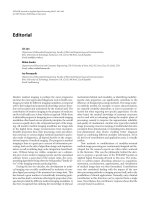
Figure 3: The cross section of the likelihood (plotted in Figure 2)
along the horizontal line past the sensor location.
where ∆
a
= a
hi
−a
lo
, r =x − ζ is the distance between the
sound source and the sensor, and Φ ( ·) is the standard error
function. The details of the derivation is referred in [3].
Figure 2 shows an example of the likelihood function
p(z|x), a cr a ter-shaped function centered at the sensor lo-
cation. The thickness of the crater (outer radius minus inner
radius) is determined by a
lo
, a
hi
,andσ
2
. Fixing the first two,
the thickness increases with σ
2
, as the target location is more
uncertain. Fixing σ
2
, the thickness increases as a
lo
decreases
or as a
hi
increases. In cartesian space, it is clear that this like-
lihood is non-Gaussian, and difficult to approximate as the
sum of gaussians. The cross section of the likelihood func-
tion along the radial direction is plotted in Figure 3, and it is
quite smooth and amenable to approximation by sampling.
The uniform, stationary assumption of source amplitude
is computationally lightweight. To accommodate quiet vehi-
cles and vehicles in idle state, a
lo
is set to zero in our experi-
ments and a
hi
is set via calibration. In practice, the uniform
assumption is simplistic, and as part of our ongoing work,
we are developing new models of source amplitude to bet-
ter model vehicle engine sound char acteristics, exploiting the
correlation of sound energy over time.
3.2. DOA sensors
Amplitude sensing provides a range estimate. This estimate is
often not very compact and is limited in accuracy due to the
crude unifor m sound source amplitude model. These limi-
tations makes the addition of a target bearing estimator ver y
attractive.
For estimating the bearing of the sound source, we use
the maximum likelihood (ML) DOA estimation algorithm
proposed by Chen et al. [7]. Here we only outline the for-
mulation of the estimation problem; interested readers may
refer to their paper for more details.
Assume that we have a microphone array composed of
M identical omnidirectional microphones, and the sound
source is sufficiently far away from the microphone array so
Collaborative In-Network Processing for Target Tracking 383
that the wave received at the array is a planar wave. In this
case, the data collected at the mth microphone at time n is
g
m
(n) = s
0
n − t
m
+ w
m
(n), (7)
where s
0
is the source signal, w
m
is the noise (assumed white
Gaussian), and t
m
is the time delay, which is a function of the
target direction θ. Now consider the equivalent problem in
the Fourier frequency domain (by DFT of length L, L M).
We have
G(l) = D(l)S
0
(l)+W(l), (8)
for l = 0, 1, ,L− 1, where
(i) G(l)=[G
1
(l),G
2
(l), ,G
M
(l)]
T
is the frequency com-
ponent of the received signal at frequency l,
(ii) S
0
(l) is the signal component,
(iii) W(l) = [W
1
(l),W
2
(l), ,W
M
(l)]
T
is the noise com-
ponent,
(iv) the steering matrix takes the form D(l) = [D
1
(l),
D
2
(l), ,D
M
(l)]
T
,andD
m
(l) = e
−j2πlt
m
/L
.
The ML estimator seeks an estimate
θ,
S
0
= arg min
θ,S
0
L−1
l=0
G(l) − D(l)S
0
(l)
2
. (9)
Given the arriving angle θ, the signal spectrum estimate is
S
0
(l) = D
†
(l)G(l), (10)
where D
†
(l) is the pseudoinverse of the steering matrix D(l).
Plugging-in (10), (9) boils down to a one-dimensional op-
timization over θ ∈ [0, 2π], which can be solved using sim-
ple searching techniques. This DOA algorithm works well for
wideband acoustic signals, and does not require the micro-
phone array to be linear or uniformly spaced.
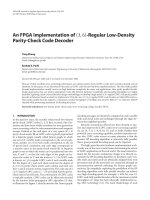
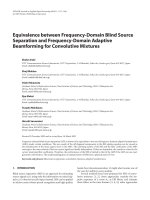
In our experiments, we use a microphone array with four
microphones, as shown in Figure 4. The centroid’s location
is defined as ζ
0
= (0, 0); the arriving angle θ is defined as the
angle with respect to the vertical grid axis. This convention is
used throughout the paper.
Due to the presence of noise, the DOA estimate of an-
gles is often imperfect. The measurement z (i.e.,
θ) is close
to the true underline angle θ with some perturbation. To
characterize the likelihood function p(z|x), we tested the
DOA algorithm using recorded vehicle sounds from an AAV,
running the DOA algorithm on an actual sensor node (see
Section 5.2 for information on the node and vehicle). The
test took place under reasonable noise conditions including
air handling units at a nearby building and some street and
aircraft tr affic. We performed tests at r = 50, 150, 200, and
500 feet, and θ = 0,π/8,π/4, and 3π/8.
Since the microphone array is symmetric in four
quadrants, we only have to examine the first quadrant.
At each combination, we ran the DOA algorithm 100
times and computed the histogram of the DOA estimates
{z
exp1
,z
exp2
, ,z
exp100
}. Figure 5 shows the histograms for
Mag.
N
Tar get
θ
Array
centroid
23
10
1
1
Figure 4: DOA sensor arrangement and angle convention.
r = 50 feet. The histograms suggest that the distribution of z
is unimodal and approximately centered at θ. Hence for the
angle measurement z, a Gaussian model with zero mean is
appropriate. The likelihood takes the form
p
z|x
=
1
√
2πσ
2
e
−(z−θ)
2
/2σ
2
, (11)
where θ is calculated from the geometry of the sound source
position x and the sensor position ζ. This model ignores the
periodicit y of angles around 2π, and is accurate when the
variance σ
2
is small.
In our experiments, we have observed that the DOA esti-
mates are reliable in some middle distance range and is less
reliable when the sound source is too near or too far away
from the microphone array. This is to be expected. In the
near field, the planar wave assumption is violated. In the far
field, the SNR is low, and the DOA algorithm may be strongly
influenced by noise and fail to obtain the correct angle. To ac-
count for these factors, we developed a simplified likelihood
model which is qualitatively reasonable and empirically be-
haves well. The model varies the standard deviation σ accord-
ing to distance, as illustrated in Figure 6. We first specify the
range [r
near
,r
far
] in which the DOA algorithm performs re-
liably. In this range, the DOA estimate has a fixed standard
deviation. For the nearfield range [0,r
near
), as distance de-
creases, the standard deviation increases linearly to account
for the increasing uncertainty of DOA readings. Likewise, in
the far field range r>r
far
, the standard deviation increases
with r.
Under this model, the likelihood function p(z|x) is plot-
ted in Figure 7. It has a cone shape in the working range
and fans out in the near and far range. If the target is lo-
cated in either end of the range, the D OA estimates are unre-
liable, thus the angle measurement does not provide much
evidence about the target’s location. Note that the likeli-
hood in the two-dimensional Cartesian plane is not compact.
The sequential Bayesian filtering approach (as described in
384 EURASIP Journal on Applied Signal Processing
rr = 50,aa = 0
25
20
15
10
5
0
00.51 1.522.53
(a)
rr = 50,aa = 23
25
20
15
10
5
0
26 26.527 27.52828.529 29.53030.531
(b)
rr = 50,aa = 45
16
14
12
10
8
6
4
2
0
48.549 49.550 50.551 51.552
(c)
rr = 50,aa = 67
25
20
15
10
5
0
69.57070.571 71.57272.57373.57474.5
(d)
Figure 5: Histograms of the DOA estimate z at r = 50 feet and θ = 0,π/8,π/4, and 3π/8in(a),(b),(c),and(d),respectively.
Section 2.1) has the flexibility to accommodate such non-
compactness, while a standard Kalman filtering approach
may have difficulty here.
4. INFORMATION-DRIVEN SENSOR SELECTION
Sensor selection is essential for the correct operation of the
IDSQ tracking algorithm. The selection criterion is based
on information content to maximize the predicted informa-
tion that a sensor’s measurement will br ing. This selection
is performed based on currently available information alone:
the current leader’s belief state and its knowledge about the
neighboring sensor locations and their sensing capabilities.
No querying of neighboring sensors is necessary.
To measure the information content, we consider mutual
information, a measure commonly used for characterizing
the performance of data compression, classification, and es-
timation algorithms and with a root in information theory.
4.1. Mutual information
Let U
∈ ᐁ and V ∈ ᐂ be two random variables (or vectors)
having a joint pdf p(u, v).
1
The mutual information between
U and V is defined as
I(U; V) E
p(u,v)
log
p(u, v)
p(u)p(v)
(12)
=
ᐁ
ᐂ
p(u, v)log
p(u, v)
p(u)p(v)
dudv (13)
= D
p(u, v)
p(u)p(v)
, (14)
where D(··) is the relative entropy between two distribu-
tions, also known as the Kullback-Leibler divergence [8].
1
In this section, we use the standard notation, with upper case symbols
denoting random variables and lower case symbols denoting a particular
realization.
Collaborative In-Network Processing for Target Tracking 385
180
160
140
120
100
80
60
40
20
0
0 50 100 150 200 250 300
Figure 6: Standard deviation σ in bearing estimation versus r ange.
Here r
near
= 20 meters, r
far
= 100 meters, and σ = 10
◦
in [r
near
,r
far
].
100
90
80
70
60
50
40
30
20
10
0
0 102030405060708090100
Figure 7: Likelihood function p(z|x). The circle is the sensor loca-
tion and the cross is the target location. The standard deviation of
the Gaussian distribution is as in Figure 6.
Similarly, the mutual information conditioned on a random
variable W = w is defined as
I(U; V|W = w) E
p(u,v|w)
log
p(u, v|w)
p(u|w)p(v|w)
. (15)
We use logarithm of base 2, hence I(U; V)ismeasuredin
bits. The mutual information is symmetric in U and V,
nonnegative, and equal to zero if and only if U and V are
independent.
The mutual information I(U; V) indicates how much in-
formation V conveys about U. From a data compression per-
spective, it measures the savings in bits of encoding U if V
is already known. In classification and estimation problems,
mutual information can be used to establish performance
bounds. The higher I(U; V) is, the easier it is to estimate (or
classify) U given V, or vice versa [9, 10].
4.2. Sensor selection criterion
In our target tracking problem, we formulate the sensor se-
lection criterion as follows. The leader, with a belief state
p(x
(t)
|z
(t)
), must decide which sensor in its neighbor hood to
hand the belief to. The IDSQ suggests selecting the sensor
k
IDSQ
= arg max
k∈ᏺ
I
X
(t+1)
; Z
(t+1)
k
Z
(t)
= z
(t)
, (16)
where ᏺ is the collection of sensors which the current leader
can talk to, namely, the leader’s neighborhood. Essentially,
this criterion seeks the sensor whose measurement z
(t+1)
k
,
combined with the current measurement history z
(t)
,would
provide the greatest amount of information about the tar-
get location x
(t+1)
.Intuitively,k
IDSQ
is the most “informative”
sensor among the neighborhood ᏺ.
From the definition of mutual information (12), the in-
formation content of sensor k is
I
X
(t+1)
; Z
(t+1)
k
Z
(t)
= z
(t)
= E
p(x
(t+1)
,z
(t+1)
k
|z
(t)
)
log
p
x
(t+1)
,z
(t+1)
k
z
(t)
p
x
(t+1)
z
(t)
p
z
(t+1)
k
z
(t)
.
(17)
The computation of mutual information is illustrated in
Table 2 .
We can also take a different view of mutual information,
interpreting it as a measure of the difference between two
densities. From (17), one can easily show that
I
X
(t+1)
; Z
(t+1)
k
Z
(t)
= E
p(z
(t+1)
k
|z
(t)
)
E
p(x
(t+1)
|z
(t+1)
k
)
log
p
x
(t+1)
z
(t+1)
k
p
x
(t)
z
(t)
= E
p(z
(t+1)
k
|z
(t)
)
D
p
x
(t+1)
z
(t+1)
k
p(x
(t+1)
z
(t)
.
(18)
The Kullback-Leibler divergence term measures how differ-
ent the updated belief, after incorporating the new measure-
ment z
(t+1)
k
, would be from the current belief. Therefore, the
IDSQ criterion favors the sensor which would on average give
the greatest change to the current belief.
4.3. Reduction in dimensionality
Using the discrete representation of the belief, the complex-
ity of computing mutual information grows exponentially in
the dimension of the joint pdf. The random variable X
(t+1)
is a two-dimensional vector for the target tracking problem
over a two-dimensional plane. Thus, we need to compute
mutual information from the three-dimensional joint den-
sity p(x
(t+1)
,z
(t+1)
k
|z
(t)
). This may be computationally inten-
sive, given the limited ability of the sensor nodes.
386 EURASIP Journal on Applied Signal Processing
Table 2: Computation of mutual information I(X
(t+1)
; Z
(t+1)
k
|Z
(t)
).
Initialization: p(x
(t)
|z
(t)
)isknown.
Step 1. Compute p(x
(t+1)
|z
(t)
)bydiffusing p(x
(t)
|z
(t)
) with vehicle dynamics (see Section 2.1).
Step 2. Set ᐄ as the nontrivial grids in p(x
(t+1)
|z
(t)
); set ᐆ ⊂ R as the grid points for z
(t+1)
k
.
Step 3. For z
(t+1)
k
∈ ᐆ and x
(t+1)
∈ ᐄ,evaluatep(x
(t+1)
,z
(t+1)
k
|z
(t)
) = p(z
(t+1)
k
|x
(t+1)
) · p(x
(t+1)
|z
(t)
).
Step 4. For z
(t+1)
k
∈ ᐆ,computep(z
(t+1)
k
|z
(t)
) =
ᐄ
p(x
(t+1)
,z
(t+1)
k
|z
(t)
).
Step 5. For x
(t+1)
∈ ᐄ and z
(t+1)
k
∈ ᐆ, D
xz
= log[p(x
(t+1)
,z
(t+1)
k
|z
(t)
)/p(x
(t+1)
|z
(t)
)p(z
(t+1)
k
|z
(t)
)]
I
k
=
ᐄ,ᐆ
D
xz
· p(x
(t+1)
,z
(t+1)
k
|z
(t)
)
Return I
k
.
For acoustic amplitude sensors, we note that observa-
tion model (5) indicates that at any given time instant, the
observation Z
k
is related to the position X only through
R
k
=X − ζ
k
, the distance from the target to the sensor
positioned at ζ
k
. Equivalently, we have p(z
k
|r
k
,x) = p(z
k
|r
k
).
In this case, R
k
is known as the sufficient statistics of X.From
the definition of mutual information, it is easy to show that
I
X; Z
k
= I
R
k
; Z
k
. (19)
This implies that instead of computing the mutual infor-
mation from the three-dimensional density p(x, z
k
), we can
compute it from the two-dimensional density p(r
k
,z
k
).
Likewise, for DOA sensors, from the observational model
(11), we see that Z
k
is related to X only through the angle
θ(X, ζ
k
). Hence
I
X; Z
k
= I
θ, Z
k
. (20)
Again, the computation of mutual information can be re-
duced to a two-dimensional computation.
5. EXPERIMENTAL RESULTS
To validate and characterize the performance of the tracking
algorithm, we carried out both simulations as well as experi-
ments using real data collected from the field.
5.1. Simulation
In the simulation, the vehicle produces stationary sound with
a constant rms amplitude A
= 40 and is traveling at a con-
stant speed v = 7 m/s along a straight line (south to north) in
the middle of a field. The field is 150×250 m
2
and covered by
K randomly placed sensors (K = 24, 28, ,60). The sensor
positions are simulated as follows:
(i) first, place the sensors in a uniform rectangular grid
with K/4 rows and four columns, evenly covering the
field;
(ii) then, add Gaussian noise with distribution N(0, 25) to
the horizontal and vertical coordinates.
A realization of this sensor position simulation is pictured
in Figure 8. Acoustic sensor measurements are simulated
as A/
x − ζ
k
+ N(0, 0.05
2
).DOAsensormeasurementsare
Gaussian random variables centered at the line through the
sensor and the target with σ = 3
◦
.
Without precise knowledge about the target vehicle, the
tracking algorithm allows maximum speed of 15 m/s. The
acoustic amplitude sensors assume that a
lo
= 0, a
hi
= 80, and
σ
k
= 0.1 (twice the actual noise contamination to accom-
modate outliers). The DOA sensors assumes that r
near
= 20
meters and r
far
= 100 meters. The standard deviation of the
DOA estimates is as plotted in Figure 6. The tracker updates
the belief every 0.5 second.
The tracking algorithm begins with an initial belief which
is uniform over the entire field. The acoustic amplitude sen-
sor with the highest amplitude reading at time t = 0 is ini-
tialized as the leader. The connectivity between sensors is de-
termined as follows: each sensor c an talk to sensors within a
40-meter range; or if there are less than two sensors in range,
it can talk to the two nearest sensors. The leader selects the
next leader from among these sensors based on their infor-
mation content according to the IDSQ rule.
To further enforce sensor diversity, we implement a
“triplet” rule: the previous leader is not included in the
neighborhood of the current leader. That is, if A hands off
to B in the previous step, B is prohibited from selecting A as
the next leader. This rule prevents the leadership from con-
stantly oscillating between two sensors. This is important in
assuring that biases, due to modeling error of one particular
sensor, will not be overweighted in the overall result. Ideally,
we would like to task the sensors more or less evenly to ex-
ploit the spatial and sensing modality diversity of the sensors,
expecting that the modeling errors across different sensors
will probably balance each other.
Figure 8 shows three snapshots of a simulation run with
40 sensors, 30% of which are DOA. The belief is shown us-
ing the grid-based nonparametric representation described
in Section 2.3. The grid size is 5 meters in each direction
(which is approximately the size of a tank). The belief follows
the target fairly closely. In general, the belief cloud is more
compact in sensor-dense regions (e.g., in Figure 8b) than in
Collaborative In-Network Processing for Target Tracking 387
(a) (b) (c)
Figure 8: Snapshots of a simulation run with 40 sensors, 30% DOA. The target is marked with a red “+.” The yellow diamonds are acoustic
amplitude sensors; the cyan diamonds are DOA sensors. The active leader is the sensor circled with a magenta square. Its neighbors (after
applying the triplet rule) are circled with green squares.
sensor-sparse regions (e.g., in Figures 8a and 8c). This is as
expected since the SNR is higher in sensor-dense regions, and
the leader has more neig h bors to choose from. The collabo-
ration between sensors are more effective.
Table 3 summarizes the statistics from simulation results
for different values of K.ForeachK value, twenty runs are
simulated. We use x to denote the target’s tr ue location, x to
denote the blocks in the belief state, and x
MMSE
to denote the
MMSE estimate of target location. From (2), we know that
x
MMSE
is simply the centroid of the belief state, computed as
the weighted average of location among all the blocks in the
belief, weighted by the posterior p(x
(t)
|z
(t)
). To analyze track-
ing performance, we use the distance x
MMSE
−x to measure
how far away the MMSE estimate is to the true target posi-
tion, and use the variance x−x
MMSE
2
to measure the spread
(thus the uncertainty) of the belief cloud. Other quantities of
interest include the belief cloud size (directly related to com-
munication throughput) and the neig hborhood size. From
Table 3 , we can see that the tracking performance (the mean
error, variance, and belief size) improves as more sensors are
deployed. Figure 9 plots the average error x
MMSE
−x.Out-
liers (the tracker losing the target) occur occasionally, espe-
cially for small K. The improvement in average tracking per-
formance (the blue curve) with increasing K is quite promi-
nent.
We have also exper imented with varying percentage of
DOA sensors and summarized the result in Table 4 . The im-
provementfrom0to10%DOAissignificant,thusitisdesir-
able to use a few DOA sensors in the sensor network though
they are computationally more expensive than acoustic am-
plitude sensors. The all-DOA network gives better results
than the all-amplitude sensor network. This may be due to
the fact that the acoustic amplitude sensors use the very
55
50
45
40
35
30
25
20
15
10
20 25 30 35 40 45 50 55 60 65
Figure 9: Average error versus the number of sensors in the field.
The points marked with a circle are the error average over the track-
ing steps. The points marked with “
∗” and linked using a blue line
is the average over 20 runs.
crude uniform distribution for modeling sound source am-
plitude.
5.2. Experiments on field data
5.2.1 Experimental setup
Data for our experiments was collected during a field ex-
periment at the Marine Corps Air-Ground Combat Center
(MCAGCC) in Twentynine Palms, California. The test vehi-
cle was an AAVP7A1 tracked, armored assault amphibious
vehicle. This vehicle, shown in Figure 10, is a 4.1 meter-long,
tracked, diesel-powered vehicle, weighing 21 tons (unloaded)
and capable of speeds up to 72 km/h.
388 EURASIP Journal on Applied Signal Processing
Table 3: Tracking performance averaged over all tracking steps and twenty runs.
K Avg. x
MMSE
− x Avg. x − x
MMSE
2
Avg. belief size Avg . neigh. size
24 24.13 457.81 188.6 2.0
28 23.25 452.97 182.0 2.2
32 19.29 400.68 155.2 2.4
36 16.68 340.41 141.7 2.9
40 16.00 361.88 145.0 3.0
44 14.62 352.32 129.5 3.5
48 14.29 322.09 134.6 4.0
52 13.82 334.57 123.3 4.6
56 12.85 332.52 120.5 5.1
60 12.81 304.56 116.4 5.5
64 12.42 284.99 109.1 6.0
Table 4: Tracking performance versus percentage of DOA sensors.
Percentage of DOA Avg. x
MMSE
− x Avg. x
MMSE
− x
2
Avg. belief size
0 18.48 510.96 208.9
10% 16.84 416.17 168.2
20% 16.45 379.03 154.0
30% 15.48 345.68 138.3
40% 14.01 331.55 122.2
50% 14.05 373.88 122.6
60% 12.87 375.45 112.2
70% 11.89 327.94 104.4
80% 11.67 349.60 102.1
90% 11.31 366.50 99.7
100% 10.75 351.02 95.4
Figure 10: AAVP7A1 tracked, armored assault vehicle.
The sensor network consisted of a total of 70 WINS 2.0
nodes from Sensoria Corp. A picture of a node is shown in
Figure 11 along with a DOA array. The node specifications
are provided in Tab l e 5. Among the 70 nodes, 20–25 nodes
were available for our use. They are randomly positioned at
the intersection of two dirt roads. The sensor layout and the
Figure 11: WINS 2.0 node with DOA-sensing microphone array.
roads are shown in Figure 12. Vehicle maneuvers were con-
fined to the roads shown although, by choice, the algorithms
of this paper do not assume this knowledge.
DOA sensing arrays were identical square arrays with 1
feet (0.305 m) on the side configured as shown in Figure 11
and on legs 8” off the ground. The zero-degree bearing
Collaborative In-Network Processing for Target Tracking 389
Table 5: Specification of Sensoria nodes.
Manufacturer Sensoria Corp.
Processor
Hitachi SH4 7751
Performance 300 MIPS core, 1.1 GFLOPS floating point
CPU Power Consumption 400 mW
Memor y 16 MB RAM, 16 MB Flash
Operating system Redhat Linux 7
Data acquisition
4 channels, 16 bits @ 20 kHz
(this experiment sampled at 5 kHz throughout)
Communications
Power: 10 or 100 mW
Range: 25–100 m
350
300
250
200
150
100
100 150 200 250
Figure 12: Road intersection with node layout at MCAGCC. The
thick lines are the roads. The amplitude sensors are marked with a
small circle, and the two DOA sensors (at (150, 150) and (140, 164))
are marked with small squares. The thin lines indicate the connec-
tivity between sensors.
is aligned to magnetic north as shown in Figure 4.Micro-
phones were electret, flat to frequencies above 16 kHz, om-
nidirectional to less than 2.5 dB, and were field-calibrated to
±2.5dB.
5.2.2 Data acquisition and processing
Filtered acoustic amplitude and estimated DOA were com-
puted and stored on all nodes at time intervals of 0.5 second
using the node signal processing routines described above.
Additional data was collected for two DOA nodes using a
portable data acquisition PC and sampled at an identical rate
and resolution to the node’s data acquisition. In the experi-
ments shown here, only these two “virtual” nodes are used
for DOA measurements.
The IDSQ tracker, implemented in Matlab, then post-
processed this data to simulate the node-to-node handoff
and data source selection. Due to node dropout, the original
network topology, as laid out in the field, has to be slightly
augmented to prevent network segmentation; the resulting
topology is shown in Figure 12.
5.2.3 Tracking results
Figure 13 shows a few snapshots of an AAV run on the
north-east road. The vehicle is t raveling at roughly a con-
stant speed of 15 mph (6.7 m/s). The tracker is designed for
v
max
= 40 mph (17.9 m/s) and updates its belief every 0.5 sec-
ond. For acoustic amplitude sensors, the parameters are set
as a
lo
= 0, a
hi
= 80, and σ
k
= 0.05 based on calibration data.
For DOA sensors, the variance is set as in Figure 6.Attime
t = 0, the acoustic amplitude sensor with the highest reading
is initialized as the leader. The initial belief is a big uniform
square, centered at the leader with 50 meters (10 grids) to
each side, as plotted in Figure 13a. The first few tracking steps
can be considered as a “discovery” phase, where the tracker
begins with very little knowledge and use sensor measure-
ments to improve the belief. T he green trail depicts the tra-
jectory of the tracker estimates; in the discovery phase, it is
gradually pulled over to the road (the red curve). Figures 13b,
13c,and13d show the progress of tracking. Although our
tracker does not know the road configuration, it produces
estimates which follows the road fairly closely.
In our experiment, we have observed that including two
DOA sensors in the sensor network improves tracking accu-
racy. This is consistent with our results in Section 5.1.We
suspect that including a few more DOA sensors may bring
further improvement. Besides, since DOA sensors essentially
uses beam crossing for localization, placing the DOA sensors
evenly across the sensor field to avoid colinearity may be ad-
vantageous.
390 EURASIP Journal on Applied Signal Processing
(a) (b) (c) (d)
Figure 13: Snapshots of an AAV run on the north-east road. Plotting convention is the same as in Figure 8. The red curves are the roads.
The green curve is the estimated t rack.
6. DISCUSSION AND FUTURE WORK
In our experiments, we have glossed over the issue of auto-
matically initializing a track when the vehicle enters the sen-
sor fi eld and instead hardwired a uniform initial probability
distribution around the entry point. In the future, we plan
to deploy a small number of “watchdog” sensors along the
boundary of the sensor field. While the most par t of the net-
work remains idle, the watchdog sensors look out for events
of interest. When a high-confidence detection occurs, sen-
sors in that neighborhood wake up, elect a leader, causing
the IDSQ tracker to initialize. When the target moves out-
side the sensor field, the network goes back to the sleeping
mode, with only the watchdogs turned on.
Bandwidth is at a premium in a sensor network. To fur-
ther reduce the bandwidth requirement during sensor collab-
oration, we can consider switching between nonparametric
and parametric belief representations depending on the na-
ture of the distribution. The parametric form is more com-
pact when it is feasible since only the parameters of a dis-
tribution need to be communicated from the current leader
to the next. Even in the nonparametric representation, we
may b e able to encode the distribution using image com-
pression techniques to significantly reduce the number of
bits that need to be transmitted. Another improvement to
the tracker could come from using more realistic dynamics
models for sound source amplitudes and vehicles during the
Bayesian filtering. We used a crude form of DOA likelihood
function. More accurate, experimentally validated character-
ization could also help improve the tracking.
Reliability is an important issue in the sensor network.
A single leader tracking protocol, while conceptually sim-
ple, might suffer from node failure or degradation. A multi-
thread IDSQ tracker could partially alleviate such problems
by providing some degree of redundancy. The challenge here
is to maintain consistencies among and fuse information
from multiple threads of the tracker. In addition to the prob-
lem of node dropout, the tracker must also accommodate
sensor measurement outliers, perhaps through a local voting
mechanism.
Extending the approach to tracking multiple targets faces
is a significant next step. When multiple targets are f ar
apart from each other, the network can partition into sub-
networks and initialize independent trackers in parallel. The
difficulty arises w hen some targets are in proximity with each
other. The source separation and data association are two
major technical hurdles that must be solved. The data associ-
ation module will need to exploit classification knowledge of
targets in order to better disambiguate between multiple tar-
gets. The information criterion in the IDSQ t racker, in this
case, must be extended to account for both state estimation
as well as classification.
7. CONCLUSION
This paper has presented a principled approach to sensor se-
lection and a class of signal processing algorithms for dis-
tributed sensor network based on a mutual information
measure, models of acoustic amplitude and bearing sens-
ing, and a computationally efficient implementation of the
IDSQ tracking algorithm. The tracker is distributed, energy-
efficient, and scalable. The approach has been demonstrated
in both simulation and on field data of a moving vehicle.
ACKNOWLEDGMENTS
This work was partially supported by the DARPA Sensor
Information Technology Program under Contract F30602-
00-C-0139. We acknowledge the significant contributions of
Patrick Cheung, Jaewon Shin, and Dan Larner. We are also
indebted to Professor Kung Yao and Joe Chen of UCLA for
their advice on using bearing estimation for collaborative sig-
nal processing.
Collaborative In-Network Processing for Target Tracking 391
REFERENCES
[1] R. Brooks, C. Griffin, and D. Friedlander, “Self-organized dis-
tributed sensor network entity tracking,” International Jour-
nal of High Performance Computing Applications, vol. 16, no.
3, pp. 207–220, 2002.
[2] D. Estrin, R. Govindan, J. Heidemann, and S. Kumar, “Next
century challenges: scalable coordination in sensor networks,”
in Proc. 5th Annual International Conference on Mobile Com-
puting and Networks, pp. 263–270, Seattle, Wash, USA, August
1999.
[3] M. Chu, H. Haussecker, and F. Zhao, “Scalable information-
driven sensor querying and routing for ad hoc heterogeneous
sensor networks,” International Journal of High Performance
Computing Applications, vol. 16, no. 3, pp. 293–314, 2002.
[4] H.V.Poor,An Introduction to Signal Detection and Estimation,
Springer-Verlag, New York, NY, USA, 2nd edition, 1994.
[5] S. Haykin, Adaptive Filter Theory, Prentice Hall, Upper Saddle
River, NJ, USA, 3rd edition, 1996.
[6] L. E. Kinsler, A. R. Frey, A. B. Coppens, and J. V. Sanders, Fun-
damentals of Acoustics, John Wiley and Sons, New York, NY,
USA, 1999.
[7] J. C. Chen, R. E. Hudson, and K. Yao, “Joint maximum-
likelihood source localization and unknown sensor location
estimation for near-field wideband signals,” in Advanced Sig-
nal Processing Algorithms, Architectures, and Implementations
XI, vol. 4474 of SPIE Proceedings,SanDiego,Calif,USA,July
2001.
[8] T.M.CoverandJ.A.Thomas,Elements of Information Theory,
John Wiley and Sons, New York, NY, USA, 1991.
[9] J. Ziv and M. Zakai, “On functionals satisfying a data-
processing theorem,” IEEE Transactions on Information The-
ory, vol. 19, pp. 275–283, May 1973.
[10] A. O. Hero, “On the problem of granulometry for a degraded
Boolean image model,” in Proc. IEEE International Conference
on Image Processing, vol. II, pp. 16–20, Kobe, Japan, October
1999.
Juan Liu received her B.E. degree in elec-
tronic engineering from Tsinghua Uni-
versity, China, in 1995, and the M.S.
and Ph.D. degrees in electrical engineering
from the University of Illinois at Urbana-
Champaign, USA, in 1998 and 2001, respec-
tively. In September 2001, she joined Palo
Alto Research Center as a Research Scien-
tist, working in the Embedded Collabora-
tive Computing Area. Her research interests
include signal processing, statistical modeling, detection and esti-
mation, network routing, and their applications to distributed sen-
sor network problems.
James Reich is a Researcher in the Embed-
ded Collaborative Computing Area of the
Palo Alto Research Center (PARC). He re-
ceived an Undergraduate degree in aero-
nautical and astronautical engineering from
the MIT and an M.S. degree from Carnegie
Mellon in electrical and computer engineer-
ing. His technical focus is in sensing and
control using ad hoc networks of intelligent
devices. His previous work ranges from re-
furbishing Von Braun-era rockets to control system design and in-
tegration of PARC’s first active surface, the ISS airjet paper mover.
Feng Zhao is a Principal Scientist at Palo
Alto Research Center (PARC), where he di-
rects the Embedded Collaborative Comput-
ing Area in the Systems and Practices Lab-
orator y. He is also a Consulting Associate
Professor of computer science at Stanford.
His research interest includes distributed
sensor data analysis, diagnostics, qualitative
reasoning, and control of dynamical sys-
tems. Dr. Zhao received his Ph.D. degree in
electrical engineering and computer science from the MIT in 1992.
From 1992 to 1999, he was an Assistant and Associate Professor
of computer and information science at Ohio State University. He
received the ONR Young Investigator Award and the NSF Young
Investigator Award, and was an Alfred P. Sloan Research Fellow in
computer science. He has authored or coauthored over 50 peer re-
viewed technical papers in the areas of networked embedded sys-
tems, artificial intelligence, nonlinear control, and programming
tools, and is a coinventor of two US Patents and three pending
patent applications.