Recent Advances in Biomedical Engineering_3 doc
Bạn đang xem bản rút gọn của tài liệu. Xem và tải ngay bản đầy đủ của tài liệu tại đây (27.66 MB, 208 trang )
Discovery of Biorhythmic Stories behind Daily Vital Signs and Its Application 453
Discovery of Biorhythmic Stories behind Daily Vital Signs and Its
Application
Wenxi Chen
X
Discovery of Biorhythmic Stories behind Daily
Vital Signs and Its Application
Wenxi Chen
Biomedical Information Technology Laboratory, the University of Aizu
Japan
1. Introduction
The historical development of the study of biorhythms and the physiological background, as
well as functionality of biorhythmic phenomena in human beings, is introduced. The latest
achievements in modern chronomedicine, as well as their applications in daily health care
and medical practice, are reviewed. Our challenges in monitoring vital signs during sleep in
a daily life environment, and discovery of various inherent biorhythmic stories using data
mining mathematics are described. Several representative results are presented. Finally,
potential applications and future perspectives of biorhythm studies are extensively
discussed.
1.1 Historical review
Biorhythmic phenomena are innate, cyclical biological processes or functions existing in all
forms of life on earth, including human beings, which respond dynamically to various
endogenous and exogenous conditions that surround us (Wikipedia, 2009b). The worldwide
history of biorhythmic studies and their application in medical practice can be traced back
more than 2000 years, to around a few centuries B.C. Since written records exist in China
from more than 4000 years ago, numerous unearthed cultural relics and archaeological
materials show that the philosophy of yin and yang and the concept of rhythmic alternation
had dominated almost every aspect of Chinese society and people’s behaviour (Sacred Lotus
Arts, 2009).
Following the philosophy of yin and yang, the earliest existing medical book, “The Medical
Classic of Emperor Huang”, was formulated from a dialogue between Emperor Huang and
a medical professional, Uncle Qi, based on the theory of yin and yang, and compiled from a
series of medical achievements by many medical practitioners between 770–221 B.C. The
first publication of the book was confirmed to have occurred no later than 26 B.C. and no
earlier than 99 B.C. (Wang, 2005).
The book was a medical treatise consisting of a collection of 162 papers in two parts:
“Miraculous Meridian and Acupuncture” and “Medical Issues and Fundamental Principles”.
Each part has nine volumes, and each volume has nine papers, because the number nine is
the highest number in Chinese culture, and here, implies that the book covers all aspects of
medical matters (Zhang et al., 1995).
24
Recent Advances in Biomedical Engineering454
This book provided a systematic medical theory and insights into the prevention, diagnosis,
and treatment methodologies for diseases. At the same time, the interrelationship between
meteorological factors, geographical conditions, and the health of human beings was
established and rationalized as the theory of “The unity of heaven and humanity”, which
considered human beings an integral part of the universe.
This book laid the foundation for Traditional Chinese Medicine (TCM) in terms of
fundamental concepts and a theoretical framework, including primary theories, principles,
treatment techniques, and methodology. The advent of the book showed that TCM had
matured enough to be an independent discipline, such as mathematics, astronomy, or
geography, along with the many other scientific achievements in China.
Emperor Huang was considered to be the founder of Chinese civilization, and was the
respected supreme authoritative as a Son from Heaven. Later work on the validation and
further development of TCM remained to be carried out by many talented TCM successors.
One of the most eminent achievements was contributed by Zhang Zhongjing (ca. 150–219
A.D.) (Wikipedia, 2009g), who is known as the Chinese Aesculapius, and whose works
“Treatise on Cold Pathogenic Diseases” and “Essential Prescriptions of the Golden Coffer”
established medication principles and provided a summary of his medicinal experience
based on his clinical practice and his interpretation of “The Medical Classic of Emperor
Huang”.
There are three important historical periods in the development and maturation of TCM
following Zhang’s pioneer work. The first period is from the 3
rd
to the 10
th
century, where
the main works focused on inheritance, collation, and interpretation of the existing theories
described in “The Medical Classic of Emperor Huang”. Several milestones in the TCM
system were reached in the second period, from the 10
th
to the 14
th
century, which is the
most important period in the development of TCM. Many medical practitioners studied and
annotated the ancient classic, and accumulated their own clinical experiences and proposed
their own doctrines. The most eminent representatives were known as “the four great
masters”: Liu Wansu (1120–1200), Zhang Congzheng (1156–1228), Li Gao (1180–1251), and
Zhu Zhenheng (1281–1358). Their contributions greatly enriched and accelerated the
development of TCM. Further development and many practical medication approaches
were matured in the third period, from the 14
th
to the 20
th
century.
Wu Youke (1582–1652) published “On Plague Diseases” in 1642, summarizing his successful
fight against pestilence during periods of war, and proposed a theory on the cause of
disease and pertinent treatments, which was a significant breakthrough in aetiology akin to
modern microbiology.
Based on the “Herbal Classic of Shennong”, which described medication using mainly
herbal plants, as many as 365 components (252 plants, 67 animals, and 46 minerals), Li
Shizhen (1518–1593) spent 29 years writing the “Compendium of Materia Medica”, which
identified herbal medication into 1892 classifications in 60 categories, and formulated more
than 10,000 prescriptions.
The “Detailed Analysis of Epidemic Warm Diseases”, written by Wu Jutong (1758–1836),
was published in 1798. Many prescriptions described in this book are still considered to be
effective, and are used in present clinical practice.
The more than 2000 years of TCM history were created and shaped by numerous medical
practitioners through constant exploration and sustained innovation, starting with “The
Medical Classic of Emperor Huang”, which was built from a very simple philosophy, yin
and yang theory, just like modern computer science is built on a “one and zero” platform
(Wikipedia, 2009f).
As shown in Figure 1, yin and yang represents two sides of everything, and governs all
aspects of cosmic activities and phenomena in the universe. Constant alternation of the yin
and yang status is the origin of universal dynamics. The two sides can coexist, be
complementary, mutually inhibitable, mutual transformable, and inter-inclusive.
Fig. 1. A holistic overview of the TCM system. On-duty organic meridians in human beings,
and disease vulnerabilities in different time domains, and their interaction with various
exogenous aspects, such as meteorological, environmental, geographical, and temporal
factors from daily to seasonal and yearly, are illustrated (visualization based on Wang, 2005
and Zhang et al., 1995).
TCM considers that a subtle energy (“Qi” in TCM) and blood kinetics in the human body
can be expressed as yin and yang alternation corresponding to the waxing and waning
periodicities of the sun and the moon. Human moods, health, and behaviour are modulated
by the ebb and flow of yin and yang. Human behaviour must synchronize with the natural
time sequence to maintain the “Qi” in a good dynamic balanced condition between the yin
and yang status.
TCM insists that an unbalance between the yin and yang status is the essential cause of the
incidence and exacerbation of disease. The goal of treatment is, in principle, to restore and
maintain the balance between yin and yang among the visceral organs. A holistic balance
between yin and yang indicates the health status. The yin and yang status can be affected by
various endogenous and exogenous factors. The former includes emotional, psychological,
Discovery of Biorhythmic Stories behind Daily Vital Signs and Its Application 455
This book provided a systematic medical theory and insights into the prevention, diagnosis,
and treatment methodologies for diseases. At the same time, the interrelationship between
meteorological factors, geographical conditions, and the health of human beings was
established and rationalized as the theory of “The unity of heaven and humanity”, which
considered human beings an integral part of the universe.
This book laid the foundation for Traditional Chinese Medicine (TCM) in terms of
fundamental concepts and a theoretical framework, including primary theories, principles,
treatment techniques, and methodology. The advent of the book showed that TCM had
matured enough to be an independent discipline, such as mathematics, astronomy, or
geography, along with the many other scientific achievements in China.
Emperor Huang was considered to be the founder of Chinese civilization, and was the
respected supreme authoritative as a Son from Heaven. Later work on the validation and
further development of TCM remained to be carried out by many talented TCM successors.
One of the most eminent achievements was contributed by Zhang Zhongjing (ca. 150–219
A.D.) (Wikipedia, 2009g), who is known as the Chinese Aesculapius, and whose works
“Treatise on Cold Pathogenic Diseases” and “Essential Prescriptions of the Golden Coffer”
established medication principles and provided a summary of his medicinal experience
based on his clinical practice and his interpretation of “The Medical Classic of Emperor
Huang”.
There are three important historical periods in the development and maturation of TCM
following Zhang’s pioneer work. The first period is from the 3
rd
to the 10
th
century, where
the main works focused on inheritance, collation, and interpretation of the existing theories
described in “The Medical Classic of Emperor Huang”. Several milestones in the TCM
system were reached in the second period, from the 10
th
to the 14
th
century, which is the
most important period in the development of TCM. Many medical practitioners studied and
annotated the ancient classic, and accumulated their own clinical experiences and proposed
their own doctrines. The most eminent representatives were known as “the four great
masters”: Liu Wansu (1120–1200), Zhang Congzheng (1156–1228), Li Gao (1180–1251), and
Zhu Zhenheng (1281–1358). Their contributions greatly enriched and accelerated the
development of TCM. Further development and many practical medication approaches
were matured in the third period, from the 14
th
to the 20
th
century.
Wu Youke (1582–1652) published “On Plague Diseases” in 1642, summarizing his successful
fight against pestilence during periods of war, and proposed a theory on the cause of
disease and pertinent treatments, which was a significant breakthrough in aetiology akin to
modern microbiology.
Based on the “Herbal Classic of Shennong”, which described medication using mainly
herbal plants, as many as 365 components (252 plants, 67 animals, and 46 minerals), Li
Shizhen (1518–1593) spent 29 years writing the “Compendium of Materia Medica”, which
identified herbal medication into 1892 classifications in 60 categories, and formulated more
than 10,000 prescriptions.
The “Detailed Analysis of Epidemic Warm Diseases”, written by Wu Jutong (1758–1836),
was published in 1798. Many prescriptions described in this book are still considered to be
effective, and are used in present clinical practice.
The more than 2000 years of TCM history were created and shaped by numerous medical
practitioners through constant exploration and sustained innovation, starting with “The
Medical Classic of Emperor Huang”, which was built from a very simple philosophy, yin
and yang theory, just like modern computer science is built on a “one and zero” platform
(Wikipedia, 2009f).
As shown in Figure 1, yin and yang represents two sides of everything, and governs all
aspects of cosmic activities and phenomena in the universe. Constant alternation of the yin
and yang status is the origin of universal dynamics. The two sides can coexist, be
complementary, mutually inhibitable, mutual transformable, and inter-inclusive.
Fig. 1. A holistic overview of the TCM system. On-duty organic meridians in human beings,
and disease vulnerabilities in different time domains, and their interaction with various
exogenous aspects, such as meteorological, environmental, geographical, and temporal
factors from daily to seasonal and yearly, are illustrated (visualization based on Wang, 2005
and Zhang et al., 1995).
TCM considers that a subtle energy (“Qi” in TCM) and blood kinetics in the human body
can be expressed as yin and yang alternation corresponding to the waxing and waning
periodicities of the sun and the moon. Human moods, health, and behaviour are modulated
by the ebb and flow of yin and yang. Human behaviour must synchronize with the natural
time sequence to maintain the “Qi” in a good dynamic balanced condition between the yin
and yang status.
TCM insists that an unbalance between the yin and yang status is the essential cause of the
incidence and exacerbation of disease. The goal of treatment is, in principle, to restore and
maintain the balance between yin and yang among the visceral organs. A holistic balance
between yin and yang indicates the health status. The yin and yang status can be affected by
various endogenous and exogenous factors. The former includes emotional, psychological,
Recent Advances in Biomedical Engineering456
and behavioural aspects, and the latter includes meteorological, environmental,
geographical, and temporal factors. Once the yin and yang falls into unbalance, i.e., excess
or deficiency on either side, this induces disease. TCM persists from an integrative and
holistic standpoint in terms of methodology and philosophy to explain health and disease
issues as a result of interaction with many endogenous and exogenous aspects that
surround us.
The theories of “syncretism of body and mind” and “the harmony of human with nature” in
TCM consider that not only are mental and physical health interconnected, but also vital
body functions are modulated by the environmental and seasonal variations due to the
movement of the earth and sun and the waxing and waning of the moon over a year. For
example, mental disorders, such as excess mood swings in joy, anger, worry, fright, shock,
grief, and pensiveness, may affect the visceral organs directly. Depression disrupts the
normal functions of the spleen and stomach. Marked changes in weather conditions, such as
dryness, dampness, cold, heat, wind, and rain, can induce an unbalance in yin and yang and
lead to disease.
TCM considers that an inseparable relationship exists between humans and nature, from
birth, development, maturation, caducity, and death, just as seasonal alternations, waxing,
and waning occur in the universe. Life activities must be synchronized with natural rhythms
to reach harmonic status and maintain longevity. To obtain sufficient sunlight, to ward off
chilly north winds, and to enjoy all amenities, the recommended habitation is for a house to
sit the north and face the south, back onto mountains, and be close to water.
One of the most prominent features in TCM is the temporal concept in treating health and
disease. Spring, summer, autumn, and winter imply burgeoning, growth, harvest, and
reposition in nature, respectively. Following a seasonal alternation in work and life is the
key to maintaining good health for human beings. Sleep is emphasized as being important
as exercise, breathing, and meals in maintaining a normal life activity. A single night’s
sleeplessness may require 100 days to recover. The daily sleeping–waking cycle should
follow the regular celestial mechanics. People should go to sleep late and get up early
during the spring season, when all is recovering from the winter hibernation. Acupuncture
treatments stipulate strict needle selection in terms of their geometric shape, position, and
depth for different seasons using a series of precise instructions.
Because not only physiological and pathological functions, but also the severity of a disease
and the effectiveness of its diagnosis/treatment are time-dependent from a TCM standpoint,
a day is divided into four parts. From midnight to 6:00 a.m., yin begins to fade from its peak,
and yang gradually increases. From 6:00 a.m. to noon, yin finally fades away and yang
gradually reaches its peak. From noon to 6:00 p.m., yang begins to fade from its peak and
yin gradually increases. From 6:00 p.m. to midnight, yang finally fades away and yin
gradually reaches its peak. Most diseases become more severe after dusk when yin increases,
and mitigate in daytime when yang dominates.
A day is further divided into 12 time slots. Individual organ-related meridians alternate in
being on-duty in each time slot. As shown in Figure 1, many ailments and diseases have
their own time-dependent features, which should be taken into consideration in diagnosis
and treatment. Different diseases are related to different meridians, and the treatment
should be targeted to the on-duty meridian. Patients with liver disease are usually better in
the morning, exacerbate between 3:00–5:00 p.m., and become calmer at midnight. Patients
with heart disease are calm in the morning, feel comfortable at noon, and become
exacerbated at midnight. Patients with spleen disease show severe symptoms at sunrise, are
calm between 3:00–5:00 p.m., and feel better at sunset. Patients with lung disease show
severe symptoms at noon, feel better between 3:00–5:00 p.m., and are calm at midnight.
Patients with kidney disease feel better at midnight and are calm in the early evening, but
become aggravated during four time slots (1:00–3:00 a.m., 7:00–9:00 a.m., 1:00–3:00 p.m., and
7:00–9:00 p.m.)(Wikipedia, 2009d; Ni, 1995; Veith, 2002).
Identifying the root cause of the disease is a very important part of TCM practice. TCM
stresses that balance is the key to a healthy body. Any long-term imbalance, such as extreme
climate change, undue physical exercise, heavy workload, excessive rest, too frequent or
rare sexual activity, unbalanced diet, or sudden emotional changes can all cause disease
(Xuan, 2006).
A holistic view of the human body is not the sole understanding of the TCM system. In
approximately the same historical period on the other side of the earth, Hippocrates (ca.
460–ca. 370 B.C.), a Greek physician known as “the father of medicine”, laid the foundations
of Western medicine by freeing medical studies from the constraints of philosophical
speculation and religious superstition.
“The Hippocratic Corpus” is a collection of about 60 treatises believed to have been written
between 430 B.C. and 200 A.D. by different people under the name of Hippocrates
(Naumova, 2006). The corpus describes many points of view on diseases related to temporal
and environmental factors, such as:
As a general rule, the constitutions and the habits of people follow the nature of the land
where they live.
Changes in the seasons are especially liable to beget diseases, as are great changes from
heat to cold or cold to heat in any season. Other changes in the weather have similar
severe effects.
When the weather is seasonable and the crops ripen at regular times, diseases are
regular in their appearance.
Each disease occurs in any season of the year, but some of them occur more frequently
and are of greater severity at certain times.
Some diseases are produced by the manner of life that is followed, and others by the life-
giving air we breathe.
As a pioneer in studying biorhythms, an Italian physician, Santorio Santorio (1561–1636),
invented a large “weighing chair” to observe the weight fluctuations in his own body
during various metabolic processes, such as digestion, sleep, and daily eating over a 30-year
period (Wikipedia, 2009e). He reported the circadian variation both in body weight and in
the amount of insensible perspiration in his book “On Statistical Medicine”, published in
1614, which introduced a quantitative aspect into medical research, and founded the
modern study of metabolism.
In 1729, a French astronomer named Jean Jacques Ortous de Mairan (1678–1771) devised a
classical circadian experiment. He placed a heliotropic plant in the dark and observed that
the daily rhythmic opening and closing of the heliotrope’s leaves persisted in the absence of
sunlight (Wikipedia, 2009c). We now understand that the circadian clock controls given
processes, including leaf and petal movements, the opening and closing of stomatal pores,
the discharge of floral fragrances, and many metabolic activities in plants.
Christopher William Hufeland (1762–1836), a German physician, published “The Art of
Prolonging Life” in 1796. He stated that “The life of man, physically considered, is a peculiar
Discovery of Biorhythmic Stories behind Daily Vital Signs and Its Application 457
and behavioural aspects, and the latter includes meteorological, environmental,
geographical, and temporal factors. Once the yin and yang falls into unbalance, i.e., excess
or deficiency on either side, this induces disease. TCM persists from an integrative and
holistic standpoint in terms of methodology and philosophy to explain health and disease
issues as a result of interaction with many endogenous and exogenous aspects that
surround us.
The theories of “syncretism of body and mind” and “the harmony of human with nature” in
TCM consider that not only are mental and physical health interconnected, but also vital
body functions are modulated by the environmental and seasonal variations due to the
movement of the earth and sun and the waxing and waning of the moon over a year. For
example, mental disorders, such as excess mood swings in joy, anger, worry, fright, shock,
grief, and pensiveness, may affect the visceral organs directly. Depression disrupts the
normal functions of the spleen and stomach. Marked changes in weather conditions, such as
dryness, dampness, cold, heat, wind, and rain, can induce an unbalance in yin and yang and
lead to disease.
TCM considers that an inseparable relationship exists between humans and nature, from
birth, development, maturation, caducity, and death, just as seasonal alternations, waxing,
and waning occur in the universe. Life activities must be synchronized with natural rhythms
to reach harmonic status and maintain longevity. To obtain sufficient sunlight, to ward off
chilly north winds, and to enjoy all amenities, the recommended habitation is for a house to
sit the north and face the south, back onto mountains, and be close to water.
One of the most prominent features in TCM is the temporal concept in treating health and
disease. Spring, summer, autumn, and winter imply burgeoning, growth, harvest, and
reposition in nature, respectively. Following a seasonal alternation in work and life is the
key to maintaining good health for human beings. Sleep is emphasized as being important
as exercise, breathing, and meals in maintaining a normal life activity. A single night’s
sleeplessness may require 100 days to recover. The daily sleeping–waking cycle should
follow the regular celestial mechanics. People should go to sleep late and get up early
during the spring season, when all is recovering from the winter hibernation. Acupuncture
treatments stipulate strict needle selection in terms of their geometric shape, position, and
depth for different seasons using a series of precise instructions.
Because not only physiological and pathological functions, but also the severity of a disease
and the effectiveness of its diagnosis/treatment are time-dependent from a TCM standpoint,
a day is divided into four parts. From midnight to 6:00 a.m., yin begins to fade from its peak,
and yang gradually increases. From 6:00 a.m. to noon, yin finally fades away and yang
gradually reaches its peak. From noon to 6:00 p.m., yang begins to fade from its peak and
yin gradually increases. From 6:00 p.m. to midnight, yang finally fades away and yin
gradually reaches its peak. Most diseases become more severe after dusk when yin increases,
and mitigate in daytime when yang dominates.
A day is further divided into 12 time slots. Individual organ-related meridians alternate in
being on-duty in each time slot. As shown in Figure 1, many ailments and diseases have
their own time-dependent features, which should be taken into consideration in diagnosis
and treatment. Different diseases are related to different meridians, and the treatment
should be targeted to the on-duty meridian. Patients with liver disease are usually better in
the morning, exacerbate between 3:00–5:00 p.m., and become calmer at midnight. Patients
with heart disease are calm in the morning, feel comfortable at noon, and become
exacerbated at midnight. Patients with spleen disease show severe symptoms at sunrise, are
calm between 3:00–5:00 p.m., and feel better at sunset. Patients with lung disease show
severe symptoms at noon, feel better between 3:00–5:00 p.m., and are calm at midnight.
Patients with kidney disease feel better at midnight and are calm in the early evening, but
become aggravated during four time slots (1:00–3:00 a.m., 7:00–9:00 a.m., 1:00–3:00 p.m., and
7:00–9:00 p.m.)(Wikipedia, 2009d; Ni, 1995; Veith, 2002).
Identifying the root cause of the disease is a very important part of TCM practice. TCM
stresses that balance is the key to a healthy body. Any long-term imbalance, such as extreme
climate change, undue physical exercise, heavy workload, excessive rest, too frequent or
rare sexual activity, unbalanced diet, or sudden emotional changes can all cause disease
(Xuan, 2006).
A holistic view of the human body is not the sole understanding of the TCM system. In
approximately the same historical period on the other side of the earth, Hippocrates (ca.
460–ca. 370 B.C.), a Greek physician known as “the father of medicine”, laid the foundations
of Western medicine by freeing medical studies from the constraints of philosophical
speculation and religious superstition.
“The Hippocratic Corpus” is a collection of about 60 treatises believed to have been written
between 430 B.C. and 200 A.D. by different people under the name of Hippocrates
(Naumova, 2006). The corpus describes many points of view on diseases related to temporal
and environmental factors, such as:
As a general rule, the constitutions and the habits of people follow the nature of the land
where they live.
Changes in the seasons are especially liable to beget diseases, as are great changes from
heat to cold or cold to heat in any season. Other changes in the weather have similar
severe effects.
When the weather is seasonable and the crops ripen at regular times, diseases are
regular in their appearance.
Each disease occurs in any season of the year, but some of them occur more frequently
and are of greater severity at certain times.
Some diseases are produced by the manner of life that is followed, and others by the life-
giving air we breathe.
As a pioneer in studying biorhythms, an Italian physician, Santorio Santorio (1561–1636),
invented a large “weighing chair” to observe the weight fluctuations in his own body
during various metabolic processes, such as digestion, sleep, and daily eating over a 30-year
period (Wikipedia, 2009e). He reported the circadian variation both in body weight and in
the amount of insensible perspiration in his book “On Statistical Medicine”, published in
1614, which introduced a quantitative aspect into medical research, and founded the
modern study of metabolism.
In 1729, a French astronomer named Jean Jacques Ortous de Mairan (1678–1771) devised a
classical circadian experiment. He placed a heliotropic plant in the dark and observed that
the daily rhythmic opening and closing of the heliotrope’s leaves persisted in the absence of
sunlight (Wikipedia, 2009c). We now understand that the circadian clock controls given
processes, including leaf and petal movements, the opening and closing of stomatal pores,
the discharge of floral fragrances, and many metabolic activities in plants.
Christopher William Hufeland (1762–1836), a German physician, published “The Art of
Prolonging Life” in 1796. He stated that “The life of man, physically considered, is a peculiar
Recent Advances in Biomedical Engineering458
chemico-animal operation; a phenomenon effected by a concurrence of the united powers of
Nature with matter in a continual state of change.” He considered that the rhythmicity of
twenty-four hours is formed by the regular revolution of our earth, and can be seen in all
diseases, and all the other biorhythms are determined by it in reality (Hufeland, 1796).
In the early 19
th
century, identical conclusions from investigations into biorhythms from
different approaches and from independent researchers in different fields, such as
psychology and meteorology, were reached.
In his book “Die Perioden des Menschlichen Organismus (Periodicity in the Life of the
Human Organism)”, the Austrian psychologist Hermanna Swoboda stated that, “Life is
subject to consistent changes. This understanding does not refer to changes in our destiny or
to changes that take place in the course of life. Even if someone lived a life entirely free of
outside forces, of anything that could alter his mental and physical state, still his life would
not be identical from day to day. The best of physical health does not prevent us from
feeling ill sometimes, or less happy than usual”. By analysing dreams, ideas, and creative
impulses of his patients, Swoboda noticed very regular rhythms with predictable variations
in some artists’ performances and the mental status of pregnant women (Biochart Com,
2009).
Even the influence of meteorological factors, such as sunspot activity, was associated with
the acute chronic diseases of the heart, blood vessels, liver, kidney, and nervous system,
ranging from mild to severe, such as excitability, insomnia, tiredness, aches, muscle twitches,
polyuria, digestive troubles, jitteriness, shivering, spasms, neuralgia, neural crises, asthma,
dyspnea, fever, pain, vertigo, syncope, high blood pressure, tachycardia, arrhythmia, and
true angina pectoris (Vallot et al., 1922).
In 1924 and 1928, Alexander Chizhevsky (1897–1964) published “Epidemiological
Catastrophes and the Periodic Activity of the Sun” and “Influence of the Cosmos on Human
Psychoses”, respectively, studying biorhythms in living organisms in their connections with
solar and lunar cycles, stating that, “Life is a phenomenon. Its production is due to the
influence of the dynamics of the cosmos on a passive subject. It lives due to dynamics, each
oscillation of organic pulsation is coordinated with the cosmic heart in a grandiose whole of
nebulas, stars, the sun and the planet”, which is now formulated as the independent
discipline of “heliobiology” (Wikipedia, 2009a).
1.2 Modern chrono-related studies
In the 1950s, Franz Halberg noticed that the eosinophil counts of both sighted and blinded
groups of mice rose and fell cyclically with temperature variations. In the former group, this
occurred at approximately the same time each day, and in the latter group, there was a
slight shift and a shorter cycle. Neither group showed an exact 24-hour cycle, showing the
existence of an endogenous mechanism (Halberg et al., 1959).
When the implications of these cycles were explored further, it was found that one group of
mice developed seizures when exposed to an extremely loud noise at 10:00 p.m., the active
period of their day, while another group that was exposed to the noise at noon, during their
rest period, did not develop seizures. It was also found that when a potential poison or high
doses of a drug were given to mice, whether they lived or died depended on the delivery
time of the drug.
The study of the body’s time structure was continued in the late 1960s by Halberg and his
Indian co-researchers in medical practice by administering radiation therapy to patients
with large oral tumours. The tumour temperature was used as a marker to schedule
treatments. Patients were divided into five groups and treated at a different time offset, –8, –
4, 0, +4 and +8 hours, from their peak temperature. More than 60% of patients who received
treatment when the tumour was at peak temperature were alive and disease-free two years
later. This is perhaps because the highest metabolic activity at peak temperature enhanced
the therapeutic effect (Halberg, 1969).
An increased swing in the amplitude of blood pressure, which develops before a rise in
mean blood pressure, was found in rats (Halberg, 1983). In 1987, this phenomenon was
confirmed to be a greater risk factor for ischemic stroke from a six-year study involving
nearly 300 patients (Halberg & Cornélissen, 1993). This is now known as circadian hyper
amplitude tension (CHAT). CHAT studies have shown that taking blood pressure
medication at an undesirable time can cause CHAT, and can potentially lead to a stroke.
In addition to body temperature and blood pressure, biorhythmic variations in other vital
signs, such as saliva, urine, blood, and heart rate, have been quantified to identify normal
and risky patterns for disease, to optimize the timing of treatment, and to compare
variations among subjects grouped by age and gender (Halberg et al., 2003; Halberg et al.,
2006a; Halberg et al., 2006b).
In 1960, the nascent field of biorhythm studies celebrated its first symposium in New York,
USA, and modern chrono-related studies are now expanding in both dimensional and
functional scales, from the genome level to the whole-body level, and from fundamental
chronobiology to medical applications, such as chronophysiology, chronopathology,
chronopharmacology, chronotherapy, chronotoxicology, and chronomedicine. All of these
topics are rooted in the study of biorhythmic events in living organisms and their
adaptation to solar- and lunar-related rhythms, and are still in the exciting process of
discovery.
Although rhythmic phenomena in many behavioural and life processes, such as eating,
sleeping–waking, seasonal migration, heart-beat, and cell proliferation, had been observed
in many aspects for a long time, little was known about their physiological background until
recent advances in molecular biology and genetics. Scientists have now identified specific
genes, proteins, and biochemical mechanisms that are responsible for spontaneous
oscillations with rhythmic cycles extended from the molecular, cellular, tissue, and system
levels on a spatial scale, from the millisecond intervals of neuronal activity to seasonal
changes in the temporal scale (Martha & Sejnowski, 2005).
The suprachiasmatic nucleus (SCN), composed of 20,000 or so autonomous cells located in
the hypothalamus, is now known to be responsible for controlling the timing of endogenous
rhythms (Stetson & Watson-Whitmyre, 1976). The SCN receives an environmental input,
such as light, a type of zeitgeber, from light receptors in the retina via the
retinohypothalamic tract (RHT), and generates a rhythmic output to coordinate and
synchronize body rhythms. The SCN is fundamental to each of the three major clock
components in biological systems: entrainment pathways, pacemakers, and output
pathways to effecter systems (Reppert & Weaver, 2001). Autonomous single-cell oscillators
reside in peripheral tissues as well as in the SCN of the pineal gland. Peripheral oscillators
may respond more directly to environmental factors, such as temperature, moisture,
pressure, and sound. However, the SCN governs and coordinates the rhythms of the
peripheral oscillators by both direct neural connections and diffusible biochemical processes
(Balsalobre et al., 2000). As a result of such synchronization, the body as an entire system
Discovery of Biorhythmic Stories behind Daily Vital Signs and Its Application 459
chemico-animal operation; a phenomenon effected by a concurrence of the united powers of
Nature with matter in a continual state of change.” He considered that the rhythmicity of
twenty-four hours is formed by the regular revolution of our earth, and can be seen in all
diseases, and all the other biorhythms are determined by it in reality (Hufeland, 1796).
In the early 19
th
century, identical conclusions from investigations into biorhythms from
different approaches and from independent researchers in different fields, such as
psychology and meteorology, were reached.
In his book “Die Perioden des Menschlichen Organismus (Periodicity in the Life of the
Human Organism)”, the Austrian psychologist Hermanna Swoboda stated that, “Life is
subject to consistent changes. This understanding does not refer to changes in our destiny or
to changes that take place in the course of life. Even if someone lived a life entirely free of
outside forces, of anything that could alter his mental and physical state, still his life would
not be identical from day to day. The best of physical health does not prevent us from
feeling ill sometimes, or less happy than usual”. By analysing dreams, ideas, and creative
impulses of his patients, Swoboda noticed very regular rhythms with predictable variations
in some artists’ performances and the mental status of pregnant women (Biochart Com,
2009).
Even the influence of meteorological factors, such as sunspot activity, was associated with
the acute chronic diseases of the heart, blood vessels, liver, kidney, and nervous system,
ranging from mild to severe, such as excitability, insomnia, tiredness, aches, muscle twitches,
polyuria, digestive troubles, jitteriness, shivering, spasms, neuralgia, neural crises, asthma,
dyspnea, fever, pain, vertigo, syncope, high blood pressure, tachycardia, arrhythmia, and
true angina pectoris (Vallot et al., 1922).
In 1924 and 1928, Alexander Chizhevsky (1897–1964) published “Epidemiological
Catastrophes and the Periodic Activity of the Sun” and “Influence of the Cosmos on Human
Psychoses”, respectively, studying biorhythms in living organisms in their connections with
solar and lunar cycles, stating that, “Life is a phenomenon. Its production is due to the
influence of the dynamics of the cosmos on a passive subject. It lives due to dynamics, each
oscillation of organic pulsation is coordinated with the cosmic heart in a grandiose whole of
nebulas, stars, the sun and the planet”, which is now formulated as the independent
discipline of “heliobiology” (Wikipedia, 2009a).
1.2 Modern chrono-related studies
In the 1950s, Franz Halberg noticed that the eosinophil counts of both sighted and blinded
groups of mice rose and fell cyclically with temperature variations. In the former group, this
occurred at approximately the same time each day, and in the latter group, there was a
slight shift and a shorter cycle. Neither group showed an exact 24-hour cycle, showing the
existence of an endogenous mechanism (Halberg et al., 1959).
When the implications of these cycles were explored further, it was found that one group of
mice developed seizures when exposed to an extremely loud noise at 10:00 p.m., the active
period of their day, while another group that was exposed to the noise at noon, during their
rest period, did not develop seizures. It was also found that when a potential poison or high
doses of a drug were given to mice, whether they lived or died depended on the delivery
time of the drug.
The study of the body’s time structure was continued in the late 1960s by Halberg and his
Indian co-researchers in medical practice by administering radiation therapy to patients
with large oral tumours. The tumour temperature was used as a marker to schedule
treatments. Patients were divided into five groups and treated at a different time offset, –8, –
4, 0, +4 and +8 hours, from their peak temperature. More than 60% of patients who received
treatment when the tumour was at peak temperature were alive and disease-free two years
later. This is perhaps because the highest metabolic activity at peak temperature enhanced
the therapeutic effect (Halberg, 1969).
An increased swing in the amplitude of blood pressure, which develops before a rise in
mean blood pressure, was found in rats (Halberg, 1983). In 1987, this phenomenon was
confirmed to be a greater risk factor for ischemic stroke from a six-year study involving
nearly 300 patients (Halberg & Cornélissen, 1993). This is now known as circadian hyper
amplitude tension (CHAT). CHAT studies have shown that taking blood pressure
medication at an undesirable time can cause CHAT, and can potentially lead to a stroke.
In addition to body temperature and blood pressure, biorhythmic variations in other vital
signs, such as saliva, urine, blood, and heart rate, have been quantified to identify normal
and risky patterns for disease, to optimize the timing of treatment, and to compare
variations among subjects grouped by age and gender (Halberg et al., 2003; Halberg et al.,
2006a; Halberg et al., 2006b).
In 1960, the nascent field of biorhythm studies celebrated its first symposium in New York,
USA, and modern chrono-related studies are now expanding in both dimensional and
functional scales, from the genome level to the whole-body level, and from fundamental
chronobiology to medical applications, such as chronophysiology, chronopathology,
chronopharmacology, chronotherapy, chronotoxicology, and chronomedicine. All of these
topics are rooted in the study of biorhythmic events in living organisms and their
adaptation to solar- and lunar-related rhythms, and are still in the exciting process of
discovery.
Although rhythmic phenomena in many behavioural and life processes, such as eating,
sleeping–waking, seasonal migration, heart-beat, and cell proliferation, had been observed
in many aspects for a long time, little was known about their physiological background until
recent advances in molecular biology and genetics. Scientists have now identified specific
genes, proteins, and biochemical mechanisms that are responsible for spontaneous
oscillations with rhythmic cycles extended from the molecular, cellular, tissue, and system
levels on a spatial scale, from the millisecond intervals of neuronal activity to seasonal
changes in the temporal scale (Martha & Sejnowski, 2005).
The suprachiasmatic nucleus (SCN), composed of 20,000 or so autonomous cells located in
the hypothalamus, is now known to be responsible for controlling the timing of endogenous
rhythms (Stetson & Watson-Whitmyre, 1976). The SCN receives an environmental input,
such as light, a type of zeitgeber, from light receptors in the retina via the
retinohypothalamic tract (RHT), and generates a rhythmic output to coordinate and
synchronize body rhythms. The SCN is fundamental to each of the three major clock
components in biological systems: entrainment pathways, pacemakers, and output
pathways to effecter systems (Reppert & Weaver, 2001). Autonomous single-cell oscillators
reside in peripheral tissues as well as in the SCN of the pineal gland. Peripheral oscillators
may respond more directly to environmental factors, such as temperature, moisture,
pressure, and sound. However, the SCN governs and coordinates the rhythms of the
peripheral oscillators by both direct neural connections and diffusible biochemical processes
(Balsalobre et al., 2000). As a result of such synchronization, the body as an entire system
Recent Advances in Biomedical Engineering460
maintains rhythms for not only the sleeping–waking cycle, but also for body temperature,
heart rate, blood pressure, immune cell count, and hormone secretion levels, such as cortisol
for stress and prolactin for immunity and reproduction. Rhythmic beating in the SCN is the
timepiece not only for daily cycles, but also for the totality of lifelong personal patterns,
potentially in a harmonic resonance with the environmental surroundings.
The clock genes are expressed not only in the SCN, but also in other brain regions and
various peripheral tissues. The liver has been confirmed to be a biological clock capable of
generating its own circadian rhythms (Turek & Allanda, 2002). A microarray analysis
experiment has revealed that there are many genes expressing a circadian rhythm in the
liver. The relative levels of gene expression in the liver of rats have been investigated from
the viewpoint of the time of day. Sixty-seven genes were identified where their expression
was significantly altered as a function of the time of day, and these were classified into
several key cellular pathways, including drug metabolism, ion transport, signal
transduction, DNA binding and regulation of transcription, and immune response
according to their functions (Desai et al., 2004).
In the cases where exogenous cues (zeitgebers) for timing, such as light, temperature, or
sound, are shielded, the SCN moves out of synchronization with the exogenous entrainment.
However, the innate rhythm is not obliterated, because biorhythms are genetically built into
cells, tissues, organs, and the whole-body system. The body still maintains its rhythms, but
not in an organized tempo. The sleeping–waking cycle and body temperature variation will
not follow an exact 24-hour cycle, which was entrained by the light–dark cycle or the
sunset–sunrise cycle. Other biorhythms and daily activities could also be affected, although
none has all its variables equal.
The broad spectrum of different biorhythms is classified into three categories, i.e., circadian
rhythms, ultradian rhythms, and infradian rhythms.
The circadian rhythm is the most common biorhythm, alternates in an approximately daily
cycle, and exists in most living organisms. The term “circadian” comes from circa, which
means “about”, and dies, which means “day”.
Ultradian rhythms refer to those cyclic intervals that are shorter than the period of a
circadian rhythm, exhibiting periodic physiological activity occurring more than once
within a day, such as neuron firing, heart-beats, inhalation and expiration, and REM–NREM
sleep cycles.
Infradian rhythms pertain to regular recurrences in cycles of longer than the period of a
circadian rhythm, and occur on an extended scale from days to years. Some of these are
listed below:
Circasemiseptan rhythms have a cyclic length of 70 to 98 hours or 3.5 days, and exist in
blood pressure and heart rate fluctuations. They can be found in patients with incidence
of myocardial infarction and apoplexy.
Circaseptan rhythms occur in periods of 140 to 196 hours or about one week, and are
found in changes in body temperature and blood pressure.
Circatrigintan rhythms behave in approximately monthly cycles. The most common is
the female menstrual cycle, ranging from 25 to 35 days. Others include the emotional
and physical stamina rhythms, which change over 28 days and 23 days, respectively.
Intellectual rhythmicity was found to exhibit a regular 33-day cycle for mental agility
and ability. The existence of a 21-day cycle related specifically to moods was uncovered.
Some vital signs, such as hormone secretion, blood pressure, and metabolic activity,
have similar properties.
Circannual rhythms occur over a period of between 305 to 425 days, or about a year.
Most plants have a seasonal change from rootage, burgeon, blossom, and fructification.
Migratory birds migrate in an annual pattern through regular seasonal journeys in
response to changes in food availability, habitat, or weather.
Table 1 summarizes various known biorhythms ranging from periods of milliseconds to
years that exist in living organisms.
Biorhythm Cycle length Related event
Ultradian < 1 d
Neuron firing, heart beating,
inhalation and expiration, REM–
NREM sleep cycles
Circadian
1 d 4 h
Body temperature (BT), blood
pressure (BP), heart rate (HR),
hormone secretion
Infradian
Circadidian 2 ± 0.5 d Body weight, urine volume
Circasemiseptan 3.5 ± 1 d Sudden death
Circaseptan 7 ± 1.5 d
Rejection of heart transplant,
activity, BP, BT
Circadiseptan 14 ± 3 d Body weight, grip strength
Circavigintan 21 ± 3 d Mood, 17-ketosteroid excretion
Circatrigintan 28 ± 5 d
Emotional and physical stamina,
mental agility and ability,
menstruation
Circannual 1 y ± 2 m BP, aldosterone
Circaseptennian 7 ± 1 y Marine invertebrates
Circaduodecennian
12 ± 2 y BP
Circadidecadal 20 y BP
Table 1. Temporal definitions and the properties of diversified biorhythms ranging from
periods of milliseconds to years (adapted from Halberg & Cornélissen, 1993; Koukkari &
Sothern, 2006). Cycle length: h = hours; d = days; m = months; y = years.
Objective estimation of various biorhythmicities in different physiological vital signs and
biochemical biomarkers, such as body temperature, heart rate, blood pressure,
adrenocorticotropic hormone, and melatonin, is indispensable in medical practice. Many
vital signs and biomarkers are usually modulated and interacted by multiple biorhythms.
Similarly, multiple biorhythms are often interwoven within a vital sign or a biomarker as
shown in Table 1. Because biorhythms are cyclic, recurring physiological events, their
features in time structures are commonly expressed by parameters such as period, mesor,
Discovery of Biorhythmic Stories behind Daily Vital Signs and Its Application 461
maintains rhythms for not only the sleeping–waking cycle, but also for body temperature,
heart rate, blood pressure, immune cell count, and hormone secretion levels, such as cortisol
for stress and prolactin for immunity and reproduction. Rhythmic beating in the SCN is the
timepiece not only for daily cycles, but also for the totality of lifelong personal patterns,
potentially in a harmonic resonance with the environmental surroundings.
The clock genes are expressed not only in the SCN, but also in other brain regions and
various peripheral tissues. The liver has been confirmed to be a biological clock capable of
generating its own circadian rhythms (Turek & Allanda, 2002). A microarray analysis
experiment has revealed that there are many genes expressing a circadian rhythm in the
liver. The relative levels of gene expression in the liver of rats have been investigated from
the viewpoint of the time of day. Sixty-seven genes were identified where their expression
was significantly altered as a function of the time of day, and these were classified into
several key cellular pathways, including drug metabolism, ion transport, signal
transduction, DNA binding and regulation of transcription, and immune response
according to their functions (Desai et al., 2004).
In the cases where exogenous cues (zeitgebers) for timing, such as light, temperature, or
sound, are shielded, the SCN moves out of synchronization with the exogenous entrainment.
However, the innate rhythm is not obliterated, because biorhythms are genetically built into
cells, tissues, organs, and the whole-body system. The body still maintains its rhythms, but
not in an organized tempo. The sleeping–waking cycle and body temperature variation will
not follow an exact 24-hour cycle, which was entrained by the light–dark cycle or the
sunset–sunrise cycle. Other biorhythms and daily activities could also be affected, although
none has all its variables equal.
The broad spectrum of different biorhythms is classified into three categories, i.e., circadian
rhythms, ultradian rhythms, and infradian rhythms.
The circadian rhythm is the most common biorhythm, alternates in an approximately daily
cycle, and exists in most living organisms. The term “circadian” comes from circa, which
means “about”, and dies, which means “day”.
Ultradian rhythms refer to those cyclic intervals that are shorter than the period of a
circadian rhythm, exhibiting periodic physiological activity occurring more than once
within a day, such as neuron firing, heart-beats, inhalation and expiration, and REM–NREM
sleep cycles.
Infradian rhythms pertain to regular recurrences in cycles of longer than the period of a
circadian rhythm, and occur on an extended scale from days to years. Some of these are
listed below:
Circasemiseptan rhythms have a cyclic length of 70 to 98 hours or 3.5 days, and exist in
blood pressure and heart rate fluctuations. They can be found in patients with incidence
of myocardial infarction and apoplexy.
Circaseptan rhythms occur in periods of 140 to 196 hours or about one week, and are
found in changes in body temperature and blood pressure.
Circatrigintan rhythms behave in approximately monthly cycles. The most common is
the female menstrual cycle, ranging from 25 to 35 days. Others include the emotional
and physical stamina rhythms, which change over 28 days and 23 days, respectively.
Intellectual rhythmicity was found to exhibit a regular 33-day cycle for mental agility
and ability. The existence of a 21-day cycle related specifically to moods was uncovered.
Some vital signs, such as hormone secretion, blood pressure, and metabolic activity,
have similar properties.
Circannual rhythms occur over a period of between 305 to 425 days, or about a year.
Most plants have a seasonal change from rootage, burgeon, blossom, and fructification.
Migratory birds migrate in an annual pattern through regular seasonal journeys in
response to changes in food availability, habitat, or weather.
Table 1 summarizes various known biorhythms ranging from periods of milliseconds to
years that exist in living organisms.
Biorhythm Cycle length Related event
Ultradian < 1 d
Neuron firing, heart beating,
inhalation and expiration, REM–
NREM sleep cycles
Circadian
1 d 4 h
Body temperature (BT), blood
pressure (BP), heart rate (HR),
hormone secretion
Infradian
Circadidian 2 ± 0.5 d Body weight, urine volume
Circasemiseptan 3.5 ± 1 d Sudden death
Circaseptan 7 ± 1.5 d
Rejection of heart transplant,
activity, BP, BT
Circadiseptan 14 ± 3 d Body weight, grip strength
Circavigintan 21 ± 3 d Mood, 17-ketosteroid excretion
Circatrigintan 28 ± 5 d
Emotional and physical stamina,
mental agility and ability,
menstruation
Circannual 1 y ± 2 m BP, aldosterone
Circaseptennian 7 ± 1 y Marine invertebrates
Circaduodecennian
12 ± 2 y BP
Circadidecadal 20 y BP
Table 1. Temporal definitions and the properties of diversified biorhythms ranging from
periods of milliseconds to years (adapted from Halberg & Cornélissen, 1993; Koukkari &
Sothern, 2006). Cycle length: h = hours; d = days; m = months; y = years.
Objective estimation of various biorhythmicities in different physiological vital signs and
biochemical biomarkers, such as body temperature, heart rate, blood pressure,
adrenocorticotropic hormone, and melatonin, is indispensable in medical practice. Many
vital signs and biomarkers are usually modulated and interacted by multiple biorhythms.
Similarly, multiple biorhythms are often interwoven within a vital sign or a biomarker as
shown in Table 1. Because biorhythms are cyclic, recurring physiological events, their
features in time structures are commonly expressed by parameters such as period, mesor,
Recent Advances in Biomedical Engineering462
amplitude and phase, zenith and nadir, onset of events, the minimum and maximum
incidence of events, and the shape of the rhythmic pattern.
Mathematical approaches to quantifying biorhythms were classified into two categories in
the early stages of their study: macroscopic and microscopic (Halberg, 1969). The former
category employs many statistical techniques, such as histograms, mean, median, mode, and
variance. The latter category uses chronograms, variance spectrum, auto/cross correlations,
coherency, and the cosinor method.
The cosinor method uses least-squares criteria to fit raw data on a presumptive single sine
wave model in the time domain. Its variants, such as population mean-cosinor, group mean-
cosinor, multi-cosinor and non-linear cosinor methods, are similarly based on various
compound models (Nelson et al., 1979). The multivariate method has also been used for the
parameter estimation of biorhythms in human leukocyte counts in microfilariasis infection
(Kumar et al., 1992).
In addition to living organisms, the biosphere and the solar system are good examples of
self-tuning control systems. The laws governing the operation of control systems are
incorporated in the development of mathematical methods for the identification of rhythms
hidden in the dynamics of biological and heliogeophysical variables (Chirkova, 1995).
Fourier transformation and spectral analysis methods have also been developed to evaluate
and analyse biorhythms regarding their general characteristics in terms of amplitude, phase,
periodical frequency, and cyclic length (Chou & Besch, 1974).
The determination of biorhythms is helpful not only in clarifying their impact on the
pathophysiology of diseases, but also in elucidating the pharmacokinetics and
pharmacodynamics of medications.
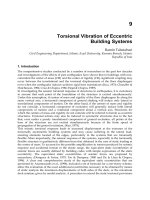
Figure 2 shows the circadian properties of various physiological vital signs and biochemical
markers, in alignment with time-dependent symptoms or events of diseases that are in
either the severest timing or the most frequent incidence of the disease.
As shown in Figure 2, allergic rhinitis is typically worse in the early waking hours than later
during the day. Asthma usually occurs more than 100 times more in the few hours prior to
awakening than during the day. Angina commonly occurs during the first four to six hours
after awakening. Hypertension typically occurs from late morning to middle afternoon.
Rheumatoid arthritis is most intense upon awakening. Osteoarthritis worsens in the
afternoon and evening. Ulcer disease typically occurs after stomach emptying, following
daytime meals, and in the very early morning, often disrupting sleep. Epilepsy often occurs
only at individual particular times of the day or night (Smolensky & Labrecque, 1997).
The daily variation pattern of the symptoms of diseases and biochemical-pathophysiological
processes is now used to optimize treatment of various diseases, such as asthma, cancer,
diabetes, fibromyalgia, heartburn, and sleep disorders. Chronopharmacokinetic studies
have been reported for many drugs in an attempt to explain chronopharmacological
phenomena, and these have demonstrated that the time of administration is a possible factor
in the variation in the pharmacokinetics of a drug. Time-dependent changes in
pharmacokinetics may proceed from the circadian rhythm of each process, e.g., absorption,
distribution, metabolism, and elimination. Thus, circadian rhythms in gastric acid secretion
and pH, motility, gastric emptying time, gastrointestinal blood flow, drug protein binding,
liver enzyme activity and/or hepatic blood flow, glomerular filtration, renal blood flow,
urinary pH, and tubular resorption play a role in such pharmacokinetic variations
(Labrecque & Belanger, 1991). More than 100 drugs, such as cardiovascular agents, anti-
asthmatic agents, gastrointestinal agents, non-steroidal anti-inflammatory agents, and anti-
cancer agents, have already been recognized as exhibiting circadian variations in
pharmacokinetic and pharmacodynamic performance over a period of 24 hours (Lemmer,
1994). Chronotherapeutic principles are realized through innovative drug delivery
technology in the safe and efficient administration of medications (Smolensky & Labrecque,
1997).
Fig. 2. Circadian rhythmic changes of physiological vital signs and biochemical markers,
and symptoms or events of diseases in the case of worst timing or highest likelihood
(adapted from Smolensky & Labrecque, 1997; Ohdo, 2007). The outer ring indicates the
symptom and disease. The inner ring indicates vital signs and biomarkers.
Other applications utilizing biorhythms can be found in health care, human welfare, and
behavioural administration domains. A conventional alarm clock is usually set in advance to
sound a bell or buzzer at a desired hour. During the Stage 1 period of sleep, a person drifts
in and out of sleep, and can be awakened easily. However, it is very difficult to be woken up
during deep sleep periods, such as Stages 3 and 4. When a person is awakened during deep
sleep stages, it is difficult for them to adapt immediately, and they often feel groggy and
Discovery of Biorhythmic Stories behind Daily Vital Signs and Its Application 463
amplitude and phase, zenith and nadir, onset of events, the minimum and maximum
incidence of events, and the shape of the rhythmic pattern.
Mathematical approaches to quantifying biorhythms were classified into two categories in
the early stages of their study: macroscopic and microscopic (Halberg, 1969). The former
category employs many statistical techniques, such as histograms, mean, median, mode, and
variance. The latter category uses chronograms, variance spectrum, auto/cross correlations,
coherency, and the cosinor method.
The cosinor method uses least-squares criteria to fit raw data on a presumptive single sine
wave model in the time domain. Its variants, such as population mean-cosinor, group mean-
cosinor, multi-cosinor and non-linear cosinor methods, are similarly based on various
compound models (Nelson et al., 1979). The multivariate method has also been used for the
parameter estimation of biorhythms in human leukocyte counts in microfilariasis infection
(Kumar et al., 1992).
In addition to living organisms, the biosphere and the solar system are good examples of
self-tuning control systems. The laws governing the operation of control systems are
incorporated in the development of mathematical methods for the identification of rhythms
hidden in the dynamics of biological and heliogeophysical variables (Chirkova, 1995).
Fourier transformation and spectral analysis methods have also been developed to evaluate
and analyse biorhythms regarding their general characteristics in terms of amplitude, phase,
periodical frequency, and cyclic length (Chou & Besch, 1974).
The determination of biorhythms is helpful not only in clarifying their impact on the
pathophysiology of diseases, but also in elucidating the pharmacokinetics and
pharmacodynamics of medications.
Figure 2 shows the circadian properties of various physiological vital signs and biochemical
markers, in alignment with time-dependent symptoms or events of diseases that are in
either the severest timing or the most frequent incidence of the disease.
As shown in Figure 2, allergic rhinitis is typically worse in the early waking hours than later
during the day. Asthma usually occurs more than 100 times more in the few hours prior to
awakening than during the day. Angina commonly occurs during the first four to six hours
after awakening. Hypertension typically occurs from late morning to middle afternoon.
Rheumatoid arthritis is most intense upon awakening. Osteoarthritis worsens in the
afternoon and evening. Ulcer disease typically occurs after stomach emptying, following
daytime meals, and in the very early morning, often disrupting sleep. Epilepsy often occurs
only at individual particular times of the day or night (Smolensky & Labrecque, 1997).
The daily variation pattern of the symptoms of diseases and biochemical-pathophysiological
processes is now used to optimize treatment of various diseases, such as asthma, cancer,
diabetes, fibromyalgia, heartburn, and sleep disorders. Chronopharmacokinetic studies
have been reported for many drugs in an attempt to explain chronopharmacological
phenomena, and these have demonstrated that the time of administration is a possible factor
in the variation in the pharmacokinetics of a drug. Time-dependent changes in
pharmacokinetics may proceed from the circadian rhythm of each process, e.g., absorption,
distribution, metabolism, and elimination. Thus, circadian rhythms in gastric acid secretion
and pH, motility, gastric emptying time, gastrointestinal blood flow, drug protein binding,
liver enzyme activity and/or hepatic blood flow, glomerular filtration, renal blood flow,
urinary pH, and tubular resorption play a role in such pharmacokinetic variations
(Labrecque & Belanger, 1991). More than 100 drugs, such as cardiovascular agents, anti-
asthmatic agents, gastrointestinal agents, non-steroidal anti-inflammatory agents, and anti-
cancer agents, have already been recognized as exhibiting circadian variations in
pharmacokinetic and pharmacodynamic performance over a period of 24 hours (Lemmer,
1994). Chronotherapeutic principles are realized through innovative drug delivery
technology in the safe and efficient administration of medications (Smolensky & Labrecque,
1997).
Fig. 2. Circadian rhythmic changes of physiological vital signs and biochemical markers,
and symptoms or events of diseases in the case of worst timing or highest likelihood
(adapted from Smolensky & Labrecque, 1997; Ohdo, 2007). The outer ring indicates the
symptom and disease. The inner ring indicates vital signs and biomarkers.
Other applications utilizing biorhythms can be found in health care, human welfare, and
behavioural administration domains. A conventional alarm clock is usually set in advance to
sound a bell or buzzer at a desired hour. During the Stage 1 period of sleep, a person drifts
in and out of sleep, and can be awakened easily. However, it is very difficult to be woken up
during deep sleep periods, such as Stages 3 and 4. When a person is awakened during deep
sleep stages, it is difficult for them to adapt immediately, and they often feel groggy and
Recent Advances in Biomedical Engineering464
disoriented for several minutes after waking. A biorhythm-based bell device, biological
rhythm-based awakening timing controller (BRAC), was developed to estimate biorhythm
changes in sleep cycles from fingertip pulse waves, and was used to optimize the alarm
timing (Wakuda et al., 2007).
Jet lag is a malaise often associated with long-distance travel across several time zones. Some
of the symptoms usually reported are fatigue, drowsiness, irritability, inability to concentrate
during the day, difficulty in sleeping at night, and gastrointestinal discomfort (Katz et al., 2001).
Shift workers, such as truck drivers and emergency medical personnel, who are obliged to
work non-standard office hours, exhibit similar symptoms to those of jet lag.
Sufferers of jet lag and shift workers are affected by a transient misalignment of the
circadian clock with the external clock. Both disorders have a common cause in aetiology,
but a major difference exists between the two situations. A long-distance traveller can
resynchronize their internal clock within a few days after their biorhythm is disturbed
because their internal clock is out of phase with the external clock of sunrise and sunset. By
contrast, as long as the daily work schedule of a shift worker cannot be synchronized with
the natural biorhythms, they will be unable to truly adapt their biorhythms to the external
clock. Although effective treatment has not been rigorously documented yet, the symptoms
are usually treated using a light therapy method, for example, artificial light reversal of day
and night, which can be attained by subjecting the patient to bright artificial light at night
and avoiding photoic stimulation during sunlight hours by wearing sunglasses or closing
window curtains (Smolensky & Lamberg, 2000).
It has also been shown that although the exact timing varies from individual to individual,
performance in physical and intellectual activities exhibits a daily rhythmicity. The best
performance is achieved around the peak body temperature time, which usually occurs in
the late afternoon, although overall performance in real world situations can be affected by
many other factors, such as innate and acquired skills, motivation, concentration, and spot
exertion (Dunlap et al., 2004).
Biorhythmicities are recognized as affecting numerous physiological and behavioural
processes. The daily pattern of human activity and stress amplifies the innate biological
variability of biorhythms, and diseases can alter the expression and characteristics of
circadian and other biorhythms. The outcomes of the chronotherapeutic treatment of several
diseases that have predictable circadian variations, such as allergic rhinitis, angina pectoris,
arthritis, asthma, diabetes, epilepsy, hypertension, dyslipidemia, cancer, and ulcers have
been confirmed to be more effective than traditional homeostatic treatments (Elliott, 2001).
Such time-dependent biochemical processes and pathophysiological phenomena exist
ubiquitously, from local cells to the whole body. In summary, the occurrence of biorhythms
is physiologically indispensable in life processes, and provides several advantages (Moser et
al., 2006):
Stability maintenance in response to endogenous and exogenous variations by fine-
tuning the characteristics at various levels, such as cellular, organic, and holistic systems,
for controlling long-term physiological functionality;
Synchronization and coordination of different visceral organs, enabling the system to
function most efficiently;
Temporal compartmentalization, mediating polar events, such as systole and diastole,
inspiration and expiration, work and rest, waking and sleeping, which cannot happen
simultaneously, to occur both in alternation and efficiently in the same physical space.
The discovery of biorhythmic patterns and their perturbation is essential not only for proper
diagnosis and treatment of patients suffering from various diseases, but also for daily health
management of healthy persons. The following section describes our studies and the results
of the long-term monitoring of various biorhythms.
2. Our Studies
The natural world is teeming with cyclic patterns and sequential events, and biorhythms are
known to be important in treating disease and managing health. However, monitoring vital
signs continuously in a daily life environment over a long period is a tedious task indeed.
People can put up with such unpleasant assignments without much complaint over a short
time period if they are on a course of treatment. However, in cases where they have no
obvious symptoms, and are asked to do so purely for health care purposes, such boring
daily duties will soon cause people to run out of patience.
The purposes of our studies were twofold:
To develop convenient ways to monitor vital signs that were suitable for utilization in
daily life environments for any time period without much discomfort to the user.
To assess biorhythms through various mathematical approaches from the large amount
of physiological data collected daily over a long period.
Two modes of study model are presented below. The first part describes the detection of
multiple biorhythms from a single vital sign, while the second part reports on the detection
of a single biorhythm from multiple vital signs.
2.1 Discovery of multiple biorhythms from a single vital sign
Multiple biorhythms are usually interwoven within an identical vital sign. This section
describes the detection of different biorhythms, i.e., sleep patterns, behavioural changes, and
menstrual cycles using different mathematical approaches from heart rate data collected
during sleep.
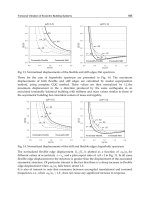
2.1.1 Data collection
Heart rate data were collected during sleep using the scheme shown in Figure 3. The subject
slept wearing a wrist-type Bluetooth-enabled SpO2 sensor (Model 4100, Nonin Corp., USA).
A bedside box situated nearby the bed was always on stand-by waiting for the SpO2 sensor
to initiate. When the SpO2 sensor was switched on, the Bluetooth wireless connection
between the bedside box and the SpO2 sensor device was established automatically. With
the help of the bedside box, HR and SpO2 data were collected from the SpO2 sensor via the
Bluetooth connection and were transmitted continuously to a database server by an HTTP
connection through an ADSL LAN in the home during a given sleep episode. When the
subject rose and removed the sensor in the morning, the Bluetooth connection was closed,
the bedside box went into stand-by mode, and the data collection procedure was terminated.
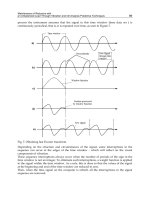
Although the sensor collected both HR and SpO2 data simultaneously, only the HR data
were used in this study. A single night’s sample of collected raw HR data is shown in the
black trace in Figure 4. The frequent interruption of noise spikes was perhaps due to
movement artefacts, or a misinterpretation of the transmitted data package. Such noise has
to be suppressed before biorhythm detection is conducted.
Discovery of Biorhythmic Stories behind Daily Vital Signs and Its Application 465
disoriented for several minutes after waking. A biorhythm-based bell device, biological
rhythm-based awakening timing controller (BRAC), was developed to estimate biorhythm
changes in sleep cycles from fingertip pulse waves, and was used to optimize the alarm
timing (Wakuda et al., 2007).
Jet lag is a malaise often associated with long-distance travel across several time zones. Some
of the symptoms usually reported are fatigue, drowsiness, irritability, inability to concentrate
during the day, difficulty in sleeping at night, and gastrointestinal discomfort (Katz et al., 2001).
Shift workers, such as truck drivers and emergency medical personnel, who are obliged to
work non-standard office hours, exhibit similar symptoms to those of jet lag.
Sufferers of jet lag and shift workers are affected by a transient misalignment of the
circadian clock with the external clock. Both disorders have a common cause in aetiology,
but a major difference exists between the two situations. A long-distance traveller can
resynchronize their internal clock within a few days after their biorhythm is disturbed
because their internal clock is out of phase with the external clock of sunrise and sunset. By
contrast, as long as the daily work schedule of a shift worker cannot be synchronized with
the natural biorhythms, they will be unable to truly adapt their biorhythms to the external
clock. Although effective treatment has not been rigorously documented yet, the symptoms
are usually treated using a light therapy method, for example, artificial light reversal of day
and night, which can be attained by subjecting the patient to bright artificial light at night
and avoiding photoic stimulation during sunlight hours by wearing sunglasses or closing
window curtains (Smolensky & Lamberg, 2000).
It has also been shown that although the exact timing varies from individual to individual,
performance in physical and intellectual activities exhibits a daily rhythmicity. The best
performance is achieved around the peak body temperature time, which usually occurs in
the late afternoon, although overall performance in real world situations can be affected by
many other factors, such as innate and acquired skills, motivation, concentration, and spot
exertion (Dunlap et al., 2004).
Biorhythmicities are recognized as affecting numerous physiological and behavioural
processes. The daily pattern of human activity and stress amplifies the innate biological
variability of biorhythms, and diseases can alter the expression and characteristics of
circadian and other biorhythms. The outcomes of the chronotherapeutic treatment of several
diseases that have predictable circadian variations, such as allergic rhinitis, angina pectoris,
arthritis, asthma, diabetes, epilepsy, hypertension, dyslipidemia, cancer, and ulcers have
been confirmed to be more effective than traditional homeostatic treatments (Elliott, 2001).
Such time-dependent biochemical processes and pathophysiological phenomena exist
ubiquitously, from local cells to the whole body. In summary, the occurrence of biorhythms
is physiologically indispensable in life processes, and provides several advantages (Moser et
al., 2006):
Stability maintenance in response to endogenous and exogenous variations by fine-
tuning the characteristics at various levels, such as cellular, organic, and holistic systems,
for controlling long-term physiological functionality;
Synchronization and coordination of different visceral organs, enabling the system to
function most efficiently;
Temporal compartmentalization, mediating polar events, such as systole and diastole,
inspiration and expiration, work and rest, waking and sleeping, which cannot happen
simultaneously, to occur both in alternation and efficiently in the same physical space.
The discovery of biorhythmic patterns and their perturbation is essential not only for proper
diagnosis and treatment of patients suffering from various diseases, but also for daily health
management of healthy persons. The following section describes our studies and the results
of the long-term monitoring of various biorhythms.
2. Our Studies
The natural world is teeming with cyclic patterns and sequential events, and biorhythms are
known to be important in treating disease and managing health. However, monitoring vital
signs continuously in a daily life environment over a long period is a tedious task indeed.
People can put up with such unpleasant assignments without much complaint over a short
time period if they are on a course of treatment. However, in cases where they have no
obvious symptoms, and are asked to do so purely for health care purposes, such boring
daily duties will soon cause people to run out of patience.
The purposes of our studies were twofold:
To develop convenient ways to monitor vital signs that were suitable for utilization in
daily life environments for any time period without much discomfort to the user.
To assess biorhythms through various mathematical approaches from the large amount
of physiological data collected daily over a long period.
Two modes of study model are presented below. The first part describes the detection of
multiple biorhythms from a single vital sign, while the second part reports on the detection
of a single biorhythm from multiple vital signs.
2.1 Discovery of multiple biorhythms from a single vital sign
Multiple biorhythms are usually interwoven within an identical vital sign. This section
describes the detection of different biorhythms, i.e., sleep patterns, behavioural changes, and
menstrual cycles using different mathematical approaches from heart rate data collected
during sleep.
2.1.1 Data collection
Heart rate data were collected during sleep using the scheme shown in Figure 3. The subject
slept wearing a wrist-type Bluetooth-enabled SpO2 sensor (Model 4100, Nonin Corp., USA).
A bedside box situated nearby the bed was always on stand-by waiting for the SpO2 sensor
to initiate. When the SpO2 sensor was switched on, the Bluetooth wireless connection
between the bedside box and the SpO2 sensor device was established automatically. With
the help of the bedside box, HR and SpO2 data were collected from the SpO2 sensor via the
Bluetooth connection and were transmitted continuously to a database server by an HTTP
connection through an ADSL LAN in the home during a given sleep episode. When the
subject rose and removed the sensor in the morning, the Bluetooth connection was closed,
the bedside box went into stand-by mode, and the data collection procedure was terminated.
Although the sensor collected both HR and SpO2 data simultaneously, only the HR data
were used in this study. A single night’s sample of collected raw HR data is shown in the
black trace in Figure 4. The frequent interruption of noise spikes was perhaps due to
movement artefacts, or a misinterpretation of the transmitted data package. Such noise has
to be suppressed before biorhythm detection is conducted.
Recent Advances in Biomedical Engineering466
Fig. 3. Schematic drawing showing HR and SpO2 data collection during sleep. By attaching
a Bluetooth-enabled SpO2 sensor to a fingertip, the nearby bedside box established a
Bluetooth connection with the sensor automatically, and received HR and SpO2 data from
the sensor simultaneously. These data were transmitted continuously to a database server
via an HTTP connection.
Fig. 4. Raw HR data (thin black trace) and filtered HR data (bold red trace) over a single
night’s sleep. Raw data were collected by a SpO2 sensor from a fingertip. Filtered data were
obtained by applying a median filter and a Savitzky–Golay smoothing filter.
2.1.2 Noise suppression
Unless arrhythmia occurs, the premise of smoothing is that the HR varies slowly in nature,
but its measurement is often contaminated by random noise or other artefacts. As shown in
the black trace in Figure 4, the main source of noise in the raw measurement during sleep is
a spike-like noise.
Noise suppression was implemented using two digital filters in two steps. A median filter
was used in the first step to remove the spike-like noise, and a Savitzky–Golay filter was
used in the second step to smooth the HR profile.
The median filter was a non-linear digital filtering technique, usually used in the image-
processing field to remove speckle noise and salt/pepper noise from images. The idea was
to represent the signal by replacing an extremely large or small value with a reasonable
candidate value. This is realized using a window consisting of an odd number of data. The
values within the window were sorted in numerical order, and the median value, the
sample in the centre of the window, was selected as the output of the filter.
When the window was moved along the signal, the output of the median filter y(i) at a
moment i was calculated as the median value of the input values x(i) corresponding to the
moments adjacent to i ranging from –L/2 to L/2.
2/,12/, ,, ,12/,2/ LixLixixLixLixmedianiy
, (1)
where L is the length of the window.
The Savitzky–Golay filter was used to smooth the signal that was outputted from the
median filter. The Savitzky–Golay filter segmented the signal as frames using a moving
window, and approximated the signal frames one by one using a high-order polynomial,
typically quadratic or quartic (Savitzky & Golay, 1964).
Each digital filter output z(i) can be expressed by a linear combination of the nearby input
points as
R
L
n
nk
k
kiyciz
, (1)
where n
L
is the number of points on the left-hand side of the data point i, and n
R
is the
number of points on the right-hand side of i.
The Savitzky–Golay filtering process is to find a proper polynomial to fit all n
L
+n
R
+1 points
within each window frame on the least-squares meaning, and to produce a filter output z(i)
as the value of that polynomial at position i.
To derive filter coefficients, c
k
, we considered fitting a polynomial of degree M in i, namely
a
0
+a
1
i+a
2
i
2
+···+a
M
i
M
to the values y
−nL
, ,y
nR
. Then, z(0) will be the value of that polynomial
at i = 0, namely a
0
. The design matrix for this problem is
MjnniiA
RL
j
ij
, ,0,, ,0, ,, , (1)
and the normal equations for the polynomial coefficients vector, a=[a
0
, a
1
, a
2
,···, a
M
], in terms
of the input data vector, y=[y
−nL
, ,y
nR
], can be written in matrix notation as below:
yaA
, (1)
The polynomial coefficients vector, a, becomes
yAAAa
TT
1
, (1)
Discovery of Biorhythmic Stories behind Daily Vital Signs and Its Application 467
Fig. 3. Schematic drawing showing HR and SpO2 data collection during sleep. By attaching
a Bluetooth-enabled SpO2 sensor to a fingertip, the nearby bedside box established a
Bluetooth connection with the sensor automatically, and received HR and SpO2 data from
the sensor simultaneously. These data were transmitted continuously to a database server
via an HTTP connection.
Fig. 4. Raw HR data (thin black trace) and filtered HR data (bold red trace) over a single
night’s sleep. Raw data were collected by a SpO2 sensor from a fingertip. Filtered data were
obtained by applying a median filter and a Savitzky–Golay smoothing filter.
2.1.2 Noise suppression
Unless arrhythmia occurs, the premise of smoothing is that the HR varies slowly in nature,
but its measurement is often contaminated by random noise or other artefacts. As shown in
the black trace in Figure 4, the main source of noise in the raw measurement during sleep is
a spike-like noise.
Noise suppression was implemented using two digital filters in two steps. A median filter
was used in the first step to remove the spike-like noise, and a Savitzky–Golay filter was
used in the second step to smooth the HR profile.
The median filter was a non-linear digital filtering technique, usually used in the image-
processing field to remove speckle noise and salt/pepper noise from images. The idea was
to represent the signal by replacing an extremely large or small value with a reasonable
candidate value. This is realized using a window consisting of an odd number of data. The
values within the window were sorted in numerical order, and the median value, the
sample in the centre of the window, was selected as the output of the filter.
When the window was moved along the signal, the output of the median filter y(i) at a
moment i was calculated as the median value of the input values x(i) corresponding to the
moments adjacent to i ranging from –L/2 to L/2.
2/,12/, ,, ,12/,2/ LixLixixLixLixmedianiy
, (1)
where L is the length of the window.
The Savitzky–Golay filter was used to smooth the signal that was outputted from the
median filter. The Savitzky–Golay filter segmented the signal as frames using a moving
window, and approximated the signal frames one by one using a high-order polynomial,
typically quadratic or quartic (Savitzky & Golay, 1964).
Each digital filter output z(i) can be expressed by a linear combination of the nearby input
points as
R
L
n
nk
k
kiyciz
, (1)
where n
L
is the number of points on the left-hand side of the data point i, and n
R
is the
number of points on the right-hand side of i.
The Savitzky–Golay filtering process is to find a proper polynomial to fit all n
L
+n
R
+1 points
within each window frame on the least-squares meaning, and to produce a filter output z(i)
as the value of that polynomial at position i.
To derive filter coefficients, c
k
, we considered fitting a polynomial of degree M in i, namely
a
0
+a
1
i+a
2
i
2
+···+a
M
i
M
to the values y
−nL
, ,y
nR
. Then, z(0) will be the value of that polynomial
at i = 0, namely a
0
. The design matrix for this problem is
MjnniiA
RL
j
ij
, ,0,, ,0, ,, , (1)
and the normal equations for the polynomial coefficients vector, a=[a
0
, a
1
, a
2
,···, a
M
], in terms
of the input data vector, y=[y
−nL
, ,y
nR
], can be written in matrix notation as below:
yaA
, (1)
The polynomial coefficients vector, a, becomes
yAAAa
TT
1
, (1)
Recent Advances in Biomedical Engineering468
We also have the specific forms
R
L
R
L
n
nk
ji
n
nk
kjki
ij
T
kAAAA
, (1)
and
R
L
R
L
n
nk
k
j
n
nk
kkj
j
T
ykyAyA
, (1)
Since the filter coefficient, c
k
, is the component a
0
when y is replaced by the unit vector e
k
,
we have
M
m
m
m
T
k
TT
k
kc
0
0
1
0
1
AAeAAA
, –n
L
≤ k < n
R
, (1)
When the filter coefficient vector c=[c
-nL
,…,c
nR
] was obtained using Equation (8), the signal
shown in the black trace in Figure 4 could be smoothed using Equation (2), and the result is
the red trace shown in Figure 4.
After these two filtering steps, the noise-suppressed HR data were used for the detection of
three different biorhythms, as described in the following three sections.
2.1.3 Sleep cycle estimation
Sleep is clinically classified into two distinct states: the rapid eye movement (REM) state and
the non-rapid eye movement (NREM) state. The NREM state is further divided into four
stages, 1–4, indicating four depths of sleep from shallow to deep. When drifting into sleep, a
normal sleep cycle moves in a sequential progress from Stage 1 through to Stage 4 and then
Stage 3 and 2 of NREM, and finally to the REM state. Each sleep cycle lasts for 90 to 120
minutes.
During the REM sleep period, rapid eye movements occur, fluctuations in breathing
movements and heart-beat become severe, blood pressure rises, and involuntary muscle
jerks (loss of muscular tone) occur. However, the brain is highly active, and an EEG usually
records high frequencies and low amplitudes, similar to those recorded during the awake
state. Vividly recalled dreams mostly occur during REM sleep. There are three to five REM
episodes per night. They occur at the end of each sleep cycle, and are not always constant in
length, ranging from five minutes to over an hour.
NREM sleep is physiologically different from REM sleep, and is dreamless. As the NREM
sleep advances from Stages 1 to 4, the EEG signal shows a slower frequency and a higher
amplitude. Breathing and heart-beat become slower and more regular, the blood pressure
and body temperature decrease, and the subject is relatively still.
About 75%–80% of sleep is NREM sleep, and almost half of the total sleep time is in Stage 2
NREM. REM sleep episodes account for 20%–25% of the total sleep period. The relative
amount of REM sleep varies considerably with age. As age increases, the total sleep time
becomes shorter, leading to shorter NREM sleep, but no significant change in REM sleep. By
contrast, infants spend about half of their sleep time in REM sleep.
Rhythmic alternation of REM and NREM states during sleep is reflected in different
physiological activities, such as eye movement, muscular tone, electroencephalogram,
respiration, heart rate, blood pressure, and body temperature. These features are clinically
discernible in a polysomnogram measured by attaching more than 10 sensors to a subject.
This section describes a method for estimating the cyclic property of sleep based on HR only.
Because variation in HR in the REM state is much larger than that in the NREM state,
variance of the HR was used as a criterion to distinguish between REM and NREM sleep
states.
The windowed local variance (WLV) method is used extensively in image processing for
edge detection and pattern segmentation (Bocher & McCloy, 2006a, 2006b; Law & Chung,
2007). It is defined as the variance computed for pixel values within a window of size w w
from aggregated pixel data.
This study deals with one-dimensional HR data sequences, and defines the WLV
i
at data
point i as shown in Equation (9).
2
2
11
wi
ij
j
wi
ij
ji
x
w
x
w
WLV
, (1)
where w is the window length and x
j
is the input data within the window.
Figure 5 shows the noise-suppressed HR data in the red trace and the estimated result of a
biphasic sleep cycle in the blue trace. The low-level phase indicates the period with lower
HR perturbation, and the high-level phase corresponds to a period with increased HR
fluctuation. Although it is not yet a conclusion that there is a relationship between the REM–
NREM cycle and the estimated biphasic cycle, because no concomitant EEG was recorded, it
is inferred that the low-level phase may imply the NREM state, while the high-level phase
refers to the REM state.
As shown in Figure 5, the period length of the high-level phase gradually increased during
the course of sleep, i.e., it was short at the beginning of the sleep period and longer towards
the end of the sleep period, a behaviour similar to the REM state, although confirmation of
this is required from an EEG.
Discovery of Biorhythmic Stories behind Daily Vital Signs and Its Application 469
We also have the specific forms
R
L
R
L
n
nk
ji
n
nk
kjki
ij
T
kAAAA
, (1)
and
R
L
R
L
n
nk
k
j
n
nk
kkj
j
T
ykyAyA
, (1)
Since the filter coefficient, c
k
, is the component a
0
when y is replaced by the unit vector e
k
,
we have
M
m
m
m
T
k
TT
k
kc
0
0
1
0
1
AAeAAA
, –n
L
≤ k < n
R
, (1)
When the filter coefficient vector c=[c
-nL
,…,c
nR
] was obtained using Equation (8), the signal
shown in the black trace in Figure 4 could be smoothed using Equation (2), and the result is
the red trace shown in Figure 4.
After these two filtering steps, the noise-suppressed HR data were used for the detection of
three different biorhythms, as described in the following three sections.
2.1.3 Sleep cycle estimation
Sleep is clinically classified into two distinct states: the rapid eye movement (REM) state and
the non-rapid eye movement (NREM) state. The NREM state is further divided into four
stages, 1–4, indicating four depths of sleep from shallow to deep. When drifting into sleep, a
normal sleep cycle moves in a sequential progress from Stage 1 through to Stage 4 and then
Stage 3 and 2 of NREM, and finally to the REM state. Each sleep cycle lasts for 90 to 120
minutes.
During the REM sleep period, rapid eye movements occur, fluctuations in breathing
movements and heart-beat become severe, blood pressure rises, and involuntary muscle
jerks (loss of muscular tone) occur. However, the brain is highly active, and an EEG usually
records high frequencies and low amplitudes, similar to those recorded during the awake
state. Vividly recalled dreams mostly occur during REM sleep. There are three to five REM
episodes per night. They occur at the end of each sleep cycle, and are not always constant in
length, ranging from five minutes to over an hour.
NREM sleep is physiologically different from REM sleep, and is dreamless. As the NREM
sleep advances from Stages 1 to 4, the EEG signal shows a slower frequency and a higher
amplitude. Breathing and heart-beat become slower and more regular, the blood pressure
and body temperature decrease, and the subject is relatively still.
About 75%–80% of sleep is NREM sleep, and almost half of the total sleep time is in Stage 2
NREM. REM sleep episodes account for 20%–25% of the total sleep period. The relative
amount of REM sleep varies considerably with age. As age increases, the total sleep time
becomes shorter, leading to shorter NREM sleep, but no significant change in REM sleep. By
contrast, infants spend about half of their sleep time in REM sleep.
Rhythmic alternation of REM and NREM states during sleep is reflected in different
physiological activities, such as eye movement, muscular tone, electroencephalogram,
respiration, heart rate, blood pressure, and body temperature. These features are clinically
discernible in a polysomnogram measured by attaching more than 10 sensors to a subject.
This section describes a method for estimating the cyclic property of sleep based on HR only.
Because variation in HR in the REM state is much larger than that in the NREM state,
variance of the HR was used as a criterion to distinguish between REM and NREM sleep
states.
The windowed local variance (WLV) method is used extensively in image processing for
edge detection and pattern segmentation (Bocher & McCloy, 2006a, 2006b; Law & Chung,
2007). It is defined as the variance computed for pixel values within a window of size w w
from aggregated pixel data.
This study deals with one-dimensional HR data sequences, and defines the WLV
i
at data
point i as shown in Equation (9).
2
2
11
wi
ij
j
wi
ij
ji
x
w
x
w
WLV
, (1)
where w is the window length and x
j
is the input data within the window.
Figure 5 shows the noise-suppressed HR data in the red trace and the estimated result of a
biphasic sleep cycle in the blue trace. The low-level phase indicates the period with lower
HR perturbation, and the high-level phase corresponds to a period with increased HR
fluctuation. Although it is not yet a conclusion that there is a relationship between the REM–
NREM cycle and the estimated biphasic cycle, because no concomitant EEG was recorded, it
is inferred that the low-level phase may imply the NREM state, while the high-level phase
refers to the REM state.
As shown in Figure 5, the period length of the high-level phase gradually increased during
the course of sleep, i.e., it was short at the beginning of the sleep period and longer towards
the end of the sleep period, a behaviour similar to the REM state, although confirmation of
this is required from an EEG.
Recent Advances in Biomedical Engineering470
0
1
2
3
4
5
6
7
8
40
45
50
55
60
65
70
75
80
85
90
0:00:00 1:00:00 2:00:00 3:00:00 4:00:00 5:00:00 6:00:00 7:00:00
Sleep status (-)
HR (bpm)
Time (hh:mm:ss)
HR Estimated Sleep Cycle
Fig. 5. HR profile of a single night’s sleep and the estimated sleep cycle. Data were collected
from a male student in his twenties. The red line is the profile of the noise-suppressed HR.
The blue line is the estimated sleep cycle, in which the low-level phase indicates the period
with low HR perturbation, and the high-level phase corresponds to the period with more
HR fluctuations.
2.1.4 Detection of changes in daily behaviour
Because biorhythms are affected by endogenous and exogenous factors, any change in daily
behavioural patterns can be reflected in biorhythmic changes. This study demonstrates the
detection of behavioural changes during waking hours by applying the dynamic time
warping (DTW) method to the HR data collected during sleep (Watanabe & Chen, 2009).
DTW is an algorithm used to measure the similarity between two data sequences that may
differ in length. Well-known applications are in fields such as speech recognition and
walking analysis, in which data sequences in either case generally vary in temporal span
and rhythmic tempo.
The aim of DTW is to find the optimal alignment between two given data sequences under
given criteria. Consider two given data sequences with variable length, the reference pattern
R={r
1
, ,r
M
} with data length M, and the test pattern T={t
1
, ,t
N
} with data length N, as shown
in Figure 6. The value of each black dot d
ij
indicates the difference (distance) between the
reference pattern data r
i
and test pattern data t
j
, as described by Equation (10).
22
iiij
trjid , i=1, 2,…, M; j=1, 2,…, N , (10)
Thus, a two-dimensional N M distance matrix, D
N×M
, is constructed where the element d
ij
is the distance between the ith data in the reference pattern and the jth data in the test
pattern.
As a similarity measure, the shortest path from the start (the lower left-hand corner of the
distance matrix) to the end (the upper right-hand corner of the distance matrix) of the data
sequence must exist among multiple possible paths.
The shortest path is determined using the forward dynamic programming approach with a
monotonicity constraint.
kijk
jk
ij
PdP
,1
min
, (1)
Here, P
ij
denotes the distance from the ith and jth data node to the terminating node.
The overall minimum distance, D(T, R), used as the similarity measure for two patterns (a
smaller distance value indicates a higher similarity) is determined from
11
, PRTD
, (1)
The Sleep Index (SI) is obtained by normalizing D(T, R) between the values of 0 and 1, as
below:
minmaxmin
/, DDDRTDSI
, (1)
where D
min
and D
max
indicate the minimum and maximum similarity values, respectively.
The smaller the SI value, the more regular the sleep is.
Fig. 6. The minimum distance trace (red line) from the beginning to the end of two data
sequences. The black dot indicates the distance between the ith data in the reference pattern
and the jth data in the test pattern. The value of the minimum distance, D(T, R), is the sum
of all the black dots along the red line, and indicates the similarity between the two patterns.
The smaller the value of D(T, R), then the greater the similarity is between the two patterns.
All the data in the two data sequences were calculated to build a two-dimensional N M
distance matrix. Because the endpoint had constraints, the grey-coloured dots can be
ignored.
Discovery of Biorhythmic Stories behind Daily Vital Signs and Its Application 471
0
1
2
3
4
5
6
7
8
40
45
50
55
60
65
70
75
80
85
90
0:00:00 1:00:00 2:00:00 3:00:00 4:00:00 5:00:00 6:00:00 7:00:00
Sleep status (-)
HR (bpm)
Time (hh:mm:ss)
HR Estimated Sleep Cycle
Fig. 5. HR profile of a single night’s sleep and the estimated sleep cycle. Data were collected
from a male student in his twenties. The red line is the profile of the noise-suppressed HR.
The blue line is the estimated sleep cycle, in which the low-level phase indicates the period
with low HR perturbation, and the high-level phase corresponds to the period with more
HR fluctuations.
2.1.4 Detection of changes in daily behaviour
Because biorhythms are affected by endogenous and exogenous factors, any change in daily
behavioural patterns can be reflected in biorhythmic changes. This study demonstrates the
detection of behavioural changes during waking hours by applying the dynamic time
warping (DTW) method to the HR data collected during sleep (Watanabe & Chen, 2009).
DTW is an algorithm used to measure the similarity between two data sequences that may
differ in length. Well-known applications are in fields such as speech recognition and
walking analysis, in which data sequences in either case generally vary in temporal span
and rhythmic tempo.
The aim of DTW is to find the optimal alignment between two given data sequences under
given criteria. Consider two given data sequences with variable length, the reference pattern
R={r
1
, ,r
M
} with data length M, and the test pattern T={t
1
, ,t
N
} with data length N, as shown
in Figure 6. The value of each black dot d
ij
indicates the difference (distance) between the
reference pattern data r
i
and test pattern data t
j
, as described by Equation (10).
22
iiij
trjid , i=1, 2,…, M; j=1, 2,…, N , (10)
Thus, a two-dimensional N M distance matrix, D
N×M
, is constructed where the element d
ij
is the distance between the ith data in the reference pattern and the jth data in the test
pattern.
As a similarity measure, the shortest path from the start (the lower left-hand corner of the
distance matrix) to the end (the upper right-hand corner of the distance matrix) of the data
sequence must exist among multiple possible paths.
The shortest path is determined using the forward dynamic programming approach with a
monotonicity constraint.
kijk
jk
ij
PdP
,1
min
, (1)
Here, P
ij
denotes the distance from the ith and jth data node to the terminating node.
The overall minimum distance, D(T, R), used as the similarity measure for two patterns (a
smaller distance value indicates a higher similarity) is determined from
11
, PRTD , (1)
The Sleep Index (SI) is obtained by normalizing D(T, R) between the values of 0 and 1, as
below:
minmaxmin
/, DDDRTDSI
, (1)
where D
min
and D
max
indicate the minimum and maximum similarity values, respectively.
The smaller the SI value, the more regular the sleep is.
Fig. 6. The minimum distance trace (red line) from the beginning to the end of two data
sequences. The black dot indicates the distance between the ith data in the reference pattern
and the jth data in the test pattern. The value of the minimum distance, D(T, R), is the sum
of all the black dots along the red line, and indicates the similarity between the two patterns.
The smaller the value of D(T, R), then the greater the similarity is between the two patterns.
All the data in the two data sequences were calculated to build a two-dimensional N M
distance matrix. Because the endpoint had constraints, the grey-coloured dots can be
ignored.
Recent Advances in Biomedical Engineering472
The reference pattern was created by selecting one week’s usual sleep data, and averaging
these daily HR profiles after noise suppression and data length unification. The daily SI
value was calculated using the daily HR profile and the reference pattern. The smaller the SI
value, the greater the similarity was between the daily pattern and the reference pattern.
Figure 7 shows the variation in the SI value over a period of seven weeks. SI values less than
0.6 indicate that daily sleep was relatively stable, but three days had SI values above 0.6.
These three days were confirmed as coinciding with daily life behavioural changes, or heavy
drinking in year-end and New Year parties. The HR data showed an increase as a whole and
a marked variation pattern over these three days, suggesting that perhaps the use of alcohol
stimulated the sympathetic nervous system and accelerated the heart-beat.
0.0
0.2
0.4
0.6
0.8
1.0
1.2
11/28 12/5 12/12 12/19 12/26 1/2 1/9
Sleep Index (-)
Date(mm/dd)
Fig. 7. Variation in SI over a period of seven weeks. The SI value was calculated using the
DTW method from HR data collected from a male student in his twenties. The lower the
value of the bar, the higher the similarity was, which in turn implies usual daily behaviour.
The three higher red bars, whose values are greater than 0.6, indicate the days when the
subject had a heavy intake of alcohol.
2.1.5 Estimation of the menstrual cycle
The menstrual cycle is usually estimated from the oral basal body temperature (BBT) in
clinical practice. However, taking daily oral measurements is inconvenient for most women.
By contrast, there are many convenient ways to measure HR. This study investigated
whether the variation in HR measured during sleep could reveal menstrual rhythmicity, as
oral BBT does.
The menstrual cycle was estimated by following three steps: calculation of the HR statistic
profile, preprocessing of the profile, and analysis of the profile rhythmicity.
Date(mm/dd)
The first step was to calculate the daily HR mode value (most frequent value) from the
noise-suppressed HR data over a single night, i.e., more than 20,000 HR data points during a
6–7-hour sleep episode. The second step had two tasks: (i) to smooth the daily HR mode
profile using a Savitzky–Golay filter, and (ii) to remove any ultra-slow baseline deviations
(which may imply seasonal biorhythmic changes and remain to be studied further in detail)
using a multirate filtering approach. The final step was to estimate the rhythmicity from the
detrended profile of the daily HR mode value using the cosinor analysis method.
The cosinor analysis method is often used to estimate biorhythms with regular cycle length
from biological time series data (Nelson et al., 1979). Our aim was to look for the optimal
parameter set (M, A,
,
) to represent the measured data using a cosine function, as shown
in Equation (14)
ii
tAMtf cos , (1)
where t
i
represents the time of measurement of the ith data, M is the mean level (Midline
Estimating Statistic Of Rhythm (MESOR)) of the cosine curve, A is the amplitude of the
function,
is the angular frequency (reciprocal of the cycle length) of the curve, and
is the
acrophase (horizontal shift) of the curve.
Considering the measurement of y
i
to be the sum of f(t
i
) at time t
i
and the residual error
i
iii
tAMy
cos , (1)
The errors
i
were assumed to be independent and normally distributed with a zero mean
value and a common residual variance,
2
.
The task was to find the optimal parameter set (M, A,
,
) that best fitted the measurement
data y
i
using Equation (15), and could be realized using the least-squares regression method.
Equation (15) was rewritten as below.
iiii
tAtAMy
sinsincoscos , (1)
Assigning surrogate parameters (
,
), we obtain
cosA
and
sinA
, (1)
ii
tx
cos
and
ii
tz
sin
, (1)
Substituting Equations (17) and (18) into Equation (16), we get
iiii
zxMy
, (1)
Supposing
in Equation (18) has been suggested previously, and y
i
in Equation (19)
becomes a linear equation of M,
, and
. Once M,
, and
are calculated by applying the
least-squares method to Equation (19), the optimal parameter set (M,
,
) can be obtained.
The residual sum of squared (RSS) error is
n
i
iii
zxMyRSS
1
2
, (1)
where n is the data length.
To minimize the value of RSS, Equation (20) is partially differentiated with respect to M,
,
and
. The following normal simultaneous equations can be established.
Discovery of Biorhythmic Stories behind Daily Vital Signs and Its Application 473
The reference pattern was created by selecting one week’s usual sleep data, and averaging
these daily HR profiles after noise suppression and data length unification. The daily SI
value was calculated using the daily HR profile and the reference pattern. The smaller the SI
value, the greater the similarity was between the daily pattern and the reference pattern.
Figure 7 shows the variation in the SI value over a period of seven weeks. SI values less than
0.6 indicate that daily sleep was relatively stable, but three days had SI values above 0.6.
These three days were confirmed as coinciding with daily life behavioural changes, or heavy
drinking in year-end and New Year parties. The HR data showed an increase as a whole and
a marked variation pattern over these three days, suggesting that perhaps the use of alcohol
stimulated the sympathetic nervous system and accelerated the heart-beat.
0.0
0.2
0.4
0.6
0.8
1.0
1.2
11/28 12/5 12/12 12/19 12/26 1/2 1/9
Sleep Index (-)
Date(mm/dd)
Fig. 7. Variation in SI over a period of seven weeks. The SI value was calculated using the
DTW method from HR data collected from a male student in his twenties. The lower the
value of the bar, the higher the similarity was, which in turn implies usual daily behaviour.
The three higher red bars, whose values are greater than 0.6, indicate the days when the
subject had a heavy intake of alcohol.
2.1.5 Estimation of the menstrual cycle
The menstrual cycle is usually estimated from the oral basal body temperature (BBT) in
clinical practice. However, taking daily oral measurements is inconvenient for most women.
By contrast, there are many convenient ways to measure HR. This study investigated
whether the variation in HR measured during sleep could reveal menstrual rhythmicity, as
oral BBT does.
The menstrual cycle was estimated by following three steps: calculation of the HR statistic
profile, preprocessing of the profile, and analysis of the profile rhythmicity.
Date(mm/dd)
The first step was to calculate the daily HR mode value (most frequent value) from the
noise-suppressed HR data over a single night, i.e., more than 20,000 HR data points during a
6–7-hour sleep episode. The second step had two tasks: (i) to smooth the daily HR mode
profile using a Savitzky–Golay filter, and (ii) to remove any ultra-slow baseline deviations
(which may imply seasonal biorhythmic changes and remain to be studied further in detail)
using a multirate filtering approach. The final step was to estimate the rhythmicity from the
detrended profile of the daily HR mode value using the cosinor analysis method.
The cosinor analysis method is often used to estimate biorhythms with regular cycle length
from biological time series data (Nelson et al., 1979). Our aim was to look for the optimal
parameter set (M, A,
,
) to represent the measured data using a cosine function, as shown
in Equation (14)
ii
tAMtf cos , (1)
where t
i
represents the time of measurement of the ith data, M is the mean level (Midline
Estimating Statistic Of Rhythm (MESOR)) of the cosine curve, A is the amplitude of the
function,
is the angular frequency (reciprocal of the cycle length) of the curve, and
is the
acrophase (horizontal shift) of the curve.
Considering the measurement of y
i
to be the sum of f(t
i
) at time t
i
and the residual error
i
iii
tAMy
cos , (1)
The errors
i
were assumed to be independent and normally distributed with a zero mean
value and a common residual variance,
2
.
The task was to find the optimal parameter set (M, A,
,
) that best fitted the measurement
data y
i
using Equation (15), and could be realized using the least-squares regression method.
Equation (15) was rewritten as below.
iiii
tAtAMy
sinsincoscos , (1)
Assigning surrogate parameters (
,
), we obtain
cosA
and
sinA
, (1)
ii
tx
cos
and
ii
tz
sin
, (1)
Substituting Equations (17) and (18) into Equation (16), we get
iiii
zxMy
, (1)
Supposing
in Equation (18) has been suggested previously, and y
i
in Equation (19)
becomes a linear equation of M,
, and
. Once M,
, and
are calculated by applying the
least-squares method to Equation (19), the optimal parameter set (M,
,
) can be obtained.
The residual sum of squared (RSS) error is
n
i
iii
zxMyRSS
1
2
, (1)
where n is the data length.
To minimize the value of RSS, Equation (20) is partially differentiated with respect to M,
,
and
. The following normal simultaneous equations can be established.
Recent Advances in Biomedical Engineering474
n
i
ii
n
i
i
n
i
ii
n
i
i
n
i
ii
n
i
ii
n
i
i
n
i
i
n
i
i
n
i
i
n
i
i
yzzzxMz
yxzxxMx
yzxnM
11
2
11
111
2
1
111
, (1)
After the parameter set (M,
,
) is derived from the simultaneous equations (21), the value
of RSS can be calculated using Equation (20). The values of A and
can be calculated using
Equation (17) as below:
22
A , (1)
arctan , (1)
Because the value of RSS depends on the proposed value of
, the optimal value of
, which
has the minimum value of RSS, is chosen as the estimated cycle length.
Figure 8 shows the HR mode value and standard deviation profiles over a period of six
months (upper subplot), and the menstrual cycle estimation procedure (lower subplot).
The HR data were collected from a female subject in her thirties during daily sleep from 8
October to 31 March. The data collection rate was 93.2% (i.e., 164 days collected out of a total
176-day period). The starting dates of the subject’s menstruation were recorded by the
subject as 15 October, 12 November, 9 December, 7 January, 5 February, 3 March, and 30
March. Each menstrual cycle over the six-month period could be deduced as being 28, 27, 29,
29, 26, and 27 days, respectively, and the average length the standard deviation of the self-
recorded menstrual cycles was 27.7 1.2 days.
The daily HR mode value and standard deviation were calculated from more than 20,000
HR data points during the 6–7-hour measurements of a single night’s sleep episode. As
shown in the upper subplot of Figure 8, the fluctuation of the raw HR mode value profile
(MVP) shows no apparent regularity along the time axis.
The lower subplot shows the smoothed HR MVP data (bold blue line) obtained by applying
the Savitzky–Golay smoothing filter to the raw HR MVP data. A slow wandering baseline in
the smoothed HR MVP data was extracted using the multirate filter and subtracted from the
smoothed HR MVP data to produce the detrended HR MVP data (dotted black line). The
cosinor analysis method was used to calculate the best approximation (bold red line) of the
detrended HR MVP data and to obtain the best-fitted menstrual cycle length of 24.9 days.
This compares with the average self-recorded menstrual cycle length of 27.7 days, i.e., the
mathematically estimated menstrual length induced an estimation error of 10.1%. It was
observed that the timing of the self-recorded menstruation starting dates corresponded to
the decrease phase in HR MVP data approximately, a similar characteristic which is shown
in BBT biphasic data.
Fig. 8. HR mode value and standard deviation profiles (upper subplot), and menstrual cycle
estimation procedure (lower subplot). Data are plotted based on the day-by-day data along
the x-axis. The y-axis denotes HR in units of bpm. In the upper subplot, the data markers
“o” and vertical bars “|”, terminated at the upper and lower ends by short horizontal lines
“-”, show the mode values (most frequent values) and standard deviation of the HR data in
daily sleep episodes. Some sporadic discontinuities can be seen, as no data were collected
during those days. In the lower subplot, the bold blue line shows the smoothed profile of the
daily HR mode values, and the black dotted line shows the detrended result of the
smoothed HR mode values. The red line is the cosinor-fitted results of the black dotted line.
Red circles denote the menstruation starting dates that were self-recorded by the subject.
The cosinor analysis method does not require that the data be sampled at equal intervals,
and it also tolerates incidents of missing data. It provides an accessible means of estimating
the periodic property of menstrual cycles. However, the cosinor analysis method postulates
that the data should be reasonably represented in a deterministic cyclic form with a constant
period. This prerequisite makes it unsuitable for those women with irregular menstrual
cycles. To deal with irregular cycle cases, a hidden Markov model (HMM)-based method is
presented in the next section.
Discovery of Biorhythmic Stories behind Daily Vital Signs and Its Application 475
n
i
ii
n
i
i
n
i
ii
n
i
i
n
i
ii
n
i
ii
n
i
i
n
i
i
n
i
i
n
i
i
n
i
i
yzzzxMz
yxzxxMx
yzxnM
11
2
11
111
2
1
111
, (1)
After the parameter set (M,
,
) is derived from the simultaneous equations (21), the value
of RSS can be calculated using Equation (20). The values of A and
can be calculated using
Equation (17) as below:
22
A , (1)
arctan , (1)
Because the value of RSS depends on the proposed value of
, the optimal value of
, which
has the minimum value of RSS, is chosen as the estimated cycle length.
Figure 8 shows the HR mode value and standard deviation profiles over a period of six
months (upper subplot), and the menstrual cycle estimation procedure (lower subplot).
The HR data were collected from a female subject in her thirties during daily sleep from 8
October to 31 March. The data collection rate was 93.2% (i.e., 164 days collected out of a total
176-day period). The starting dates of the subject’s menstruation were recorded by the
subject as 15 October, 12 November, 9 December, 7 January, 5 February, 3 March, and 30
March. Each menstrual cycle over the six-month period could be deduced as being 28, 27, 29,
29, 26, and 27 days, respectively, and the average length the standard deviation of the self-
recorded menstrual cycles was 27.7 1.2 days.
The daily HR mode value and standard deviation were calculated from more than 20,000
HR data points during the 6–7-hour measurements of a single night’s sleep episode. As
shown in the upper subplot of Figure 8, the fluctuation of the raw HR mode value profile
(MVP) shows no apparent regularity along the time axis.
The lower subplot shows the smoothed HR MVP data (bold blue line) obtained by applying
the Savitzky–Golay smoothing filter to the raw HR MVP data. A slow wandering baseline in
the smoothed HR MVP data was extracted using the multirate filter and subtracted from the
smoothed HR MVP data to produce the detrended HR MVP data (dotted black line). The
cosinor analysis method was used to calculate the best approximation (bold red line) of the
detrended HR MVP data and to obtain the best-fitted menstrual cycle length of 24.9 days.
This compares with the average self-recorded menstrual cycle length of 27.7 days, i.e., the
mathematically estimated menstrual length induced an estimation error of 10.1%. It was
observed that the timing of the self-recorded menstruation starting dates corresponded to
the decrease phase in HR MVP data approximately, a similar characteristic which is shown
in BBT biphasic data.
Fig. 8. HR mode value and standard deviation profiles (upper subplot), and menstrual cycle
estimation procedure (lower subplot). Data are plotted based on the day-by-day data along
the x-axis. The y-axis denotes HR in units of bpm. In the upper subplot, the data markers
“o” and vertical bars “|”, terminated at the upper and lower ends by short horizontal lines
“-”, show the mode values (most frequent values) and standard deviation of the HR data in
daily sleep episodes. Some sporadic discontinuities can be seen, as no data were collected
during those days. In the lower subplot, the bold blue line shows the smoothed profile of the
daily HR mode values, and the black dotted line shows the detrended result of the
smoothed HR mode values. The red line is the cosinor-fitted results of the black dotted line.
Red circles denote the menstruation starting dates that were self-recorded by the subject.
The cosinor analysis method does not require that the data be sampled at equal intervals,
and it also tolerates incidents of missing data. It provides an accessible means of estimating
the periodic property of menstrual cycles. However, the cosinor analysis method postulates
that the data should be reasonably represented in a deterministic cyclic form with a constant
period. This prerequisite makes it unsuitable for those women with irregular menstrual
cycles. To deal with irregular cycle cases, a hidden Markov model (HMM)-based method is
presented in the next section.
Recent Advances in Biomedical Engineering476
2.2 Discovery of a single biorhythm from multiple vital signs
This section describes the estimation of a biphasic property, indicating ovulation and
menstruation periods, in female menstrual cycles by applying the HMM method to three
types of body temperature data: the oral basal body temperature (BBT), the skin body
temperature (SBT), and the core body temperature (CBT).
Menstrual cycle dynamics, from ovum production to development, maturation, release, and
fertilization, are one of the most important mechanisms in maintaining female mental and
physical well-being, as well as reproductive function. This cyclic phenomenon is marked by
changes in several physiological and hormonal signs. Throughout the menstrual cycle,
changes occur in a variety of hormones, such as the luteinizing, follicle stimulating,
progestational (luteal), and oestrogen (follicular) hormones, as shown in Figure 9. These
changes are known to be reflected by changes in BBT measurements or in the chemical
composition of the urinary metabolites of oestrogen and progesterone, cervical mucus, and
saliva (Sund-Levander et al., 2002).
0
10
20
30
40
50
60
36.20
36.30
36.40
36.50
36.60
36.70
36.80
36.90
37.00
-4 -2 0 2 4 6 8 10 12 14 16 18 20 22 24 26 28 30 32
Hormone change (%)
BBT (℃)
Date
BBT
LH
FSH
LTH
FH
Menstruation period
Ovulation period
Fig. 9. Biphasic profile of the basal body temperature (BBT) and related hormone changes
during a menstrual cycle. LH and LTH are the luteinizing hormone and luteal hormone,
respectively, and FH and FSH are the follicular hormone and follicle-stimulating hormone,
respectively. The menstruation period is indicated by the red dots, and ovulation day is
marked by the pink circle. During the ovulation period, the surge in LH triggers the release
of the ovum. If there is no chance of fertilization occurring within a period of one day, the
ovum will shrink and form lutein cells. The concentration of LTH will increase and lead to a
rise in BBT.
It is possible to correlate hormonal secretion with changes in the genital tissues during a
normal menstrual cycle by employing modern bioassay techniques. Three different methods
(biological, biochemical, and biophysical) have been developed to elucidate the cyclic
properties of ovulation day and the menstruation period during menstrual cycles (Collins,
1982). Urine and cervical mucus examination methods require chemical reagents and a
complicated operation. The salivary method is vulnerable to influence from alcohol, smoke,
and food. Cervical mucus and BBT are reported to be the most readily observable
parameters among several physiological and hormonal signs (Owen, 1975; Royston, 1982).
Studies on the cause of body temperature changes in women, including BBT, CBT, and
rectal temperature, can be traced back to the 1930s (Davis & Fugo, 1948; Lee, 1988; Zuck,
1938). Changes in body temperature, from lower to higher or vice versa, are indicative of the
hormonal changes that lead to ovulation and menstruation. Because the BBT method only
requires regular oral temperature measurements immediately following sleep, it is now
widely accepted as a practical method for estimating the menstrual cycle. However, as BBT
measurements are easily affected by any phlogistic illness, such as influenza or toothache,
the biphasic property is often ambiguous, and it is difficult to decide the transition points
from the temperature profile by visual observation. Therefore, the result largely depends on
individual knowledge and a subjective judgement. Extreme caution is required in the
interpretation of BBT data when evaluating menstrual cycle dynamics (Baker & Driver,
2007; Moghissi, 1980).
The aims of this study were twofold. The first was to examine whether an HMM-based
method was applicable for estimating the biphasic property of menstrual cycles. The second
was to investigate whether the same biorhythmic story can be told by different forms of
body temperature data, which are measured at different times, at different sites, and using
different techniques.
2.2.1 Data collection
Three forms of body temperature data were collected from each subject. As shown in Figure
10, both the SBT and the CBT were collected automatically by attaching two sensor devices
(QOL Co. Ltd, 2009) on two sides of a drawers strap during sleep.
The SBT device (orange ellipse in Figure 10) was programmed to measure the skin body
temperature at 10-minute intervals from midnight to 6:00 a.m. Measurement outliers above
40 C or below 32 C due to poor contact or movement artefacts were automatically
disregarded. In the end, 37 data points at most can be collected during a six-hour period.
The collected temperature data were encoded as a two-dimensional bar code, known as a
“Quick Response” (QR) code (Denso Wave Inc., 2009) and displayed on an LCD window. A
mobile phone built-in camera was used to capture the QR code image (Figure 10 (a)) on the
device display (middle cycle). Once the QR code was captured on the mobile phone (Figure
10 (b)), the original temperature data (Figure 10 (c)) were recovered from the captured
image and transmitted to a database server via HTTP protocol through a mobile network for
data storage and analysis.
The CBT device (black cube in Figure 10) was developed using the zero-heat-flow principle
(Kobayashi et al., 1975; Togawa, 1985; Nemoto & Togawa, 1988; Yamakage & Namiki, 2003).
The device measured the deep tissue temperature at four-minute intervals following the
first reading, which was obtained 90 minutes after the device was switched on. This was to
ensure that the heat flow was balanced. The CBT data were collected using the electro-
magnetic coupling method employing a docking station connected to a PC via an RS232
interface.
Discovery of Biorhythmic Stories behind Daily Vital Signs and Its Application 477
2.2 Discovery of a single biorhythm from multiple vital signs
This section describes the estimation of a biphasic property, indicating ovulation and
menstruation periods, in female menstrual cycles by applying the HMM method to three
types of body temperature data: the oral basal body temperature (BBT), the skin body
temperature (SBT), and the core body temperature (CBT).
Menstrual cycle dynamics, from ovum production to development, maturation, release, and
fertilization, are one of the most important mechanisms in maintaining female mental and
physical well-being, as well as reproductive function. This cyclic phenomenon is marked by
changes in several physiological and hormonal signs. Throughout the menstrual cycle,
changes occur in a variety of hormones, such as the luteinizing, follicle stimulating,
progestational (luteal), and oestrogen (follicular) hormones, as shown in Figure 9. These
changes are known to be reflected by changes in BBT measurements or in the chemical
composition of the urinary metabolites of oestrogen and progesterone, cervical mucus, and
saliva (Sund-Levander et al., 2002).
0
10
20
30
40
50
60
36.20
36.30
36.40
36.50
36.60
36.70
36.80
36.90
37.00
-4 -2 0 2 4 6 8 10 12 14 16 18 20 22 24 26 28 30 32
Hormone change (%)
BBT (℃)
Date
BBT
LH
FSH
LTH
FH
Menstruation period
Ovulation period
Fig. 9. Biphasic profile of the basal body temperature (BBT) and related hormone changes
during a menstrual cycle. LH and LTH are the luteinizing hormone and luteal hormone,
respectively, and FH and FSH are the follicular hormone and follicle-stimulating hormone,
respectively. The menstruation period is indicated by the red dots, and ovulation day is
marked by the pink circle. During the ovulation period, the surge in LH triggers the release
of the ovum. If there is no chance of fertilization occurring within a period of one day, the
ovum will shrink and form lutein cells. The concentration of LTH will increase and lead to a
rise in BBT.
It is possible to correlate hormonal secretion with changes in the genital tissues during a
normal menstrual cycle by employing modern bioassay techniques. Three different methods
(biological, biochemical, and biophysical) have been developed to elucidate the cyclic
properties of ovulation day and the menstruation period during menstrual cycles (Collins,
1982). Urine and cervical mucus examination methods require chemical reagents and a
complicated operation. The salivary method is vulnerable to influence from alcohol, smoke,
and food. Cervical mucus and BBT are reported to be the most readily observable
parameters among several physiological and hormonal signs (Owen, 1975; Royston, 1982).
Studies on the cause of body temperature changes in women, including BBT, CBT, and
rectal temperature, can be traced back to the 1930s (Davis & Fugo, 1948; Lee, 1988; Zuck,
1938). Changes in body temperature, from lower to higher or vice versa, are indicative of the
hormonal changes that lead to ovulation and menstruation. Because the BBT method only
requires regular oral temperature measurements immediately following sleep, it is now
widely accepted as a practical method for estimating the menstrual cycle. However, as BBT
measurements are easily affected by any phlogistic illness, such as influenza or toothache,
the biphasic property is often ambiguous, and it is difficult to decide the transition points
from the temperature profile by visual observation. Therefore, the result largely depends on
individual knowledge and a subjective judgement. Extreme caution is required in the
interpretation of BBT data when evaluating menstrual cycle dynamics (Baker & Driver,
2007; Moghissi, 1980).
The aims of this study were twofold. The first was to examine whether an HMM-based
method was applicable for estimating the biphasic property of menstrual cycles. The second
was to investigate whether the same biorhythmic story can be told by different forms of
body temperature data, which are measured at different times, at different sites, and using
different techniques.
2.2.1 Data collection
Three forms of body temperature data were collected from each subject. As shown in Figure
10, both the SBT and the CBT were collected automatically by attaching two sensor devices
(QOL Co. Ltd, 2009) on two sides of a drawers strap during sleep.
The SBT device (orange ellipse in Figure 10) was programmed to measure the skin body
temperature at 10-minute intervals from midnight to 6:00 a.m. Measurement outliers above
40 C or below 32 C due to poor contact or movement artefacts were automatically
disregarded. In the end, 37 data points at most can be collected during a six-hour period.
The collected temperature data were encoded as a two-dimensional bar code, known as a
“Quick Response” (QR) code (Denso Wave Inc., 2009) and displayed on an LCD window. A
mobile phone built-in camera was used to capture the QR code image (Figure 10 (a)) on the
device display (middle cycle). Once the QR code was captured on the mobile phone (Figure
10 (b)), the original temperature data (Figure 10 (c)) were recovered from the captured
image and transmitted to a database server via HTTP protocol through a mobile network for
data storage and analysis.
The CBT device (black cube in Figure 10) was developed using the zero-heat-flow principle
(Kobayashi et al., 1975; Togawa, 1985; Nemoto & Togawa, 1988; Yamakage & Namiki, 2003).
The device measured the deep tissue temperature at four-minute intervals following the
first reading, which was obtained 90 minutes after the device was switched on. This was to
ensure that the heat flow was balanced. The CBT data were collected using the electro-
magnetic coupling method employing a docking station connected to a PC via an RS232
interface.