saigon hotel corporation
Bạn đang xem bản rút gọn của tài liệu. Xem và tải ngay bản đầy đủ của tài liệu tại đây (1.03 MB, 29 trang )
<span class="text_page_counter">Trang 1</span><div class="page_container" data-page="1">
TRƯỜNG ĐẠI HỌC FPT - THÀNH PHỐ HỒ CHÍ MINH
<b>REPORT GROUP ASSIGNMENT</b>
<b>ACC101- ACCOUNTING PRINCIPLES</b>
<b>FINANCIAL INDEX ANALYSIS</b>
Class: ACC101_3W Group: No Idea
No Name of group member Student ID Contribution ( 100% )
</div><span class="text_page_counter">Trang 2</span><div class="page_container" data-page="2">
<b>TABLE OF CONTENT</b>
<b>I. INTRODUCTION__________________________________________________3 </b>
1. Saigon Hotel Corporation
2. Dam Sen Water Park Corporation (DASECO)
3. Dong A Construction Investment and Trading Joint Stock Company
<b>II. DATA ANALYSIS_________________________________________________4 i. Saigon Hotel Corporation</b>
<b>III. GENERAL ASSESSMENTS_______________________________________21</b>
I. CRITERIA FOR ABILITY TO PAY. II. PERFORMANCE INDICATORS. III. PROFITABILITY CRITERIA.
IV. THE INDEX REFLECTS THE FINANCIAL STRUCTURE AND ASSET STRUCTURE.
<b>IV. APPENDIX_____________________________________________________27 V. REFERENCES___________________________________________________28 </b>
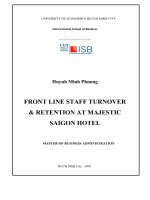
</div><span class="text_page_counter">Trang 3</span><div class="page_container" data-page="3"><b>I.INTRODUCTION1. Saigon Hotel Corporation</b>
- With a history of over 50 years, Saigon Hotel is a long-standing hotel in Ho Chi MinhCity. Saigon Hotel Corporation is a company based in Vietnam that operates in the hotel industry.
- The company manages a hotel in Ho Chi Minh City, Vietnam, to provide accommodation and resort services for tourists.
- The company also offers office space for rent, operates restaurants, and provides domestic and international travel services.
- The company provides passenger transportation services by road, laundry services, karaoke services, massage services, and other entertainment services.
- Additionally, the company is involved in the wine and tobacco business.
<b>2. Dam Sen Water Park Corporation (DASECO)</b>
- Dam Sen Water Park Corporation is a Vietnam-based company that operates in the resort and entertainment industry. The company engages in the business of Dam Sen Water Park, which includes a water park and a dinosaur park.
- The company also operates two full-service restaurants and three fast-food restaurantswithin Dam Sen Water Park.
- Other services provided include swimwear rental, photography services, and advertising services. Additionally, the company sells souvenir items.
- In the fiscal year ending on December 31, 2012, 72.29% of the company's revenue came from operating the water park and dinosaur park. As of December 31, 2012, the company was an affiliate of Phu Tho Tourism Services Limited Liability Company.
<b>3.Dong A Construction Investment and Trading Joint Stock Company</b>
- Dong A Construction Investment and Trading Joint Stock Company known as Dong A Hotel Group Joint Stock Company is a company based in Vietnam primarily engaged in the hotel industry.
- The main business activities of the company include operating accommodation establishments such as resorts and hotels, leasing offices, exhibition halls, conference venues, and tennis courts.
- The company also manages restaurants, bars, and drinking establishments, as well as provides tour services.
- Additionally, the company distributes goods through supermarkets and grocery stores,engages in wholesale and retail trade of construction materials, constructs commercialbuildings, and offers architectural services.
</div><span class="text_page_counter">Trang 4</span><div class="page_container" data-page="4"><b>II.DATA ANALYSISi. Saigon Hotel Corporation</b>
<b>1. Overview</b>
Address: No. 41-47 Dong Du - Ben Nghe Ward - District 1 - HCMCTax code: 0300850255
Stock code: SGHPhone: (84.28) 3829 9734Fax: (84.28) 3829 1466Email: : Https://saigonhotel.com.vn
Established: 1968
<b>2. Index analysis in ( 2018 / 2019 /2020 / 2021 / 2022)2.1. Debt to assets ratio </b>
<b>Result: The fluctuation in the debt to assets ratio suggests a dynamic financial strategy by Saigon </b>
Hotel. A decreasing ratio may indicate a conservative financial approach, while an increasing ratio could imply a more aggressive strategy with higher financial leverage. It's important to consider industry benchmarks and specific business circumstances when interpreting these changes. Additionally, monitoring trends in subsequent years can provide a more comprehensive understandingof the company's financial management.
</div><span class="text_page_counter">Trang 5</span><div class="page_container" data-page="5">financial performance over the years. The drop in 2020 might ave been a challenging period, but the hsubsequent increase in 2022 is a positive sign. Further analysis, such as understanding the factors influencing these changes and comparing them with industry benchmarks, can provide a more comprehensive assessment of Saigon Hotel's financial health.
<b>2.3. Gross margin ratio </b>
<b>Result:The significant drop in 2020 and subsequent recovery in 2022 warrant further investigation </b>
into the factors influencing the cost structure, production efficiency, and overall financial health of Saigon Hotel during these periods. Understanding the reasons behind these changes can provide valuable insights into the company's operational dynamics and strategic decisions.
<b>Result: Overall, the analysis of inventory turnover indicates fluctuations over the years, with the </b>
highest turnover occurring in 2022. Understanding the reasons behind these changes, such as shifts in consumer behavior, market dynamics, or supply chain improvements, can provide valuable insights into Saigon Hotel's operational efficiency and adaptability to market conditions.
<b>2.5. Day's sale in inventory</b>
Currency unit: VND
</div><span class="text_page_counter">Trang 6</span><div class="page_container" data-page="6">Year <b>20182019202020212022Average </b>
<b>Result: Overall, the days' sales in inventory analysis highlights the efficiency of Saigon Hotel in </b>
managing its inventory. The decreasing trend from 2018 to 2019 indicates improved efficiency, and the subsequent fluctuations in the following years may be influenced by various external and internal factors. It's essential to consider industry benchmarks and specific business circumstances when interpreting these changes.
<b>2.6. Day's sale in uncollected</b>
Currency unit: VND
<b>Average accounts receivables </b>
<b>Net sales</b> 45.439.591.448,00 50.383.315.539,00 17.580.851.374,00 17.933.162.805,00 28.079.031.839,00
<b>Day's sale inuncollected</b>
<b>Result:In 2018, Saigon Hotel had an average collection period of 41.64 days, indicating the average </b>
time it took to collect payments after a sale.The Days Sales Outstanding decreased slightly in 2019 to 39.055 days. A lower DSO suggests a more efficient collection process, with the company collecting payments more quickly.In 2020, the DSO increased to 47.104 days, suggesting a longer average time to collect payments. This may be influenced by various factors such as changes in customer payment behavior or economic conditions.In 2022, the DSO decreased to 86.097 days, but it remains relatively high compared to previous years. This suggests ongoing challenges in the collection process, and further examination is needed.
<b>2.7. Accounts receivable turnover</b>
Currency unit: VND
</div><span class="text_page_counter">Trang 7</span><div class="page_container" data-page="7"><b>Net sales</b> 45.439.591.448,00 50.383.315.539,00 17.580.851.374,00 17.933.162.805,00 28.079.031.839,00
<b>Beginning receivables</b>
4.4448.006.533 3.406,034,919 9,869.091.322 5.047.652.572 3.628.243.267
<b>Ending receivables</b>
5.279.786.798 9,599,866,609 5.047.652.572 3.628.243.267 3.436.101.145
<b>Average accounts receivables</b>
<b>Accounts receivable turnover</b>
<b>Result: Overall, the analysis of accounts receivable turnover suggests fluctuations over the years. </b>
The significant drop in 2020 and subsequent recovery in 2022 highlight the impact of external factors on the company's ability to collect payments promptly. Further investigation into the reasons behind these changes and potential adjustments in credit policies or collection strategies may provide additional insights into Saigon Hotel's financial health.
<b>2.8. Total assets turnover</b>
Currency unit: VND
<b>Net sales </b> 45.439.591.448,00 50.383.315.539,00 17.580.851.374,00 17.933.162.805,00 28.079.031.839,00
<b>Beginning total assets</b>
161.729.015.097 172.119.695.122 186.206.885.718 179,052,635.633 184.802.124.312
<b>Ending total assets</b>
172.119.695.122 187.169.758.188 179,051,635.633 184.802.124.312 196.859.328.298
<b>Average Total Assets</b>
<b>Total assets turnover </b>
<b>Result:2.9. Current ratio</b>
Currency unit: VND
</div><span class="text_page_counter">Trang 8</span><div class="page_container" data-page="8"><b>Result: The trend in current assets indicates overall growth, reflecting the company's ability to </b>
maintain liquidity and potentially invest in short-term opportunities.
<b>2.10. Return on assets (ROA)</b>
<b>Result: The Return on Assets for Saigon Hotel experienced fluctuations over the years. The </b>
significant drop in 2020 followed by a recovery in 2022 indicates the impact of external factors on thecompany's ability to generate profits from its assets. Further analysis into the specific drivers behind these changes can provide insights into the company's financial performance and strategic decisions.
<b>Result: There was a decline in 2020 and 2021, there was a subsequent recovery in 2022. Monitoring </b>
quick assets is crucial for understanding a company's short-term liquidity and its ability to meet immediate financial obligations
</div><span class="text_page_counter">Trang 9</span><div class="page_container" data-page="9"><b>-Result: Times Interest Earned ratio is undefined in years where the interest expense is zero, as </b>
division by zero is mathematically undefined. Additionally, in 2022, the interest expense is negative, which is unusual
<b>ii</b>
<b>. Dam Sen Water Park Corporation (DASECO)1. Overview</b>Address: No. 3, Hoa Binh Street, Ward 3, District 11, Ho Chi Minh CityTax code: 0302844200
Stock code: DSNPhone: (84.28) 3858 8418Fax: (84.28) 3858 8419
Email: : Established: 1998
<b>2. Index analysis in (2020 / 2021 / 2022)2.1. Debt to assets ratio </b>
</div><span class="text_page_counter">Trang 10</span><div class="page_container" data-page="10"><b>Result: </b>From 2018 to 2022, the company's total debt and total assets have both increased. The debt to assets ratio started at 0.04 in 2018, peaked at 0.10 in 2019, and after a slight decrease in 2020 to 0.08, it increased again in the following years, reaching 0.11 in 2022. This indicates that the proportion of assets financed by debt has been generally increasing, suggesting that the company may be taking on more debt relative to its assets over time.
<b>2.3. Gross margin ratio </b>
Currency unit: VND
<b>Net sales </b> 231.038.447.125 235.603.761.445 97.564.516.328 66.111.208.222 246.888.302.262
<b>Cost of goods sold </b> 75.807.775.655 84.322.261.407 33.210.465.520 26.823.434.857 80.412.109.756
<b>Result: </b>The company has maintained a relatively stable gross margin ratio over the period, with minor fluctuations, suggesting consistent profitability in terms of the relationship between sales and the cost of goods sold. The year 2021 appears to have been more challenging, with the lowest margin ratio of the period, but there was a recovery in 2022, returning to the levels seen in 2018.
</div><span class="text_page_counter">Trang 11</span><div class="page_container" data-page="11"><b>2.5. Day's sale in inventory</b>
Currency unit: VND
<b>Ending inventory</b> 834.992.568 745.000.740 590.583.121 650.950.339 1.018.423.195
<b>Cost of goods sold</b> 75.807.775.655 84.322.261.407 33.210.465.520 26.823.434.857 80.412.109.756
<b>Day's sale in inventory </b> 4,02 3,22 6,49 8,86 4,62
<b>Result: </b>The increase in the day's sales in inventory in 2020 and 2021 could correspond with the effects of the COVID-19 pandemic on sales and supply chains, reflecting that the inventory was turning over more slowly. The improvement in 2022 might suggest that the company has started to overcome these challenges and is moving inventory more quickly again.
<b>2.6. Day's sale in uncollected</b>
</div><span class="text_page_counter">Trang 12</span><div class="page_container" data-page="12"><b>2.8. Total assets turnover</b>
Currency unit: VND
<b>Net sales</b> 231.038.447.125 235.603.761.445 97.564.516.328 66.111.208.222 246.888.302.262
<b>Average total assets</b> 253.536.112.892 269.996.977.193 250.127.368.378 212.465.461.829 242.022.484.048
<b>Total assets turnover</b> 0,91 0,87 0,39 0,31 1,02
<b>Result: </b>The trend suggests that after a couple of years of lower efficiency in using assets to generate sales (which might have been influenced by the economic impact of the COVID-19 pandemic), the company has significantly improved in 2022, either through better asset management, increased sales, or a combination of both.
</div><span class="text_page_counter">Trang 13</span><div class="page_container" data-page="13">impact the company's ability to quickly mobilize resources in response to immediate financialneeds.
<b>2.10. Return on assets (ROA)</b>
<b>2.12 Times interest earned</b>
Currency unit: VND
</div><span class="text_page_counter">Trang 14</span><div class="page_container" data-page="14"><b>Operating income</b> 120.132.909.119 119.669.364.939 47.850.333.677 28.645.559.340 135.746.328.075
<b>Interest expense</b> 2.000.000.000 0 126.003.017 (12.978.125) 1.727.261.811
<b>Time interest earned 60,07</b> 379,76 (2.207,22) 78,59
<b>Result: </b>The ratio in 2021 stands out as unusual and would typically prompt further investigation to understand the negative interest expense reported. Generally, a higher times interest earned ratio is favorable as it indicates that a company is more than capable of meeting its interest obligations from its earnings.
<b>iii. Dong A Construction Investment and Trading Joint Stock Company1. OVERVIEW</b>
Address: Room C301 3rd floor - Dong A Trade Center Building - No. 668 - Phan Dinh Phung Street - Group 7 - Ward. Dong Quang - City. Thai Nguyen - T. Thai NguyenTax code: 4600349907
Stock code: DAH Phone: (84.28) 0365 1967Fax: (84.28) 0365 8688Email:
Website: 2003
- Business Activities: Dong A Construction Investment and Trading JSC is a company operating in the construction and investment sector in Vietnam. Its primary activities include construction, infrastructure development, real estate investment, and trading.- Market Presence: The company has established a presence in the construction
industry, participating in various infrastructure and real estate projects within Vietnam.
- Financial Performance: Specific financial details, such as revenue, net income, and other financial metrics, would require up-to-date financial statements. However, in general terms, the financial performance of Dong A Construction Investment and Trading JSC might have been influenced by factors such as market demand, project success, economic conditions, and government policies affecting the construction and real estate sectors.
- Strategic Initiatives: Companies in the construction and investment sector often focus on strategic initiatives such as expanding project portfolios, enhancing operational efficiency, diversifying revenue streams, and maintaining healthy financial ratios to support growth.
- Market Position: Within Vietnam's construction and investment landscape, Dong A Construction Investment and Trading JSC likely competes with other companies in similar sectors, striving to maintain or improve its market position through quality projects, competitive pricing, and effective management.
</div><span class="text_page_counter">Trang 15</span><div class="page_container" data-page="15">- Regulatory Environment: Like any other company in Vietnam, Dong A Construction Investment and Trading JSC operates within the framework of local laws, regulations,and compliance standards governing the construction and investment sectors.
<b>2. INDEX ANALYSIS IN (2019 / 2020 / 2021 / 2022 / 2023)2.1. Debt to assets ratio </b>
<b>Result: Debt to assets ratio shows the ratio of a company’s assets financed by debt 5-year </b>
DAR < 1 indicates a low level of risk, the decreasing of debt to assets ratio is generally a positive sign of the improvement of a company's creditworthiness.
117.175.372.201
54.487.310.876
<b>Net sale</b> 198.369.899.938 90.052.153.345 12.337.366.562 375.876.190.682 14.770.534.258
<b>Result: The fluctuation in profit margin suggests that the company went through different </b>
phases of profitability during this period. It experienced a decline in profitability, recording a loss at one point, but managed to recover and reach a higher level of profitability in 2022.
<b>2.3. Gross margin ratio </b>
</div>