GREENHOUSE GASES – EMISSION, MEASUREMENT AND MANAGEMENT pptx
Bạn đang xem bản rút gọn của tài liệu. Xem và tải ngay bản đầy đủ của tài liệu tại đây (21.15 MB, 514 trang )
GREENHOUSE GASES –
EMISSION, MEASUREMENT
AND MANAGEMENT
Edited by Guoxiang Liu
Greenhouse Gases – Emission, Measurement and Management
Edited by Guoxiang Liu
Published by InTech
Janeza Trdine 9, 51000 Rijeka, Croatia
Copyright © 2012 InTech
All chapters are Open Access distributed under the Creative Commons Attribution 3.0
license, which allows users to download, copy and build upon published articles even for
commercial purposes, as long as the author and publisher are properly credited, which
ensures maximum dissemination and a wider impact of our publications. After this work
has been published by InTech, authors have the right to republish it, in whole or part, in
any publication of which they are the author, and to make other personal use of the
work. Any republication, referencing or personal use of the work must explicitly identify
the original source.
As for readers, this license allows users to download, copy and build upon published
chapters even for commercial purposes, as long as the author and publisher are properly
credited, which ensures maximum dissemination and a wider impact of our publications.
Notice
Statements and opinions expressed in the chapters are these of the individual contributors
and not necessarily those of the editors or publisher. No responsibility is accepted for the
accuracy of information contained in the published chapters. The publisher assumes no
responsibility for any damage or injury to persons or property arising out of the use of any
materials, instructions, methods or ideas contained in the book.
Publishing Process Manager Maja Bozicevic
Technical Editor Teodora Smiljanic
Cover Designer InTech Design Team
First published March, 2012
Printed in Croatia
A free online edition of this book is available at www.intechopen.com
Additional hard copies can be obtained from
Greenhouse Gases – Emission, Measurement and Management, Edited by Guoxiang Liu
p. cm.
ISBN 978-953-51-0323-3
Contents
Preface VII
Part 1 Greenhouse Gases Emission and Measurement 1
Chapter 1 Emissions of Nitrous Oxide (N
2
O) and Di-Nitrogen (N
2
)
from the Agricultural Landscapes, Sources, Sinks,
and Factors Affecting N
2
O and N
2
Ratios 3
M. Zaman, M.L. Nguyen, M. Šimek, S. Nawaz,
M.J. Khan, M.N. Babar and S. Zaman
Chapter 2 The Blend Ethanol/Gasoline and Emission of Gases 33
Antonio Carlos Santos
Chapter 3 Greenhouse Gas Emissions from Hydroelectric Reservoirs:
What Knowledge Do We Have and What is Lacking? 55
Raquel Mendonça, Nathan Barros, Luciana O. Vidal,
Felipe Pacheco, Sarian Kosten and Fábio Roland
Chapter 4 GHG Emissions Reduction
Via Energy Efficiency Optimization 79
Faisal F. Al Musa, Ali H. Qahtani, Mana M. Owaidh,
Meshabab S. Qahtani and Mahmoud Bahy Noureldin
Chapter 5 Greenhouse Gas Emissions
Non-Cattle Confinement Buildings:
Monitoring, Emission Factors and Mitigation 101
S. Godbout, F. Pelletier, J.P. Larouche, M. Belzile,
J.J.R. Feddes, S. Fournel, S.P. Lemay and J.H. Palacios
Chapter 6 The Effect of Organic Farms
on Global Greenhouse Gas Emissions 127
Risa Kumazawa
Chapter 7 Exploitation of Unconventional Fossil Fuels:
Enhanced Greenhouse Gas Emissions 147
Judith Patterson
VI Contents
Chapter 8 The Role of US Households
in Global Carbon Emissions 171
Md Rumi Shammin
Chapter 9 The Uncertainty Estimation and Use
of Measurement Units in National Inventories
of Anthropogenic Emission of Greenhouse Gas 187
Oleh Velychko
and Tetyana Gordiyenko
Chapter 10 Detection of Greenhouse Gases Using
the Photoacoustic Spectroscopy 215
Marcelo Sthel, Marcelo Gomes, Guilherme Lima,
Mila Vieira, Juliana Rocha, Delson Schramm,
Maria Priscila Castro, Andras Miklos, Helion Vargas
Chapter 11 Miniaturized Mass Spectrometer in
Analysis of Greenhouse Gases:
The Performance and Possibilities 235
Shuichi Shimma and Michisato Toyoda
Chapter 12 CO
2
and CH
4
Flux Measurements
from Landfills – A Case Study:
Gualeguaychú Municipal Landfill,
Entre Ríos Province, Argentina 255
Romina Sanci and Héctor O. Panarello
Part 2 Greenhouse Gases Effect and Management 273
Chapter 13 Greenhouse Effect 275
Andrew A. Lacis
Chapter 14 Regional-Scale Assessment of the Climatic Role
of Forests Under Future Climate Conditions 295
Borbála Gálos and Daniela Jacob
Chapter 15 Climate Change in the Upper Atmosphere 315
Ingrid Cnossen
Chapter 16 Projecting Changes in Extreme Precipitation
in the Midwestern United States Using North
American Regional Climate Change Assessment
Program (NARCCAP) Regional Climate Models 337
Shuang-Ye Wu
Chapter 17 Future Changes in the Quasi-Biennial Oscillation Under
a Greenhouse Gas Increase and Ozone Recovery in
Transient Simulations by a Chemistry-Climate Model 355
Kiyotaka Shibata and Makoto Deushi
Contents VII
Chapter 18 Regional Pattern of Trends in Long-Term
Precipitation and Stream Flow Observations:
Singularities in a Changing Climate in Mexico 387
Luis Brito Castillo
Chapter 19 The Environmental and Population
Health Benefits of Active Transport: A Review 413
Richard Larouche
Chapter 20 Arctic Sea Ice Decline 441
Julienne C. Stroeve and Walter Meier
Chapter 21 Post-Combustion CO
2
Capture with
Monoethanolamine in a Combined-Cycle Power Plant:
Exergetic, Economic and Environmental Assessment 463
Fontina Petrakopoulou, George Tsatsaronis,
Alicia Boyano and Tatiana Morosuk
Chapter 22 The Greenhouse Stakes of Globalization 485
Sébastien Dente and Troy Hawkins
Preface
Greenhouse gases, such as carbon dioxide, nitrous oxide, methane, and ozone, play an
important role in balancing the temperature of the Earth’s surface by absorbing and
emitting radiation within the thermal infrared range from the source. However, with
the enormous burning of fossil fuels from the industrial revolution, the concentration
of greenhouse gases in the atmosphere has greatly increased. The increase has most
likely caused serious issues such as global warming and climate change. Such issues
urgently request strategies to reduce greenhouse gas emissions to the atmosphere. The
main strategies include clean and renewable energy development, efficient energy
utilization, transforming greenhouse gases to nongreenhouse gases/compounds, and
capturing and storing greenhouse gases underground.
The book entitled Greenhouse Gases - Emission, Measurement and Management
contains two parts, a total of 22 chapters. The first 12 chapters (Part 1) discuss the
emissions of greenhouse gases, which cover the sources, measurements, and analysis.
The last ten chapters (Part 2) cover the effects and management of greenhouse gases,
which contain climate changes related to local and global effects, arctic sea ice decline,
and environmental performance.
I would like to thank all of authors for their significant contributions on each chapter,
providing high-quality information to share with worldwide colleagues. I also want to
thank the book managers, Maja Bozicevic and Viktorija Zgela, for their help during the
entire publication process.
Guoxiang Liu, Ph.D.
Energy & Environmental Research Center,
University of North Dakota,
USA
Part 1
Greenhouse Gases Emission and Measurement
1
Emissions of Nitrous Oxide (N
2
O)
and Di-Nitrogen (N
2
) from the Agricultural
Landscapes, Sources, Sinks, and Factors
Affecting N
2
O and N
2
Ratios
M. Zaman, M.L. Nguyen, M. Šimek, S. Nawaz,
M.J. Khan, M.N. Babar and S. Zaman
Ballance Agri-Nutrients Limited, Tauranga,
New Zealand
1. Introduction
Nitrous oxide (N
2
O) is one of the key greenhouse and ozone (O
3
) depleting gas, constituting
7% of the anthropogenic greenhouse effect. On a molecular basis, N
2
O has 310 and 16 times
higher global warming potential than that of CO
2
and CH
4
respectively over a 100-year
period. To develop mitigation tools for N
2
O emissions, it is imperative to understand the
processes of nitrogen (N) transformation and N
2
O and di-nitrogen (N
2
) production in soils
as influenced by different land uses, management and environmental conditions. The aim of
our chapter is to examine the current information and understanding of the sources of N
2
O
and N
2
production and the factors affecting N
2
O:N
2
ratio from the agricultural landscapes.
Nitrous oxide concentration has increased by 20% from 270 ppbv since 1750 to a current
level of 322 ppbv and continues to increase currently by 0.3% per year. Intensification of
agricultural and human activities, such as the increased use of synthetic fertilizer (103 M ton
of N worldwide in 2010), increasing human population and changes in their diet, inefficient
use of irrigation water, increased crop production, deposition of animal excreta (urine +
dung) from grazing animals, excessive application rates of farm effluents and animal
manures to croplands and pastures, and management practices that enhance soil organic N
mineralization and C decomposition including cultivation, residues removal or burning,
and following no crop rotation are to be blamed for the increased N
2
O emissions of 17.7 T g
of N per year to the atmosphere. This book chapter focuses on the following sub-sections
including nitrogen transformations, processes of N
2
O and N
2
production across the
agricultural landscape, challenges in N
2
O measurements and estimates across the
agricultural landscape, factors affecting N
2
O and N
2
emissions and possible mitigating
options, conclusions and references.
2. Nitrogen transformations
Nitrogen is an essential nutrient controlling the diversity, dynamics, and functioning of
many terrestrial, freshwater and marine ecosystems. Agricultural ecosystems rely on N
Greenhouse Gases – Emission, Measurement and Management
4
inputs from a variety of sources including synthetic chemical fertilizers, predominantly urea
which accounts for more than 50% of the total world N consumption, organic wastes (farm
dairy effluent, animal excreta, plant residues and sewage sludge) and atmosphere
(biological fixation of atmospheric N through symbiotic and non-symbiotic microorganisms)
to sustain productivity. A detailed description of N cycling in agricultural ecosystems is
beyond the scope of this chapter and for details on N transformations, N dynamics, sources of
N inputs, and losses, the readers are referred to research papers, articles and review written by
these authors (Ledgard et al., 1999; Saggar et al., 2004b, 2005, 2009, 2011; deKlein & Eckard
2008; Ledgard & Luo 2008; Luo et al., 2010); however a brief description of the various
microbial and enzymatic processes involved in N cycling is given below.
2.1 A brief biochemistry of N mineralization
Nitrogen transformations within soil-plant-water and atmospheric systems refer to N
cycling. As will be discussed in section 3, N cycling provides precursors like ammonium
(NH
4
+
) and nitrate (NO
3
-
) for the production of N
2
O and N
2
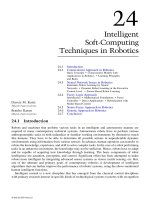
in soil. A simple schematic
diagram of the N inputs, losses and transformation processes is presented in Fig. 1 The key
N transformation processes within soil, plant and atmospheric systems include
mineralization (gross and net), immobilization, nitrification (gross and net), denitrification,
ammonia (NH
3
) volatilization, NH
4
+
fixation and NO
3
-
leaching. The first four processes (i.e.
mineralization, immobilization, nitrification and denitrification) are of microbial and
enzymatic origin (biotic), while the last three (i.e. NH
3
volatilization, NH
4
+
fixation and NO
3
-
leaching) involve only chemical and physical processes (abiotic). Nitrogen mineralization is
a sequence of microbial and enzymatic activities which involves the conversion of organic N
(eg. protein, amino acids, amines, amides, urea, chitin and amino sugars) into an inorganic
form of N (mainly NH
4
+
), which then serves as a substrate for a diverse group of micro-
organisms and for nitrification (Zaman et al., 1999 a, b; 2004; Zaman & Change, 2004). The
Rainfall
N
fixation
2
Animal
Effluent
irrigation
Nitrogen addition
Org.N
NH
4
+
NO
3
-
NO
2
-
N N O NO
2 2
NO
2
-
NO
2
N
Fertilizer
Leaching
Org.N, NH , NO
43
+-
Org.N
NH
4
+
NO
3
-
NO
2
-
N
2
NO
2
- 2
NO
NO
NO
2
Org.N, NH , No
43
+-
Surface runoff
Seepage
Wetland
Stream
Pasture soil
Org.N
NH
4
+
NO
3
-
NO
2
-
N
2
NO
2
-
NO
NO
2
2
NO
N
Fertilizer
NH
4
+
NO
3
-
Nitrification
Denitrification
Nitrification
Denitrification
Nitrification
Denitrification
Fig. 1. N inputs, losses and transformation processes across the agricultural landscape
(Zaman et al., 2008b).
Emissions of Nitrous Oxide (N
2
O) and Di-Nitrogen (N
2
) from
the Agricultural Landscapes, Sources, Sinks, and Factors Affecting N
2
O and N
2
Ratios
5
immobilization process is the opposite of mineralization, where mineral N (NH
4
+
and NO
3
-
)
and even organic N (amino acids) are consumed by a diverse group of microorganisms to
synthesize their protein and grow in number. These diverse groups of microorganisms are
mostly heterotrophic (consume organic C) bacteria, fungi, and actinomycete, which produce
a wide variety of extracellular and intra-cellular enzymes (e.g. protease, deaminase and
urease) in soil. They then carry out the hydrolysis of high molecular weight organic
compounds like protein into low molecular weight organic compounds such as amino acids,
as shown in Eq. 2.1.1
(2.1.1)
The low molecular weight organic compounds such as amino acids, amines and amides
produced after proteolytic decomposition or after the application of organic residues or
wastes are then subjected to microbial and enzymatic decomposition such as deamination
which is carried out either by extracellular deaminase (Ladd & Jackson, 1982; Zaman et al.,
1999 a, b) or by direct assimilation within the microbial cell (Barak et al., 1990; Barraclough,
1997). A large number of heterotrophic microorganisms are capable of carrying out the
deamination of amino acids, both within and outside the microbial cell. Deaminases
hydrolyse the NH
2
-N attached to the -C of an amino acid to NH
3
and CO
2
. The amino acids
are deaminated at different rates through four different reactions, depending on their side
chains, as shown below in Eq. 2.1.2. Some amino acids are reported to be readily
mineralized, while others take longer to mineralize (Alef & Kleiner, 1986).
Greenhouse Gases – Emission, Measurement and Management
6
(2.1.2)
Whether an amino acid is used for an energy source by microorganisms or as a building
block for protein synthesis depends on the available N and soluble organic C at the micro-
site where the microbial reaction occurs (Mengel, 1996). After deamination has occurred
within the cell, the removal of NH
4
+
is carried out by enzymes such as glutamate
dehydrogenase and coenzyme nicotine adenine dinucleotide (NADH). Ammonium
produced by deamination is always associated with the production of new microbial
biomass, and the extent of NH
4
+
immobilization or accumulation in the soil depends on the
micro-organism’s C:N ratio (Mengel, 1996; Paul & Clark, 1996) and the available soil mineral
N and organic C. The turnout of microbial biomass is reported to be fast and the new
microbial biomass die after reaching a certain limit, thus serving as a substrate for enzymes
and other groups of microorganisms. This turnover of microorganisms releases the NH
4
+
again. Thus the dead biomass, which is prone to biological decomposition (Jenkinson &
Ladd, 1981), serves as the main source of NH
4
+
production in soil (Azam et al., 1986). The
non-proteinaceous cell wall constituents of bacteria and fungi, such as amino sugar and
chitin, are first depolymerised by chitinase to glucose amines. These are then attacked by
kinases, and this process finally releases the NH
4
+
in soil as shown in Eq. 2.1.3.
(2.1.3)
Similarly urea (CO (NH
2
)
2
, from (i) urine deposition of grazing animals, (ii) the application
of urea fertilizer or (iii) from production of hydrolytic decomposition of proteinaceous
materials in soil, undergoes fast hydrolysis (Zaman et al., 2008a & 2009) and the hydrolysis
is usually completed within 1 to 2 days by urease enzymes. These ubiquitous enzymes are
found in soils, many plants and plant litters (Freney & Black, 1988) and in most species of
bacteria, yeast and fungi (Sumner, 1953). Urease catalyzes the hydrolysis of urea to NH
4
+
(Eq. 2.1.4) and carbamate ions, which result in the production of carbon dioxide (CO
2
) and
NH
4
+
.
(2.1.4)
Emissions of Nitrous Oxide (N
2
O) and Di-Nitrogen (N
2
) from
the Agricultural Landscapes, Sources, Sinks, and Factors Affecting N
2
O and N
2
Ratios
7
The active site of urease contains two-nickel (II) atoms, which are linked by a carbamate
bridge. Two imidazole N atoms are bound to each Ni atom; a carboxylate group and a water
molecule fill the remaining coordination site of the metal ion. The ability to hydrolyze urea
is found to vary from 17 to 70% for soil bacteria and from 78 to 98% for soil fungi (Lloyd &
Sheaffe, 1973; Roberge & Knowles, 1967). Although soil urease is considered to be of
microbial origin (Skujins, 1976), there is evidence to suggest that some urease activity may
be derived from plants (Frankenberger & Tabatabai, 1982). However, there is no direct
evidence for the production of urease by plant roots (Estermann & McLaren, 1961).
3. Processes of N
2
O and N
2
production across the agricultural landscape
Gaseous N emissions from the agricultural landscape (arable, pasture and wetland soils)
occur as NH
3
, nitric oxide (NO also called nitrogen oxide), nitrogen dioxide (NO
2
), N
2
O and
N
2
. Quantifying N
2
O emission is of particular interest to those countries, which are
signatories to the Kyoto Protocol, since it is one of the key greenhouse gases constituting 7%
of the anthropogenic greenhouse effect. On a molecular basis, N
2
O has 310 and 16 times
higher global warming potential than that of CO
2
and methane (CH
4
) respectively over a
100-year period (IPCC, 2007). The global atmospheric concentration of N
2
O has increased
from 270±7 in the pre-industrial-period (1750) to a current level of 322 ppbv representing a
20% increase. Over the last two decades a nearly linear increase of 0.26% in the
concentration of N
2
O has been measured (Saggar et al., 2009). Moreover, due to its relative
stability, (150 years) after emission from the soil surface and transport through the
troposphere, N
2
O acts as a source of NO in the stratosphere, and thus indirectly accelerates
depletion of ozone (O
3
), a substance that protects the biosphere from harmful ultraviolet
(UV) radiation (Crutzen, 1981; Duxbury, 1994). The total estimated emissions of N
2
O are
about 17.7 Tg N per year, but there are large uncertainty ranges in each of the individual
sources. About 70% of N
2
O emissions come from the bacterial breakdown of N in soils and
in the oceans. Globally, soils in areas of natural vegetation, especially in the tropics, and the
oceans account for N
2
O emissions of about 6.6 and 3.8 Tg N per year respectively; while
human activities account for the remaining 30% of N
2
O emissions, or about 6.7 Tg N per
year (Denman, 2007). Factors blamed for the increased N
2
O emissions of 17.7 T g of N per
year to the atmosphere include; a rapid increase in human population (according to the
latest United Nations population estimates, 77 million more people each year are being
added to the current world population of 6.98 billion), intensification of agricultural and
human activities, such as the increased use of synthetic fertilizer (103 million ton of N
worldwide in 2010) (IFA 2011), inefficient use of irrigation water and N fertilizers (both
synthetic and organic), increased grassland areas for livestock which cover 117 million km
2
of
vegetated lands that provide forage for over 1800 million livestock units and wildlife (World
Resources Institute 2000). The other factors include increased animal stocking rates (>3 cows
per ha) and intensive gazing, which results in deposition of huge amounts of N via animal
excreta (urine + dung), farm management practices that enhance soil organic N
mineralization and decomposition of organic C (deep cultivation, crop residues removal or
burning, and following no crop rotation) and the increased consumption of dairy products
worldwide especially in fast growing economies like China and India (Robertson et al., 1989;
Duxbury et al., 1993; Šimek & Cooper, 2001; Rochester, 2003; Denman et al., 2007; IPCC,
2010; Zaman & Blennerhassett., 2010; Zaman & Nguyen., 2010). Nitrous oxide can also be
produced during nitric acid production and fossil fuel combustion, but the amount of N
2
O
Greenhouse Gases – Emission, Measurement and Management
8
from fossil fuel varies with the fuel type and technology. Fossil fuel combustion and
industrial processes are responsible for N
2
O emissions of around 0.7 Tg N per year
(Denman, 2007). Other important sources include human sewage and the burning of
biomass and biofuels.
Across the agricultural landscape, several microbial processes can occur simultaneously to
produce harmful N
2
O and non-greenhouse N
2
in soils (pasture and arable) and sediments
(drain, ditch, wetland and stream). These microbial processes are regulated by various soil,
environmental and management factors, therefore making it difficult to control the rates of
N
2
O and N
2
production and their ratios (Paul & Beauchamp, 1989; Stevens et al., 1997;
Zaman et al., 2007, 2008 b,c; Zaman & Nguyen, 2010). The aim of our review is to examine
current information and understanding of the sources of N
2
O and N
2
production and factors
affecting N
2
O:N
2
ratio in agricultural landscape, to enable management practices to be
devised that minimize N losses as N
2
O emission to the atmosphere.
Soil microbial processes, which account for major N
2
O production include; nitrification
(Inubushi et al., 1996), denitrification (Tiedje, 1988; Firestone & Davidson, 1989; Smith, 1990;
Cavigelli & Robertson, 2001) and dissimilatory NO
3
-
reduction to NH
4
+
(DNRA) (Silver et
al., 2001). These three microbial processes may occur in soils and sediments across the
landscape depending on the physical (moisture contents or O
2
level) and chemical
conditions [N form (i.e. NH
4
+
and NO
3
-
), pH and C contents] in their micro-sites. Details of
each of these processes are given below:
3.1 Nitrification
Autotrophic nitrification, a strictly aerobic process, is carried by chemolitho-autotrophic
bacteria which use O
2
as a terminal electron acceptor. In the first step, NH
4
+
is oxidized to
NO
2
-
by ammonia oxidizing species of the genus Nitrosomonas, while in the second step,
NO
2
-
oxidation to NO
3
-
is facilitated by Nitrobacter and Nitrococcus (Bremner & Blackmer,
1981; Watson et al. 1981) as shown in Eq. 3.1.1 Other genera including Nitrosococus,
Nitrosospira and subgenera Nitrosobolus, and Nitrosovibrio also have the ability to
autotrophically oxidize NH
3
to NO
2
-
:
(3.1.1)
In addition to NO
2
-
production during the first stage of autotrophic nitrification, several
intermediate and unstable compounds such as hydroxylamine (NH
2
OH) and nitroxyl
(NOH) are also formed. Ammonia oxidizers consume relatively large amounts of molecular
O
2
during this first stage, causing anaerobic conditions in the microsites, which then lead to
a reduction of NO
2
-
to N
2
O and N
2
(Poth & Focht, 1985; Firestone & Davidson, 1989; Zart &
Bock, 1998; Colliver & Stephenson, 2000) as shown in Eq. 3.1.2.
Emissions of Nitrous Oxide (N
2
O) and Di-Nitrogen (N
2
) from
the Agricultural Landscapes, Sources, Sinks, and Factors Affecting N
2
O and N
2
Ratios
9
(3.1.2)
Broken lines show the unconfirmed pathways of the biological reaction.
Heterotrophic nitrification, the oxidation of reduced N compounds or NH
4
+
to NO
3
-
in the
presence of O
2
and organic C, can also produce N
2
O from NO
2
-
and typically occurs in
acidic soils (Wood, 1990). However, high rates of heterotrophic nitrification relative to
autotrophic nitrification have been measured in a riparian wetland soil with a pH close to 7,
which was exposed to O
2
(Matheson et al., 2003). Production of N
2
O via heterotrophic
nitrification is poorly understood because autotrophic and heterotrophic nitrification can
occur simultaneously in a given soil and it is difficult to separate the end products of these
two processes without using
15
N tracers (Matheson et al., 2003). Sufficient soil O
2
levels
[(optimum at water filled pore space (WFPS) of 60%)], adequate NH
4
+
concentrations, a
favorable soil temperature above 5
o
C (optimum 25 to 35
o
C), and soil pH above 5 (optimum 7
to 9) are among the known soil and environmental conditions which control the rate of
autotrophic nitrification (Linn & Doran 1984; Grundmann et al., 1995; Whitehead, 1995;
Zaman et al., 1999a; Šimek., 2000; Zaman & Chang, 2004; Zaman et al., 2007; Saggar et al.,
2009; Zaman et al., 2009; Zaman & Nguyen, 2010). Among these factors, NH
4
+
and O
2
concentrations are considered the most critical factors affecting autotrophic nitrification
(Zaman et al., 2007). Thus autotrophic nitrification is expected to be a dominant N
transformation process in well-drained pastoral or arable systems, where soils are
oxygenated (at or around field capacity or at 60% WFPS) and NH
4
+
is abundant [(e.g.,
excreta deposition after animal grazing, after the application of organic wastes, and NH
4
+
-
based synthetic fertilizer like urea, di-ammonium phosphate (DAP), ammonium sulphate,
and liquid ammonia or as a result of increased mineralization of soil organic N
compounds)] (Zaman et al., 1999a,b; Zaman & Chang, 2004; Zaman et al., 2007; 2008a; 2009;
Zaman & Nguyen 2010). However, nitrification can also occur in waterlogged areas at a
slower rate where wetland vegetation releases O
2
from roots (Armstrong, 1964). At the
sediment-plant root interface, nitrifying bacteria are supplied with O
2
from plants and NH
4
+
from the surrounding sediment. There is evidence to suggest that autotrophic denitrification
can proceed at a pH around 4, because soil aggregates protect bacterial cells against nitrous
acid toxicity (De Boer et al., 1991).
3.2 Denitrification
Denitrification is predominantly a microbial process by which NO
3
-
and NO
2
-
are reduced to
N
2
O and N
2
in a respiratory metabolism. During respiratory denitrification, denitrifiers
couple reduction of N-oxides to oxidation of organic C under anaerobic conditions and
Greenhouse Gases – Emission, Measurement and Management
10
produce adenosine tri-phosphate (ATP) by phosphorylation (Firestone, 1982; Linn & Doran,
1984; Tiedje, 1988, Smith, 1990; Cavigelli & Robertson, 2001). Four different reductase
enzymes are involved in a complete denitrification reaction. These enzymes are usually
distributed in different microorganisms as shown in Eq. 3.2.1.
NO
3
-
NO
2
-
NO
N
2
O
nitrate reductase
nitrite reductase
nitric oxide
reductase
nitrous oxide
reductase
N
2
ATP ATP ATP ATP
(3.2.1)
Denitrifiers are usually aerobic bacteria; however they prefer to use N-oxides at a low O
2
level (Tiedje, 1988). Biological denitrification thus requires; NO
3
-
as a substrate (more than 2
mg NO
3
-
-N per kg of soil) as an electron acceptor, absence of O
2,
which is related to a high
soil moisture content >60% WFPS,
available organic C as an electron donor, suitable soil pH,
which generally ranges from 5 to 8 (optimum at 7) and a soil temperature range between 5
and 30
o
C (optimum 25
o
C) (Ryden & Lund, 1980; Ryden, 1983; Goodroad & Keeney, 1984;
Scholefield et al., 1997; Barton et al., 1999; Swerts et al., 1997; Aulakh et al., 2001; Zaman et
al., 2004; Zaman et al., 2007, 2008 b c, 2009; Zaman & Nguyen, 2010). However, the most
critical factors are the NO
3
-
concentrations, anaerobic conditions and the availability of
soluble organic C (Zaman et al., 2007; 2008bc). Thus denitrification is expected to be an
important N transformation process in areas where soils and sediments are subject to water
logging (making them anaerobic), where they contain sufficient organic C and intercept
inputs of NO
3
-
or NO
2
-
in groundwater or where there is excess nitrate after application of
nitrate based fertilizers, or after nitrification (eg. 3.1.1). These areas include; urine patches in
grazed pastures, where up to 1,000 kg N ha
-1
can be found (Saggar et al., 2009; Zaman &
Blennerhassett., 2010), riparian wetlands (Nguyen et al., 1999; Matheson et al., 2003), drains
and ditches, and stream or river channels (Garcia-Ruiz et al., 1998; Bronson & Fillery, 1998;
Mcmahon & Dennehy, 1999; Walker et al., 2002; Groffman et al., 2002; Zaman et al.,
2008b&c, Zaman & Nguyen, 2010). However denitrification can also occur in less obviously
waterlogged areas within the agricultural landscape due to the existence of anaerobic micro-
sites such as in the center of soil aggregates (Parkin, 1987) or in areas of localized high O
2
consumption (hot spots), which are created by decaying organic C (Burton et al., 1999;
Godde & Conrad, 2000; Khalil et al., 2002; Mosier et al., 2002). Depending on soil physical
and chemical conditions, other processes like chemo-denitrification can result in substantial
production of N
2
O.
3.3 Dissimilatory NO
3
-
reduction to NH
4
+
(DNRA)
DNRA is the 3
rd
biological process, which is known to produce considerable amounts of
N
2
O as a byproduct under anaerobic conditions (Tiedje, 1988; Silver et al., 2001) as shown in
Eq. 3.3.1
Conditions required for DNRA are similar to those required for denitrification and besides
anaerobiosis include available NO
3
-
and organic C (Tiedje, 1988). DNRA has been found in
anaerobic sludge and animal rumen, and also in lake littoral sediments, riparian wetland
soil (Matheson et al., 2002) and tropical forest soils (Silver et al., 2001). Matheson et al.,
(2002) has also shown that DNRA is likely to be a more important process of NO
3
-
Emissions of Nitrous Oxide (N
2
O) and Di-Nitrogen (N
2
) from
the Agricultural Landscapes, Sources, Sinks, and Factors Affecting N
2
O and N
2
Ratios
11
transformation relative to denitrification under more reducing (O
2
limited) conditions, since
the microbes capable of DNRA are fermentative, and are able to grow in the absence of O
2
contrary to predominantly aerobic denitrifiers. Silver et al. (2001) reported that in upland
tropical forest soils, DNRA accounted for 75% of the turnover of the NO
3
-
pool and N
2
O
emission rates via DNRA, were 3 times greater than the combined N
2
O and N
2
fluxes from
nitrification and denitrification. Within the agricultural landscape, DNRA is likely to be an
important N transformation process in wetland or stream sediments but may also occur in
slow-draining upland soils where anaerobic sites are prevalent.
(3.3.1)
As discussed above, while nitrification and DNRA produce only N
2
O, denitrification
produces both N
2
O and N
2
. Stevens and Laughlin (1998) hypothesized that N
2
O produced
by various processes might form one common pool before being reduced to N
2
by nitrous
oxide reductase. However, there is limited information available about the bulk reduction of
N
2
O to N
2
.
4. Challenges in N
2
O measurements and estimates across the agricultural
landscape
Nitrous oxide emission and estimation across the different agricultural landscapes (arable,
pasture, and wetland) is extremely variable (both spatially and temporally), thus posing the
greatest challenge to researchers, modellers and policy makers to accurately predict N
2
O
emissions. Among the different field and laboratory methods, the static chamber method
has most widely been used to determine the rate of N
2
O emissions from soil because these
chambers are easy to design, portable, compact, easy to install, and can be readily adapted
to take gas measurements in the presence of animals and growing crops (Saggar et al., 2009).
Readers are referred to Saggar et al (2009) for detailed information on the static chamber
method. Other methods, including the sub-surface measurement of N
2
O emissions (Arah et
al., 1991; Gut et al., 1998; Clark et al., 2001), the Push and Pull technique of Addy et al. (2002)
modified by Zaman et al., 2008b to quantify N
2
O and N
2
emissions from wetland soils and
the estimation approach of the Intergovernmental Panel on Climate Change (IPCC) have
also been used to quantify N
2
O emissions.
Few studies have carried out simultaneous measurements of N
2
and N
2
O across the
agricultural landscape. This is probably due to a lack of robust, easy and less expensive
measurements and analytical methods. The most commonly used methods for measuring
production of N
2
and N
2
O in and their emission from the soils, include a technique based on
the acetylene (C
2
H
2
) inhibition of N
2
O reduction (Tiedje et al., 1988) and methods using
substrates enriched in
15
N which allow subsequent
15
N gas determination by isotope-ratio
mass spectrometry (Mosier & Klemedtsson, 1994). These methods are not only expensive
but far from perfect and have some serious biological implications. For example, C
2
H
2
inhibition method needs paired soil samples (with or without C
2
H
2
), which is not only time
Greenhouse Gases – Emission, Measurement and Management
12
consuming and expensive to analyze but a small amount of C
2
H
2
(1%) can block nitrification
and thus underestimates denitrification in NO
3
-
limited soils. Denitrifiers after repeated
exposure to C
2
H
2
adapt to C
2
H
2
and use it as a source of C, which stimulates denitrification
rates. Therefore both paired soil samples need to be discarded after 24 hrs of incubation to
avoid this problem. In addition, acetone, which is added to C
2
H
2
as stabilizer, also acts as a
source of C for denitrifiers (Gross & Bremner, 1992) and needs to be removed before
injecting C
2
H
2
into soil cores or incubation jars. The most problematic step of this technique
however, is to successfully achieve a uniform distribution of the desired concentration of
C
2
H
2
in microsites inhabited by denitrifiers if intact soils cores are used (Zaman & Nguyen,
2010). Similarly a lack of inhibitory effect of C
2
H
2
on Nitrosospira briensis, one of the common
ammonia-oxidizing bacteria in soils, observed by Wrage et al., (2004) also poses a challenge,
especially in soil treated with ammonium-based fertilizer where N
2
O production via
nitrifier-denitrification is likely to be overestimated. Thus although the technique of C
2
H
2
inhibition has been widely used in laboratory conditions, when sieved soils or small
monoliths were deployed, it has rarely been used in field conditions. To avoid the inhibitory
effects of C
2
H
2
on nitrification and denitrification, recently there has been an increasing
interest in developing isotopic methods, which enable researchers to measure both N
2
O and
N
2
concurrently and identify the source of N
2
O production from various microbial processes
including nitrification, denitrification and DNRA (Stevens et al., 1997; Matheson et al., 2003;
Sutka et al., 2006). N
2
O production during nitrification and denitrification involves
significant isotopic discrimination (ε = 3560‰ and 2833‰, respectively) (Robinson, 2001).
Tilsner et al. (2003) reported that N
2
O emitted during denitrification under controlled
laboratory conditions was highly depleted in
15
N (40.8 ± 5.7‰). Similarly Stevens et al.
(1997) differentially labelled the NH
4
+
and NO
3
pools simultaneously with
15
N, and
periodically measured their individual
15
N enrichments and N
2
O emission. A random
distribution of
15
N in N
2
O indicated a single source of origin whereas a non-random
distribution indicated the two or more sources of N
2
O origin. Despite the fact that the
isotopic method permits the fractional contribution of each pathway to N
2
O production and
concurrent measurements of both N
2
O and N
2
, few researchers have used this method due
to the high cost of
15
N-substrates and
15
N gases analyses, limited access to gas
chromatograph with isotope-ratio mass spectrometers, and the difficulties associated with
the uniform labeling of N pools in drier soils. Recently Mondini et al (2010) developed a
robust automated dynamic closed chamber technique for concurrent measurement and
analysis of N
2
O, CO
2
and CH
4
under laboratory conditions. In their system, a gas
chromatograph is connected to a fully computerised sampling system composed of 16
sample jars and 2 multiposition valves. For further details on these various methods, the
readers are referred to the above mentioned papers.
In the estimation approach, the IPCC divides N
2
O emissions from the agricultural landscape
into direct and indirect emissions. Direct N
2
O emission refers to N
2
O derived from applied
fertilizer and manure N, which is believed to increase with fertilizer use. Under the United
Nations Framework Convention for Climate Change (UNFCCC), the majority of the
countries use the IPCC default value of the 1% as emission factor (EF) (IPCC, 2006) from
agricultural soils receiving synthetic fertilizers, farm dairy effluents (FDE), organic wastes
and N fixed via biological fixation by leguminous crops (Bouwman et al., 2002; Stehfest &
Bouwman 2006). However, a wide range of direct N
2
O emissions (i.e. 3 to 22% of applied N)
across the agricultural landscape have been reported in the literature (Corre et al., 1996;
Emissions of Nitrous Oxide (N
2
O) and Di-Nitrogen (N
2
) from
the Agricultural Landscapes, Sources, Sinks, and Factors Affecting N
2
O and N
2
Ratios
13
Lovell & Jarvis, 1996; Velthof et al., 1996; Jambert et al., 1997; Goossens, et al., 2001; De Klein
et al., 2003; Zaman et al. 2007; 2008b, c; Saggar et al., 2007b; Zaman & Nguyen, 2010) which
is greater than the 1% EF value of the IPCC. A comprehensive review collected by Saggar et
al., (2009) indicated that N
2
O emissions from synthetic fertilizers range between 0.1 and
about 2% of applied N. The large variations in the EF could be related to differences in soil
types, time of fertilizer application, climatic conditions, weather patterns and form of
synthetic fertilizers (ammonium and nitrate-based chemical fertilizers), animal urine and
different protocols of N
2
O measurement such as static chambers, C
2
H
2
inhibition,
micrometeorological, and isotopic methods. Crutzen et al (2007) also reported that the IPCC
methodology seriously underestimates N
2
O emissions from agriculture. Their estimates,
using known global atmospheric removal rates and concentration growth of N
2
O, show an
overall EF of 3–5%, whereas the EFs estimated for direct and indirect emissions using IPCC
methodology cover only part of these emissions. Saggar et al (2009) further argued that the
IPCC approach is limited by a number of uncertainties in emission factors, and in indirect
emissions, limited data on the type and amount of N excreted by grazing animals, and in
spatial and temporal variability of N
2
O emissions. Furthermore, the IPCC methodology
does not allow for any mitigation options such as the use of urease or nitrification inhibitors
and others. It is therefore critical to collect more data to validate the IPCC emission factor for
N
2
O emission from agricultural soils, which may enable us to accurately predict the global
N
2
O budget.
According to the IPCC, indirect N
2
O emission consists of 3 parts; N
2
O emissions associated
with atmospheric N deposition [N
2
O (G)], human waste [N
2
O (S)], and with N lost via
surface runoff and leaching [N
2
O (L)]. Indirect N
2
O emissions represent 1/3 of the total
agricultural emissions, and the majority (75% of the total indirect emission) come from
riparian zones (riparian wetlands, drainage ditch and stream sediments), where NO
3
-
in
leachate and NH
4
+
in runoff from farmland are microbially converted to N
2
O and N
2
(Groffman, 2002; Zaman et al., 2007; Zaman et al., 2008b,c Zaman and Nguyen, 2010). N
2
O
emission rates from riparian wetlands are generally higher than those of agricultural soils
(Lowrance et al., 1984; Pinay et al., 1993; Zaman et al., 2008c) which could be attributed to
the higher C in riparian soils and enriched NO
3
-
inputs from surrounding areas via seepage
and groundwater flow to riparian zones. Given the potentially higher N
2
O emission rates
from wet soils c.f. dry soils in agricultural landscapes, and the general lack of data from wet
soils, there is a clear need for more data on N
2
O emission rates from riparian wetlands.
Limited studies have been conducted to measure the rate of N
2
O emissions from streams
and rivers. Garcia-Ruiz et al. (1999) found that N
2
production ranged from 0.05-0.27 µmol N
m
-2
h
-1
in the Swale-Ouse River system to 570 µmol N m
-2
h
-1
in the River Wiske. In the River
Wiske, N
2
O production accounted for up to 80% of total N gas production. Using the
current IPCC methodology, approximately 40% of indirect N
2
O emissions (emissions not
accounted for from direct N sources such as fertilizers and applied animal urine) are derived
from streams, rivers and estuaries.
5. Factors affecting N
2
O and N
2
emissions and possible mitigating options
As reviewed in Section 3 (Processes of N
2
O and N
2
production across the agricultural
landscape), autotrophic and heterotrophic nitrification and DNRA produce only N
2
O; while
Greenhouse Gases – Emission, Measurement and Management
14
denitrification produces both N
2
O and N
2
. The emissions of N
2
O and N
2
and their ratios are
affected by various soil and management factors, including mineral N concentration,
available C, soil pH, soil aeration status, soil temperature and their interactions as shown in
Table 5.1.
Factors Management Impact Management practices
Soil NH
4
+
& NO
3
-
concentration
Decrease Reduce nitrification &
denitrification and
lower N
2
O:N
2
Use urease and
nitrification inhibitors to
enhance fertilizer use
efficiency; split N fertilizer
application to synchronize
plant N demand and to
minimize N losses; avoid
over grazing; manipulation
of animal diet; use of
constructed or natural
riparian wetland,
improving water use
efficiency to avoid
anaerobicity
Soil organic C Increase Improve soil health,
facilitate
denitrification and
thus lower N
2
O:N
2
Sequester more C by
adopting management
practices including zero or
minimum tillage, retention
of crop residues, mulching,
application of organic and
farm wastes, biochar, and
applying chemical
fertilizers with organic
amendments
Soil pH Increase Facilitate nitrification
and denitrification
and thus lower
N
2
O:N
2
Regular liming each year
or if possible with every N
fertilizer application
Soil aeration and
water status
Improve Facilitate nitrification
and denitrification
and thus lower
N
2
O:N
2
Improving soil structure
via C sequestration,
avoiding soil compaction;
improving soil drainage
condition and also water
use efficiency
Table 5.1. Factors affecting N
2
O and N
2
emissions and their ratios.
In the section below, an attempt has been made to discuss these soil and management
factors. Understanding these factors may help us to design mitigating tools to reduce the
rate of N
2
O production and to lower N
2
O:N
2
ratios.
Emissions of Nitrous Oxide (N
2
O) and Di-Nitrogen (N
2
) from
the Agricultural Landscapes, Sources, Sinks, and Factors Affecting N
2
O and N
2
Ratios
15
5.1 Soil NH
4
+
and NO
3
-
concentrations
The amount of mineral N, both NH
4
+
and NO
3
-
, are critical for the production of N
2
O, N
2
and their ratio. The amount of NH
4
+
in soil under aerobic soil conditions, and hence its
availability for nitrification, can directly regulate N
2
O emission via nitrifier-denitrification
(Webster & Hopkins, 1996; Wrage et al., 2001; Dalal et al., 2003; Ma et al., 2007), while NO
3
-
is used as a substrate by both denitrification and DNRA and thus affects N
2
O production
(Webster and Hopkins, 1996; Zaman et al., 2008c). A higher level of NO
3
-
in soil is also
known to result in incomplete denitrification and thus higher N
2
O:N
2
due to suppression of
nitrous oxide reductase activity, the enzyme responsible for microbial conversion of N
2
O to
N
2
(Eq. 3.2.1). To mitigate N
2
O emissions, researchers during the past two decades focused
mainly on reducing the rate of nitrification while little work has been done to exert control
on the denitrification level. For example, to reduce N
2
O emissions from applied urea,
ammonium based fertilizers or urine N, researchers have developed different mitigation
technologies including the use of N inhibitors to reduce the entry of mineral N from applied
fertilizer/urine into the available N pool, application of soil amendments like zeolites to
capture soil NH
4
+
and controlled release and split applications of N fertilizers to match crop
N demand. Among these options, coating chemical fertilizers with N inhibitors or applying
N inhibitors on their own to treat urine patches in grazed pastures have received the most
attention. The two major classes of N inhibitors are urease inhibitors (UIs) and nitrification
inhibitors (NIs). Urease inhibitors retard the hydrolysis of soil-applied urea and delay the
entry of urea-N into the NH
4
+
pool, which is likely to produce less N
2
O via nitrification due
to the limited availability of NH
4
+
(Watson, 2000; Xu et al., 2000; Zaman et al., 2008a; Zaman
et al., 2009) as shown earlier in Eq. 2.1.4. Such a reduction in urea hydrolysis also limits the
opportunity for nitrite (NO
2
-
) accumulation in the soil, which is known to produce N
2
O
(Eq. 3.1.2).
Decisions about N fertilizer application are usually dependent on the availability of water,
and the N application rate is determined by crop growth stage and the productivity goals.
Fast urea hydrolysis starts within hours of urea fertilizer application or after deposition of
urine from grazing animals and is completed within 1 to 3 days, during which time a
significant amount of NH
3
(up to 30% of the applied N) is lost. UI like N-(n-butyl)
thiophosphoric triamide (nBTPT) or Agrotain
®
applied at a very low concentration (0.01%)
with urea fertilizer is reported to delay such fast urea hydrolysis by 7 to 9 days (Watson et
al., 2008), which has implications for worldwide urea use in pasture and cropping systems
where there is a high risk of NH
3
loss due to low moisture and high temperature, especially
during summer or early autumn. Such a delay in urea hydrolysis allows more time for
rainfall or irrigation water to wash the applied urea from surface soil and thus minimizes
the risk of NH
3
emissions. After application, nBTPT is quickly converted to its oxygen
analog N-(n-butyl) phosphoric triamide) (NBPT) (Eq. 5.1.1), which is the actual UI (McCarty
et al., 1989; Christianson et al., 1990; Creason et al., 1990), and it is bound and moves along
with urea molecule in the soil (Christianson & Howard, 1994). The conversion of nBTPT to
NBPT is rapid, occurring within minutes/hours in aerobic soils (Byrnes & Freney, 1995), but
can take several days in the floodwater of tropical soils. NBPT forms a tridentate ligand with
the urease enzyme, blocking the active site (Manunza et al., 1999).
In addition to reduced nitrification, Agrotain is also known to reduce N
2
O emission
indirectly through reduced NH
3
volatilization (Watson et al., 1990; 1994 a & b, 1998, 2008;