Photoshop cs5 cho nhiếp ảnh gia part 3 pot
Bạn đang xem bản rút gọn của tài liệu. Xem và tải ngay bản đầy đủ của tài liệu tại đây (1.01 MB, 7 trang )
10
c h a p t e r 1: THINKING DIGITALLY ■
applied to your image at the moment of capture. Any changes, even if they’re done
using the ACR interface, will result in some destruction of pixels and therefore image
degradation. In reality, this may often be so slight that it’s not noticeable, but it’s
there. And sometimes the differences may be huge. For example, if you accidentally
use the wrong white balance, a JPEG image may be nearly useless at first and at
best may require extensive corrections in Photoshop. But the extent of the exposure
corrections you’ll be able to make will be less because you’ll have only an 8-bit image
to work with, and extensive Photoshop corrections may result in posterization or
noise. Furthermore, as discussed earlier, a JPEG file is compressed lossy, which means
that even when you first open it on your computer, it has already thrown away some
information the sensor captured when you took the picture. Sometimes this is not
noticeable, but at other times it can result in banding and other strange artifacts.
Which is right for you, JPEG or RAW? For most serious amateur and profes-
sional photographers, RAW is the way to go. It offers more flexibility and “forgiv-
ability” while simultaneously enabling the highest quality of output. If you make large
prints and want the best images you can get, RAW is without a doubt the way to go.
If limited storage space is your main priority and if you primarily post your images on
the Web, email them to friends, and make only an occasional tiny print, then JPEG
may be for you. If you plan on selling your images or entering contests, check with
your intended clients or the contest rules, because some will require you to provide the
original raw file as well as the converted image.
Try It! Shoot a series of images in RAW and in JPEG. Expose them to the best of your ability in
JPEG and then use the same settings for the raw version or use RAW + JPEG if your camera has that
option. Then shoot one set with an incorrect white-balance setting. Capture a variety of scenes, includ-
ing some with shadow areas, some with significant highlight areas, and some more average-toned
scenes. See whether you can detect a difference in the optimized versions. You may have to wait until
you finish a few more chapters so you can optimize both versions of the pictures to their maximum
potential for your final decision.
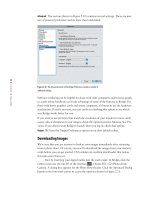
Understanding Histograms
Without a doubt one of the most important advantages of shooting digitally is the
ability to check the histogram to ensure you are exposing your images correctly. In
the old days—that is, just a few years ago, before digital cameras were common in the
field—wherever there was a group of photographers shooting similar subject matter,
you’d inevitably hear someone ask, “What are you shooting at?” People felt comfort-
able with their compositions but always worried about setting the exposure correctly,
knowing that as little as 1⁄3 stop difference could mean the difference between an
awesome image and a throwaway.
With digital cameras you can review your shots on the small LCD screen on
the back of the camera. Although this may be somewhat helpful for double-checking
607343c01.indd 10 4/11/10 11:02:28 PM
11
■ UNDERSTANDING HISTOGRAMS
your composition and to a certain extent to check for sharpness, the real value lies in
displaying the histogram. Get in the habit of checking the histogram in the LCD on
the camera back (like the one shown in Figure 1.6). In addition, if your camera has a
flashing highlight-overexposure alert feature, be sure to enable it. The alert will cause
the area of the picture that appears to have clipped highlights to blink or have march-
ing ants. That way you’ll know immediately what areas may not have highlight detail,
and you can decide whether you need to modify your exposures.
Figure 1.6 The major value of the LCD screen on your camera
back is the chance to review the histogram and double-check
your exposure.
Note: The highlight alert feature on most cameras is calculated based on a JPEG version of the
image using the current camera settings. Therefore it may indicate clipping when the data may exist
in the raw file. Use it as a guideline for potential clipping rather than an absolute indication of clipping.
Also use it to note what areas of the image are in danger of clipping so you can make an informed deci-
sion whether to alter the exposure.
What is a histogram? It’s simply a bar graph showing the distribution of the
tonalities (lightness/darkness) of the pixels you captured in the image. Each pixel not
only describes a color value, but also a brightness value. The tonal range extends from
pure black (0) on the far left to pure white (255) on the far right, with the different
tonalities in between. This means that dark tones are toward the left, middle tones are
in the middle, and light tones are toward the right. The higher the peak corresponding
to any particular value, the more pixels there are of that particular tonality within the
image.
Note: For the sake of convenience, the convention is to describe histograms as extending from 0
to 255, whether for 8-bit, 12-bit, or 16-bit images. In reality, though, the exposure scale of a histogram
goes from black at 0 to white at 255 in 8-bit capture; for 16-bit capture, the maximum value is 65,535.
Types of Histograms
Not all histograms are the same. Many cameras display an RGB histogram that is a
combination of the pixel values in each of the three channels. This is different from a
607343c01.indd 11 4/11/10 11:02:29 PM
12
c h a p t e r 1: THINKING DIGITALLY ■
luminosity or brightness histogram that other cameras use. The data in a luminosity
histogram is a weighted combination of the values in each channel. Still other cameras
display histograms that show each channel individually. Each type of histogram has
advantages and disadvantages.
Luminosity histograms are easier to use to determine if you have areas within
your image that are pure white or pure black, lacking detail. The only time a pixel will
register against the far-right or far-left side of a luminosity histogram is when all three
channels have a value of 0 or all three have a value of 255. With a luminosity histo-
gram, there is no question that if you have a spike of data on either edge, you have
pure black and/or pure white areas in your image, as shown in Figure 1.7.
RGB histograms sometimes look very similar to their luminosity counterparts,
while at other times they differ substantially. An RGB histogram presents all the data
from each channel, so if just one channel has a value of 0 or 255, you will see data
peaking against the edges of the histogram. It will appear that you could have high-
lights or shadows that are pure black or white when in fact that may not be the case,
as shown in Figure 1.8.
RGB histograms may have spikes on the edges when there are no white or black
areas because some colors legitimately have one or more channels with values of 0
or 255. For example, pure red is represented by RGB values of 255, 0, 0; pure green
would be 0, 255, 0; and pure blue would be 0, 0, 255. Similarly, cyan is 0, 255, 255;
magenta is 255, 0, 255; and yellow is 255, 255, 0. But those are not the only colors
that use the extreme values of 0 and 255.
Figure 1.7 When a luminosity histogram has a spike on one or both edges, you can be certain that the image
has areas that are pure white, like the windows in this image, or pure black.
Ph ot o b y EllE n An o n
607343c01.indd 12 4/11/10 11:02:30 PM
13
■ UNDERSTANDING HISTOGRAMS
Figure 1.8 If your image contains very saturated colors, the RGB histogram may indicate potential blown-out and/or blocked-up
areas, whereas a luminosity histogram will clearly indicate that these areas are not close to being pure white or pure black.
Ph o t o b y EllE n An o n
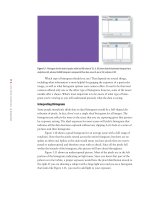
Any color that has a value of 0 or 255 in a single channel will contribute to a
spike on the edge of an RGB histogram. For example, the purple in Figure 1.9 has a
color value of 132, 0, 189. In an RGB histogram, any pixel that shade of purple will
contribute to a spike in the shadows, making it appear as if there are blocked-up shad-
ows when there may not be. That same shade of purple will be represented by data at
the point corresponding to a tonal value of 60 in a luminosity histogram…far away
from either end of the histogram. Figure 1.9 shows the differences in the histograms
for this shade of purple.
That may make it seem like it would always be easier to use a luminosity histo-
gram. The issue is that if you have a subject with very saturated colors, such as a poppy
or a bright-red cardinal, in reality the colors vary slightly to allow you to perceive detail
in the flower petals or the bird’s feathers. So, you need to have the tonal values varying.
If a lot of the pixels use values that contain 0 or 255, the chances are that you don’t have
as much detail in those colors as you may need. A luminosity histogram would give you
no indication of any potential trouble, whereas an RGB histogram would clearly indi-
cate potential trouble. By subtracting or filtering the light from an exposure, you may be
able to capture those areas of the flower or bird with more detail.
607343c01.indd 13 4/11/10 11:02:32 PM
14
c h a p t e r 1: THINKING DIGITALLY ■
Figure 1.9 A histogram for this shade of purple, which has RGB values of 132, 0, 189, shows that the luminosity histogram has a
single line at 60, whereas the RGB histogram is composed of three lines, one at 0, one at 132, and one at 189.
Which type of histogram should you use? That depends on several things,
including what information is most helpful for gauging the exposure of a particular
image, as well as what histogram options your camera offers. It used to be that most
cameras offered only one or the other type of histogram; however, some of the newer
models offer a choice. What’s most important is to be aware of what type of histo-
gram you’re viewing so you will understand precisely what the data is saying.
Interpreting Histograms
Some people mistakenly think that an ideal histogram would be a bell-shaped dis-
tribution of pixels. In fact, there’s not a single ideal histogram for all images. The
histogram just reflects the tones in the scene that you are capturing given that particu-
lar exposure setting. The ideal exposure for most scenes will yield a histogram that
indicates all the data has been captured without any clipping. Let’s look at a series of
pictures and their histograms.
Figure 1.10 shows a good histogram for an average scene with a full range of
tonalities. Note that the pixels extend across the entire histogram, but there are no
spikes at either end. Spikes at the ends would mean you have pixels that are overex-
posed or underexposed and therefore areas with no detail. Since all the pixels fall
within the bounds of the histogram, this picture will have detail throughout.
Figure 1.11 shows an underexposed picture. Most of the pixels are in the left
portion of the histogram, indicating no light tones. Since you know that part of the
pelican is in fact white, a proper exposure would have the pixel distribution moved to
the right. If you are shooting a subject with a large light area and you see a histogram
that looks like Figure 1.11, you need to add light to your exposure.
607343c01.indd 14 4/11/10 11:02:32 PM
15
■ UNDERSTANDING HISTOGRAMS
Figure 1.10 This is an ideal histogram for a scene with a full range of tonalities.
Ph o t o b y EllE n An o n
Figure 1.11 This picture is underexposed. Note that all the data in the histogram is skewed toward the left and there are no light
tonalities.
Ph o t o b y EllE n An o n
607343c01.indd 15 4/11/10 11:02:35 PM
16
c h a p t e r 1: THINKING DIGITALLY ■
Compare the image and histogram in Figure 1.11 with those of Figure 1.12. The
latter is a well-exposed picture with an ideal histogram of an overall slightly darker
scene with some important bright areas in the subject. If the exposure had been any
brighter, the whites might have been blown out and lost their detail. Blown-out
highlights means that no detail has been captured in the brightest areas of the pic-
ture. It’s another way of referring to clipping. Since we want to retain good detail in
the white areas, it’s important to safeguard against clipping the highlights. Although
in some images the darker portions of the picture may need to be lightened in the
raw converter or in Photoshop, if the light areas are part of your subject, you need
to expose in a way to make sure you capture the highlight detail. However, if the
nearly white portions are in small areas that are in the background or less important
places, and the main subject is dark to very dark, it’s often better to risk blowing out
the highlights, if necessary, to ensure that you capture all possible detail in the dark
subject.
Don’t get confused between an ideal in-camera histogram for the capture
and the final histogram of the optimized image, which may be noticeably different.
The goal in-camera is to capture as much information as possible, particularly in
your main subject. Once you have the information, you can modify it as you tweak
the image, but information you don’t capture in the first place is not going to be
there no matter what!
Figure 1.12 Images that are somewhat dark but also contain important lighter areas may have histograms that look like this. This is
correctly exposed for the raw capture even though the data is slightly skewed toward the left.
Ph o t o b y EllE n An o n
607343c01.indd 16 4/11/10 11:02:37 PM