Microsoft SQL Server 2005 Developer’s Guide- P18 pps
Bạn đang xem bản rút gọn của tài liệu. Xem và tải ngay bản đầy đủ của tài liệu tại đây (763.95 KB, 20 trang )
Chapter 9: Reporting Services 359
Programmability
Reporting Services is an extensible reporting platform, complete with a set of APIs
that allow developers to design and build reporting solutions. Reporting Services can
be integrated into custom applications in two ways: using URL access and using the
Reporting Services Simple Object Access Protocol (SOAP) API. The programming
method you choose depends on the functionality you need in your application. URL
access is best used when users only need to view or navigate through rendered
reports through a Web browser. The Reporting Services SOAP APIs allow more
complex operations, such as creating and managing reports and subscriptions, data
sources, and Report Server database items. There are also times when a combination
of these two methods most effectively meets your business needs.
You can also develop and manage extensions consumed by the Reporting Services
components using the available managed code API. You can create assemblies using
the Microsoft .NET Framework that add new Reporting Services functionality to
meet your specialized business tasks.
Using URL Access in a Window Form
Even though accessing your reports using URL links is best suited for Web environments,
you can also launch a report by starting your Internet Explorer programmatically from
a Windows form, or you can use a Web browser control to display a report on your
Windows form.
Starting Internet Explorer from a Windows Form
Internet Explorer can be started from a Windows form using the Process class of the
System.Diagnostics namespace. The Process class is used for controlling applications on
your computer. To view a report in your ReportServer database, you set the arguments of
the Process.Start function with the IExplore.exe application and the URL of the report.
The following code shows launching the IExplore process to display a report when a user
clicks a button on a Windows form:
Imports System.Diagnostics
Public Class Form1
Private Sub Button1_Click(ByVal sender As System.Object, _
ByVal e As System.EventArgs) Handles Button1.Click
Process.Start("iexplore.exe", _
"http://localhost/ReportServer/Pages/" & _
"ReportViewer.aspx?%2fProducts+Report")
End Sub
End Class
360 Microsoft SQL Server 2005 Developer’s Guide
Notice how, at the top of the code, the Imports declaration is used to include
the System.Diagnostics namespace. When the user clicks the Button1 button, the
Internet Explorer browser is started and the Products report is displayed.
Embedding a Browser Control on a Windows Form
You can add a Web browser control to your Windows form for viewing your report.
The Web browser control is included in the Internet Controls Library, shdocvw.dll.
To add the Web browser control to your Windows form:
1. Create a Windows form application in one of the .NET framework languages.
2. Select the Web Browser control from the Toolbox and drag it onto the design
surface of your Windows form.
3. Right-click the Web browser control and select the Properties option from the
pop-up menu.
4. Set the URL property to the URL access string for your report. In our example,
the URL string is: http://localhost/ReportServer/Pages/ReportViewer
.aspx?%2fProducts+Report.
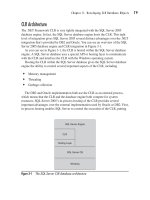
When the application is run, the report will automatically be generated and
displayed in the Web browser as shown in Figure 9-14.
Figure 9-14 Report in Web browser control
Chapter 9: Reporting Services 361
Integrating Reporting Services Using SOAP
While you can view reports in your Windows programs using URL access, the
Reporting Services SOAP APIs expose the full set of management functions, allowing
you to develop customized business reporting solutions. All of the administrative
actions of the Report Manager are available to the developer through the SOAP APIs.
Using the SOAP API in a Windows Application
A Web service object is provided that allows you to call the Reporting Services
functions from your Windows form application code. To use the Web service object,
you declare the object in your program code as follows:
Dim RepSrv As New ReportingService()
Then you can set the properties and use the methods just as you would for any
other object. The ReportingService object allows you to manage actions such
as catalog item retrieval, data sources, events, extensions, jobs, policies, roles,
schedules, subscriptions, and tasks. The following code example shows how to list
the items in a ReportServer database:
' Create a new Web service object
Dim RepSrv As New ReportingService()
RepSrv.Credentials = _
System.Net.CredentialCache.DefaultCredentials
' Return the list of items in My Reports
Dim CatItms As CatalogItem() = _
RepSrv.ListChildren("/My Reports", False)
Dim CatItm As CatalogItem
For Each CatItm In items
catalogComboBox.Items.Add(CatItm.Name)
End If
Next CatItm
Extensions
You can extend specific features of Reporting Services and its components by using
the managed code API that is available. The Reporting Services Extension Library is
a set of classes, interfaces, and value types that are included in Reporting Services.
362 Microsoft SQL Server 2005 Developer’s Guide
You can use this library to access system functionality; it is designed to be the
foundation on which .NET Framework applications can be used to extend Reporting
Services components. You can build custom extensions to add functionality in areas
such as data processing, delivery, rendering, and security. The extension functions
are included in namespaces that you can import into your .NET applications. The
extensions library namespaces are as follows:
Microsoft.ReportingServices.DataProcessing Classes and interfaces to extend the data processing capability of
Reporting Services
Microsoft.ReportingServices.Interfaces Classes and interfaces to extend delivery extensions, and security
extensions for Reporting Services
Microsoft.ReportingServices.ReportRendering Classes and interfaces to extend the rendering capabilities of
Reporting Services
RDL
The Report Definition Language (RDL) is composed of Extensible Markup Language
(XML) elements that describe report layout and query information. RDL conforms to
the XML grammar created for Reporting Services. It defines a common schema that
enables the interchange of report definitions as a standard way of communicating using
reports. RDL can be generated from an application using the .NET Framework classes
of the System.Xml namespace.
Accessing Reports
You can access and manage your reports through the Report Manager tool or by
pointing your browser directly to a report URL link. Report Manager is a Web-based
tool you can use to view published reports, run reports, and subscribe to reports.
Administrators can also use the Report Manager to configure permissions and
manage report distribution. You access the Report Manager through your browser
using the URL http://<servername>/reports.
Using URL Access
You access reports through a report server URL request that enables you to access the
reports, resources, and other items in the report server database. Report parameters for
your report, the rendering output, and device settings are contained in the query string
of the URL. You can embed the hyperlink URL to your reports and report server items
into Web or Windows applications.
Chapter 9: Reporting Services 363
URL Access Through a Web Application
The easiest method for accessing reports in a Web application is by directly pointing
your browser to a URL address. An example of directly accessing a URL is shown
here:
<a
href="http://localhost/ReportServer/Pages/ReportViewer.
aspx?%2fProducts+Report&rs:Command=Render&rc:LinkTarget=main" target="main" >
Click here for the Products report</a>
While this method is quite straightforward, it has some limitations, in that some
servers and browsers have a 256-character limit. To get around this, you can use the
POST request on a submission form.
URL Access Through a Form POST Method
By using the METHOD=“POST” on a forms submission, an application can access
reports without allowing the user to modify the URL query string. The following
code shows an example of using the POST method:
<FORM id="frmRender"
action=http://server/reportserver?/SampleReports/Products
method="post" target="_self">
<INPUT type="hidden" name="rs:Command" value="Render">
<INPUT type="hidden" name="rc:LinkTarget" value="main">
<INPUT type="hidden" name="rs:Format" value="HTML4.0">
<INPUT type="submit" value="Button">
</FORM>
Report Authoring
In the first part of this chapter you learned about the various components that make
up SQL Server 2005’s Reporting Services. In the second half of this chapter you’ll
get a more detailed look at the steps required to design and deploy a simple report.
Development Stages
To develop a simple Reporting Services application, you begin by using the Report
Designer to define the report’s data sources and layout. You then need to build
and deploy the report to the Report Server. Finally, you need to make the report
364 Microsoft SQL Server 2005 Developer’s Guide
available to end users by either embedding the report within an application or adding
subscriptions for the report.
Designing the Reporting Solution
To create Reporting Services solution using one of the interactive tools, you first
create a reporting project and select a dataset that defines the data that will be used in
the report. Then you lay out the individual data fields on the report. To handle stock
reports that are presented in a tabular or matrix format, the Report Wizard steps you
through the process of creating a data source and laying out the report. For more
complex reports, use the Report Designer to define data sources, design specialized
report layouts, and include custom items, such as images.
Building and Deploying the Reporting Solution
Once the report has been designed, you need to build the report and then deploy
it to the Report Server. Building the report creates a .NET assembly that will run
the report. Deploying the report essentially takes this assembly and copies it to the
Reporting Services Report Server. While you can perform this sequence manually,
the Report Designer has built-in options to both build and deploy reports to the
Report Server.
Making the Report Available to End Users
After the report has been deployed to the Report Server, you can then make the
report available to end users via several different mechanisms. You can allow access
to the reports by embedding them in an application, via their URLs, or by creating
a subscription that will push the report to the end user. Report subscriptions can be
set up to be delivered at a certain time, or they can be data driven.
Now that you have an overview of the Reporting Services development process,
the next section will take you through the steps of developing and deploying a simple
report using SQL Server 2005’s Reporting Services.
Creating a Reporting Services Report
You begin using the Report Designer either by starting the Report Wizard and using
it to create your initial report or by starting with a blank design surface and then
adding your own report definition elements. In either case, defining a dataset is the
first thing you need to create a report. In this example, we’ll look at how to build
a report using the Report Designer.
Chapter 9: Reporting Services 365
To build a Reporting Services application, first open the Business Intelligence
Development Studio and then select the File | New | Project option to display the
New Project dialog that’s shown in Figure 9-15.
To create a new Reporting Services report using the Report Designer, select
the Business Intelligence Projects option from the Project Types list. Then in the
Templates list shown in the right side of the screen select the Report Project option.
Fill in the boxes at the bottom of the dialog, setting the name and location for your
project. Clicking OK creates the project and displays the Report Designer. In the
Solution Explorer to the right of the screen, you will see the Report Project with two
folders in its directory structure: the Shared Data Sources folder and the Reports
folder.
Right-click the Reports folder. A pop-up menu displays the options Add New
Report, Add >, and Properties. If you select the Add New Report option, the Report
Wizard will start to guide you through creating a simple tabular or matrix report.
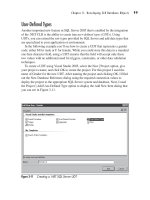
Here we will select the Add > | New Item option, which displays the Add New Item
dialog as shown in Figure 9-16.
Figure 9-15 Creating a new report: New Project
366 Microsoft SQL Server 2005 Developer’s Guide
Select the Report option from the Templates area of the dialog and click the
Add button to add the report file to your project and start the Report Designer. The
design surface in the center of the environment presents three tabs: Data, Layout,
and Preview. You define a dataset by clicking the Data tab to reveal the Data pane.
You create datasets in the Data pane to access data sources to include in your report.
Click the Datasets drop-down box and select the <New Dataset> option. This starts
the Dataset dialog shown in Figure 9-17, which allows you to define your connection
to the database.
Type a name for your data source in the Name text box. This name is used only
for identification and can be anything you choose. Next, use the Type drop-down
to select the type of database system that the data source will use. The default value
is Microsoft SQL Server, but you can also choose OLE DB, Microsoft SQL Server
Analysis Services, Oracle, or ODBC. Next, in the Connection String box input
the connection string that’s required to connect to the target database. If you’re
unfamiliar with the connection string values, you can click Edit to display the Data
Link dialog, which will step you through the creation of the Data Source.
Next, de-select the Generic Query Designer button. The interactive Query Builder
tool will be loaded into the design surface under the Data tab. The Query Builder
Figure 9-16 Add New Item
Chapter 9: Reporting Services 367
is a query design tool that enables you to build SQL queries without needing to be
a SQL expert. However, to effectively use the Query Design tool, you still need
to have a good basic knowledge of your database’s design and scheme. You can
select tables from your database by right-clicking in the top portion of the Query
Builder and then selecting Add Table from the pop-up menu to display the Add
Tables dialog. There you can select one or more tables (multiple tables are selected
by holding down the ctrl key and clicking the desired table). The Query Builder
will automatically detect any relationships between the tables in terms of matching
column names and data types and will draw links between the tables visually
showing the relationships.
After selecting the tables, you then select the desired columns from each table by
putting a check in the check box that precedes the column name. Checking the * (All
Columns) entry will automatically select all of the columns from the table. As you
interactively select the tables and columns and define the relationships between the
tables, the Query Designer automatically builds the SQL statement that will retrieve
data for your report. You can test the query by clicking the exclamation icon (!)
shown in the toolbar.
Figure 9-17 Select the data source
368 Microsoft SQL Server 2005 Developer’s Guide
Parameterized Queries
The Query Builder can also be used to build parameterized queries where the end
user supplies a value to the query at run time. To build a parameterized query using
the Query Builder, you simply type a question mark into the Filter column that’s in
the row of the database column name that you want to use with a parameter. The
Query Builder will automatically convert the question mark character to the =@
Param value.
After you’ve completed designing the query, click the Layout tab to display the
report layout in the design surface area. Click the Toolbox tab on the left side of
the environment to display a list of report items that you can drag and drop onto
the report design surface. The standard report items that you can place on your
report are: Textbox, Line, Table, Matrix, Rectangle, List, Image, Subreport, and
Chart. Figure 9-18 shows an example of the report layout design area with several
report items added to it.
You can associate the report items with fields from the data source by right-
clicking the report item and selecting the Properties option from the pop-up menu.
A Properties dialog will be displayed allowing you to customize the report item.
Figure 9-18 Report layout design
Chapter 9: Reporting Services 369
Click the Value drop-down box to list the fields available from the data source and
select the field you want to relate to the report item. You can see in Figure 9-18 that
the textbox1 item has been related to the field CustomerKey.Value.
After your report design is completed and the appropriate report items have been
linked to fields in the data source, you can select the Preview tab to render the report
for you to view in the Report Designer’s Preview window. When you are satisfied
with your report design, you can then generate and deploy your report to the Report
Server.
Deploying a Reporting Services Report
After the report has been created, the next step in creating a Reporting Services
application is to build the report and deploy it to the Report Server. Building the
report creates a .NET DLL assembly, and deploying the report copies that assembly
to the Reporting Services Report Server. You can deploy reporting solutions from the
Report Designer by selecting the Build | Deploy Reports option from the main menu.
If you select one of the deployment options and the report has been changed, the
Report Designer will automatically build the report before it is deployed. The output
from the build and deployment processes is shown in the Output window that you
can see at the bottom of Figure 9-18. Any errors or problems will be listed in the
window. Likewise, if the report deployment succeeds, then the success message is
listed in the Output window.
Running a Reporting Services Report
Reporting Services reports can be run by accessing their URL, through the Report
Manager, or by embedding them in your applications. You can access and run Reporting
Services reports using the URL, by pointing your browser to http://<servername>/
reportserver, where all of the Reporting Services reports and directories are listed.
The ReportServer URL lists all of the reports that have been deployed to the Report
Server. Each different solution is stored in its own subdirectory. Figure 9-19 shows the
ReportServer Web page.
You can also access reports through Report Manager Web-based tool. Point your
browser to the http://<servername>/reports directory to start the Report Manager.
The Report Manager not only lets you view reports, but you can also update and
manage reports with it. Figure 9-20 shows the Report Manager.
To test the reports that have been deployed, simply click the link and the Report
Server will render the report inside the browser. Figure 9-21 shows the example
report in the browser.
370 Microsoft SQL Server 2005 Developer’s Guide
Figure 9-19 Accessing Reporting Services reports from a URL
Figure 9-20 Accessing Reporting Services reports from the Report Manager
Chapter 9: Reporting Services 371
The report that’s rendered in the browser follows the format that was set up in the
report design phase. Running the reports directly from the Reporting Services URL
is great for testing, but when your application goes live, you’ll want to embed the
report URL in your application or access the Report Server via Web services calls.
Summary
The inclusion of Reporting Services is one of the most welcome enhancements
found in SQL Server 2005. By providing an extensive environment for designing,
managing, and deploying reports, Reporting Services goes beyond the possibilities of
simple reporting solutions like Access. In this chapter, you saw the Reporting Services
integrated development environment and learned about the SQL Server 2005 built-in
tools capable of generating powerful, flexible reports for your organization.
Figure 9-21 Running Reporting Services reports
This page intentionally left blank
373
CHAPTER
10
SQL Server
Integration Services
IN THIS CHAPTER
An Overview of SQL Server Integration Services
Creating Packages
Deploying Packages
Programming with the SQL Server Integration Services APIs
Copyright © 2006 by The McGraw-Hill Companies. Click here for terms of use.
374 Microsoft SQL Server 2005 Developer’s Guide
S
QL Server Integration Services is an all-new subsystem for SQL Server 2005.
With SQL Server 2005 Microsoft has replaced the old Data Transformation
Services (DTS) with the all-new SQL Server Integration Services (SSIS).
It’s important to understand that SSIS isn’t a reworked version of DTS. Instead,
Microsoft rewrote SSIS from the ground up. Microsoft’s goal for SQL Server 2005’s
Integration Services was to make it an enterprise ETL platform for Windows on
a par with any of the stand-alone enterprise-level ETL products. The new SSIS is
completely redesigned and built using managed .NET code, giving it a more robust
foundation. The new SSIS features a new graphical designer, a greatly enhanced
selection of data transfer tasks, better support for programmability and improved
run-time. In this chapter you’ll learn how to develop data integration packages using
SSIS. First, this chapter will start off by giving you an overview of the new SSIS.
Next, you’ll learn about how to create and deploy packages using the SSIS Designer.
Then this chapter will wrap up by showing you how you can create and run SSIS
packages programmatically using the Microsoft.SqlServer.Dts namespace.
NOTE
Don’t be confused by the DTS moniker in the namespace. SSIS is not built on top of DTS, nor does
it use any of the old DTS code. Microsoft simply didn’t get around to renaming the APIs to match
the name of the new subsystem.
An Overview of SQL Server Integration Services
The new Integration Services architecture is divided into two main sections: the Data
Transformation Pipeline (DTP) and the Data Transformation Runtime (DTR). The
split is designed to make a clear delineation between data flow and control flow. In
the previous versions of DTS, the data flow engine was stronger than the control
flow capabilities. This new division essentially makes the control flow portion of
SSIS a first-class component on the same level as the data flow component. The new
DTP essentially takes the place of the old DTS Data Pump that was used in the SQL
Server 7 and 2000. Its primary function is to handle the data flow between the source
and target destinations. The DTR is essentially a job execution environment that
controls the control flow that’s used in an SSIS package. Each of these components
exposes its own distinct object model that you can program against. In Figure 10-1
you can see an overview of the new SQL Server Integration Services architecture.
The new Integration Services DTP and DTR are discussed in more detail in the
following sections. More information about the new Integration Services tool set is
also presented later in this chapter.
Chapter 10: SQL Server Integration Services 375
Data Transformation Pipeline (DTP)
The DTP takes care of the data flow and transformations that take place as rows are
moved between the data source and the data target. DTP uses data adapters to connect
to the source and destination data sources. As you can see in Figure 10-1, the DTP
engine is accessed using the DTP Pipeline object model. This object model is the API
that is used by both the built-in transformations supplied by Microsoft and any user-
created custom transformations. Transformations move and optionally manipulate row
data as they move data from the source columns to the destination columns. You can
get a more detailed look at the new DTP architecture in Figure 10-2.
SQL Server 2005 provides a number of source and destination data adapters. Out
of the box, SQL Server 2005’s Integration Services comes with adapters for SQL
Server databases, XML, flat files, and other OLE DB–compliant data sources. While
the job of the data adapters is to make connections to the data’s source and destination
endpoints, the job of the transformations is to move and optionally manipulate the
data as it’s moved between the source and destination endpoints. Transformation can
be as simple as a one-to-one mapping between the source columns and the target
columns, or it can be much more complex, performing such tasks as selectively moving
columns between the source and target, creating new target columns using one-to-many
mappings, or computing derived columns. SQL Server 2005’s Integration Services
comes with a substantial number of built-in transformations. In addition to these built-in
transformations, you can build your own custom transformations by taking advantage of
the DTP object model API.
Figure 10-1 Integration Services architecture
376 Microsoft SQL Server 2005 Developer’s Guide
Data Transformation Runtime (DTR)
The DTR consists of the DTR engine and the DTR components. DTR components
are objects that enable you to govern the execution of SSIS packages. The DTR
components are used to build work flows, containers provide structured operations,
tasks provide data transfer and transformation functionality, and constraints control
the sequence of a work flow in a package. You can see an overview of the new DTR
architecture in Figure 10-3.
Figure 10-2 Data Transformation Pipeline components
DTP Overview
Output Columns
Source Data Adapter
Input Columns
Output Columns
Output Columns
Transformation
Destination Data Adapter
Input Columns
Figure 10-3 Data Transformation Runtime overview
Task
Task
Data Transformation Runtime
Package
Task
Task
Container
Task
Chapter 10: SQL Server Integration Services 377
The primary DTR components are packages, containers, and tasks. Tasks are
collections of DTR components; each task is composed of data sources and target
destinations as well as data transformations. Containers are used to organize and
structure related tasks. These containers and tasks are grouped together to form
packages. The Integration Services package is the physical unit that groups together
all of the functions that will be performed in a given transfer operation. Packages are
executed by the DTR to perform data transfers. Integration Services packages can be
easily rerun or even moved to a different system and executed stand-alone.
The primary purpose of the DTR engine is to control the execution of Integration
Services packages. The DTR controls the work flow of the tasks contained in
an Integration Services package. In addition, the DTR engine stores package layout;
runs packages; and provides debugging, logging, and event handling services. The
DTR engine also enables you to manage connections and access Integration Services
package variables.
The DTR is accessed using the DTR object framework. The DTR run-time object
framework is the API that supports the Integration Services Import/Export Wizard and
the Integration Services Designer in addition to the command-line dtexec tool. The
Import/Export Wizard and the Designer are used to create packages. Programs that use
the DTR object model can automate the creation and execution of Integration Services
packages as is shown later in this chapter.
Creating Packages
You can create SSIS packages in three ways: using the SSIS Import and Export Wizard,
using the SSID Designer, or programmatically using the DTR object model. In the next
section of this chapter you’ll see how to create SSIS interactively, first by using the
SSIS Import and Export Wizard and then by using the SSIS Designer.
Using the SSIS Import and Export Wizard
The SQL Server 2005 Integration Services SSIS Import and Export Wizard provides
a series of dialogs that lead you through the process of selecting the data source, the
destination, and the objects that will be transferred. The wizard also allows you to
optionally save and execute the SSIS package. Saving the packages generated with the
Integration Services Import/Export Wizard and then editing them in the Integration
Services Designer is a great way to learn more about Integration Services—especially if
you’re just getting started with Integration Services or if you’re transitioning to the new
SQL Server 2005 Integration Services from one of the earlier versions.
378 Microsoft SQL Server 2005 Developer’s Guide
You can start the Integration Services Import/Export Wizard by entering dtswizard
at the command line. The wizard steps you through the process of creating a package.
The first action is choosing a data source. In the Data Source drop-down, you select
the provider that you want to use. The connection options change depending on
the provider that you select. If you select the Microsoft OLE DB Provider for SQL
Server, you select the server that you want to connect to and then the database and
the type of authentication that you need to use. Clicking Next leads you through the
subsequent wizard dialogs. The next dialog allows you to select the data destination,
which is essentially identical to the data source dialog except that it defines where the
data will be transferred to. After you select the data source and destination, the wizard
prompts you to select the data to be transferred and then to optionally save and execute
the Integration Services package. As each task in the package executes, the transfer
window is dynamically updated, showing the Integration Services package’s transfer
progress.
Using the SSIS Designer
While the Integration Services Import/Export Wizard is useful for simple ad hoc
transfers, ETL (extraction, transformation, and loading) tasks typically require
significantly more sophistication and complex processing than the SSIS Import and
Export Wizard exposes. By their nature, ETL tasks are far more than just simple
data transfers from one destination to another. Instead, they often combine data from
multiple sources, manipulate the data, map values to new columns, create columns
from calculated values, and provide a variety of data cleanup and verification tasks.
That’s where the new Integration Services Designer comes into play. The Integration
Services Designer is a set of graphical tools that you can use to build, execute, and
debug SSIS packages.
Package Overview
In this example the package will be performing an FTP transfer; the results of that
FTP transfer will be a flat file; that flat file in turn will be transferred to a SQL Server
database. As the flat file is being transferred to the SQL Server database, a lookup
operation will occur that matches the incoming vendor product ID numbers to product
IDs contained in the AdventureWorks products table. If the lookup succeeds, then the
record with the corrected product ID will be written to the destination table. Otherwise,
if the lookup fails, the data will be written to a log file.
To build the SSIS package, you first start the SSIS Designer using the Business
Intelligence Development Studio (BIDS).