Biosignal and Biomedical Image Processing phần 1 pps
Bạn đang xem bản rút gọn của tài liệu. Xem và tải ngay bản đầy đủ của tài liệu tại đây (7.67 MB, 40 trang )
TLFeBOOK
Biosignal and
Biomedical Image
Processing
MATLA
B-Based
Applications
JOHN
L.
SEMMLOW
Robert Wood Johnson Medical School
New Brunswick, New Jersey,
U.S.A.
Rutgers University
Piscataway, New Jersey,
U.S.A.
MARCEL
MARCEL DEKKER,
INC.
'.p%
DEKKER
NEW
YORK
BASEL
TLFeBOOK
Although great care has been taken to provide accurate and current information, neither
the author(s) nor the publisher, nor anyone else associated with this publication, shall be
liable for any loss, damage, or liability directly or indirectly caused or alleged to be
caused by this book. The material contained herein is not intended to provide specific
advice or recommendations for any specific situation.
Trademark notice: Product or corporate names may be trademarks or registered trade-
marks and are used only for identification and explanation without intent to infringe.
Library of Congress Cataloging-in-Publication Data
A catalog record for this book is available from the Library of Congress.
ISBN: 0–8247-4803–4
This book is printed on acid-free paper.
Headquarters
Marcel Dekker, Inc., 270 Madison Avenue, New York, NY 10016, U.S.A.
tel: 212-696-9000; fax: 212-685-4540
Distribution and Customer Service
Marcel Dekker, Inc., Cimarron Road, Monticello, New York 12701, U.S.A.
tel: 800-228-1160; fax: 845-796-1772
Eastern Hemisphere Distribution
Marcel Dekker AG, Hutgasse 4, Postfach 812, CH-4001 Basel, Switzerland
tel: 41-61-260-6300; fax: 41-61-260-6333
World Wide Web
The publisher offers discounts on this book when ordered in bulk quantities. For more
information, write to Special Sales/Professional Marketing at the headquarters address
above.
Copyright 2004 by Marcel Dekker, Inc. All Rights Reserved.
Neither this book nor any part may be reproduced or transmitted in any form or by any
means, electronic or mechanical, including photocopying, microfilming, and recording,
or by any information storage and retrieval system, without permission in writing from
the publisher.
Current printing (last digit):
10987654321
PRINTED IN THE UNITED STATES OF AMERICA
TLFeBOOK
To Lawrence Stark, M.D., who has shown me the many possibilities
TLFeBOOK
TLFeBOOK
Series Introduction
Over the past 50 years, digital signal processing has evolved as a major engi-
neering discipline. The fields of signal processing have grown from the origin
of fast Fourier transform and digital filter design to statistical spectral analysis
and array processing, image, audio, and multimedia processing, and shaped de-
velopments in high-performance VLSI signal processor design. Indeed, there
are few fields that enjoy so many applications—signal processing is everywhere
in our lives.
When one uses a cellular phone, the voice is compressed, coded, and
modulated using signal processing techniques. As a cruise missile winds along
hillsides searching for the target, the signal processor is busy processing the
images taken along the way. When we are watching a movie in HDTV, millions
of audio and video data are being sent to our homes and received with unbeliev-
able fidelity. When scientists compare DNA samples, fast pattern recognition
techniques are being used. On and on, one can see the impact of signal process-
ing in almost every engineering and scientific discipline.
Because of the immense importance of signal processing and the fast-
growing demands of business and industry, this series on signal processing
serves to report up-to-date developments and advances in the field. The topics
of interest include but are not limited to the following:
• Signal theory and analysis
• Statistical signal processing
• Speech and audio processing
v
TLFeBOOK
vi
• Image and video processing
• Multimedia signal processing and technology
• Signal processing for communications
• Signal processing architectures and VLSI design
We hope this series will provide the interested audience with high-quality,
state-of-the -art signal processing literature through research monographs, edited
books, and rigorously written textbooks by experts in their fields.
TLFeBOOK
Preface
Signal processing can be broadly defined as the application of analog or digital
techniques to improve the utility of a data stream. In biomedical engineering
applications, improved utility usually means the data provide better diagnostic
information. Analog techniques are applied to a data stream embodied as a time-
varying electrical signal while in the digital domain the data are represented as
an array of numbers. This array could be the digital representation of a time -
varying signal, or an image. This text deals exclusively with signal processing
of digital data, although Chapter 1 briefly describes analog processes commonly
found in medical devices.
This text should be of interest to a broad spectrum of engineers, but it
is written specifically for biomedical engineers (also known as bioengineers).
Although the applications are different, the signal processing methodology used
by biomedical engineers is identical to that used by other engineers such electri-
cal and communications engineers. The major difference for biomedical engi-
neers is in the level of understanding required for appropriate use of this technol-
ogy. An electrical engineer may be required to expand or modify signal
processing tools, while for biomedical engineers, signal processing techniques
are tools to be used. For the biomedical engineer, a detailed understanding of
the underlying theory, while always of value, may not be essential. Moreover,
considering the broad range of knowledge required to be effective in this field,
encompassing both medical and engineering domains, an in-depth understanding
of all of the useful technology is not realistic. It is important is to know what
vii
TLFeBOOK
viii Preface
tools are available, have a good understanding of what they do (if not how they
do it), be aware of the most likely pitfalls and misapplications, and know how
to implement these tools given available software packages. The basic concept
of this text is that, just as the cardiologist can benefit from an oscilloscope-type
display of the ECG without a deep understanding of electronics, so a biomedical
engineer can benefit from advanced signal processing tools without always un-
derstanding the details of the underlying mathematics.
As a reflection of this philosophy, most of the concepts covered in this
text are presented in two sections. The first part provides a broad, general under-
standing of the approach sufficient to allow intelligent application of the con-
cepts. The second part describes how these tools can be implemented and relies
primarily on the MATLAB software package and several of its toolboxes.
This text is written for a single-semester course combining signal and
image processing. Classroom experience using notes from this text indicates
that this ambitious objective is possible for most graduate formats, although
eliminating a few topics may be desirable. For example, some of the introduc-
tory or basic material covered in Chapters 1 and 2 could be skipped or treated
lightly for students with the appropriate prerequisites. In addition, topics such
as advanced spectral methods (Chapter 5), time-frequency analysis (Chapter 6),
wavelets (Chapter 7), advanced filters (Chapter 8), and multivariate analysis
(Chapter 9) are pedagogically independent and can be covered as desired with-
out affecting the other material.
Although much of the material covered here will be new to most students,
the book is not intended as an “introductory” text since the goal is to provide a
working knowledge of the topics presented without the need for additional
course work. The challenge of covering a broad range of topics at a useful,
working depth is motivated by current trends in biomedical engineering educa-
tion, particularly at the graduate level where a comprehensive education must
be attained with a minimum number of courses. This has led to the development
of “core” courses to be taken by all students. This text was written for just such
a core course in the Graduate Program of Biomedical Engineering at Rutgers
University. It is also quite suitable for an upper-level undergraduate course and
would be of value for students in other disciplines who would benefit from a
working knowledge of signal and image processing.
It would not be possible to cover such a broad spectrum of material to a
depth that enables productive application without heavy reliance on MATLAB-
based examples and problems. In this regard, the text assumes the student
has some knowledge of MATLAB programming and has available the basic
MATLAB software package including the Signal Processing and Image Process-
ing Toolboxes. (MATLAB also produces a Wavelet Toolbox, but the section on
wavelets is written so as not to require this toolbox, primarily to keep the num-
ber of required toolboxes to a minimum. ) The problems are an essential part of
TLFeBOOK
Preface ix
this text and often provide a discovery-like experience regarding the associated
topic. A few peripheral topics are introduced only though the problems. The
code used for all examples is provided in the CD accompanying this text. Since
many of the problems are extensions or modifications of examples given in the
chapter, some of the coding time can be reduced by starting with the code of a
related example. The CD also includes support routines and data files used in
the examples and problems. Finally, the CD contains the code used to generate
many of the figures. For instructors, there is a CD available that contains the
problem solutions and Powerpoint presentations from each of the chapters.
These presentations include figures, equations, and text slides related to chapter.
Presentations can be modified by the instructor as desired.
In addition to heavy reliance on MATLAB problems and examples, this
text makes extensive use of simulated data. Except for the section on image
processing, examples involving biological signals are rarely used. In my view,
examples using biological signals provide motivation, but they are not generally
very instructive. Given the wide range of material to be presented at a working
depth, emphasis is placed on learning the tools of signal processing; motivation
is left to the reader (or the instructor).
Organization of the text is straightforward. Chapters 1 through 4 are fairly
basic. Chapter 1 covers topics related to analog signal processing and data acqui-
sition while Chapter 2 includes topics that are basic to all aspects of signal and
image processing. Chapters 3 and 4 cover classical spectral analysis and basic
digital filtering, topics fundamental to any signal processing course. Advanced
spectral methods, covered in Chapter 5, are important due to their widespread
use in biomedical engineering. Chapter 6 and the first part of Chapter 7 cover
topics related to spectral analysis when the signal’s spectrum is varying in time,
a condition often found in biological signals. Chapter 7 also covers both contin-
uous and discrete wavelets, another popular technique used in the analysis of
biomedical signals. Chapters 8 and 9 feature advanced topics. In Chapter 8,
optimal and adaptive filters are covered, the latter’s inclusion is also motivated
by the time-varying nature of many biological signals. Chapter 9 introduces
multivariate techniques, specifically principal component analysis and indepen-
dent component analysis, two analysis approaches that are experiencing rapid
growth with regard to biomedical applications. The last four chapters cover
image processing, with the first of these, Chapter 10, covering the conventions
used by MATLAB’s Imaging Processing Toolbox. Image processing is a vast
area and the material covered here is limited primarily to areas associated with
medical imaging: image acquisition (Chapter 13); image filtering, enhancement,
and trans forma tion (Chapt er 11); and segmen tatio n, and registrati on (Chapter 12).
Many of the chapters cover topics that can be adequately covered only in
a book dedicated solely to these topics. In this sense, every chapter represents
a serious compromise with respect to comprehensive coverage of the associated
TLFeBOOK
x Preface
topics. My only excuse for any omissions is that classroom experience with this
approach seems to work: students end up with a working knowledge of a vast
array of signal and image processing tools. A few of the classic or major books
on these topics are cited in an Annotated bibliography at the end of the book.
No effort has been made to construct an extensive bibliography or reference list
since more current lists would be readily available on the Web.
TEXTBOOK PROTOCOLS
In most early examples that feature MATLAB code, the code is presented in
full, while in the later examples some of the routine code (such as for plotting,
display, and labeling operation) is omitted. Nevertheless, I recommend that stu-
dents carefully label (and scale when appropriate) all graphs done in the prob-
lems. Some effort has been made to use consistent notation as described in
Table 1. In general, lower-case letters n and k are used as data subscripts, and
capital letters, N and K are used to indicate the length (or maximum subscript
value) of a data set. In two-dimensional data sets, lower-case letters m and n
are used to indicate the row and column subscripts of an array, while capital
letters M and N are used to indicate vertical and horizontal dimensions, respec-
tively. The letter m is also used as the index of a variable produced by a transfor-
mation, or as an index indicating a particular member of a family of related
functions.* While it is common to use brackets to enclose subscripts of discrete
variables (i.e., x[n]), ordinary parentheses are used here. Brackets are reserved
to indicate vectors (i.e., [x
1
,x
2
,x
3
, ]) following MATLAB convention.
Other notation follows standard conventions.
Italics (“) are used to introduce important new terms that should be incor-
porated into the reader’s vocabulary. If the meaning of these terms is not obvi-
ous from their use, they are explained where they are introduced. All MATLAB
commands, routines, variables, and code are shown in the
Courier typeface
.
Single quotes are used to highlight MATLAB filenames or string variables.
Textbook protocols are summarized in Table 1.
I wish to thank Susanne Oldham who managed to edit this book, and
provided strong, continuing encouragement and support. I would also like to
acknowledge the patience and support of Peggy Christ and Lynn Hutchings.
Professor Shankar Muthu Krishnan of Singapore provided a very thoughtful
critique of the manuscript which led to significant improvements. Finally, I
thank my students who provided suggestions and whose enthusiasm for the
material provided much needed motivation.
*For example, m would be used to indicate the harmonic number of a family of harmonically related
sine functions; i.e., f
m
(t) = sin (2 π m t).
TLFeBOOK
Preface xi
T
ABLE
1 Textbook Conventions
Symbol Description/General usage
x(t), y(t) General functions of time, usually a waveform or signal
k, n Data indices, particularly for digitized time data
K, N Maximum index or size of a data set
x(n), y(n) Waveform variable, usually digitized time variables (i.e., a dis-
creet variable)
m Index of variable produced by transformation, or the index of
specifying the member number of a family of functions (i.e.,
f
m
(t))
X(f), Y(f) Frequency representation (complex) of a time function
X(m), Y(m) Frequency representation (complex) of a discreet variable
h(t) Impulse response of a linear system
h(n) Discrete impulse response of a linear system
b(n) Digital filter coefficients representing the numerator of the dis-
creet Transfer Function; hence the same as the impulse re-
sponse
a(n) Digital filter coefficients representing the denominator of the dis-
creet Transfer Function
Courier font
MATLAB command, variable, routine, or program.
Courier font
MATLAB filename or string variable
John L. Semmlow
TLFeBOOK
TLFeBOOK
Contents
Preface v
1 Introduction 1
Typical Measurement Systems 1
Transducers 3
Further Study: The Transducer 4
Analog Signal Processing 5
Sources of Variability: Noise 7
Electronic Noise 10
Signal-to-Noise Ratio 11
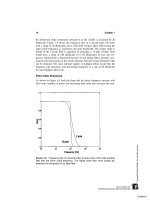
Analog Filters: Filter Basics 12
Filter Types 13
Filter Bandwidth 14
Filter Order 15
Filter Initial Sharpness 16
Analog-to-Digital Conversion: Basic Concepts 18
Analog-to-Digital Conversion Techniques 19
Quantization Error 20
Further Study: Successive Approximation 21
Time Sampling: Basics 24
Further Study: Buffering and Real-Time Data Processing 27
xiii
TLFeBOOK
xiv Contents
Data Banks 28
Problems 28
2 Basic Concepts 31
Noise 31
Ensemble Averaging 34
MATLAB Implementation 35
Data Functions and Transforms 37
Convolution, Correlation, and Covariance 43
Convolution and the Impulse Response 43
Covariance and Correlation 46
MATLAB Implementation 49
Sampling Theory and Finite Data Considerations 53
Edge Effects 57
Problems 58
3 Spectral Analysis: Classical Methods 61
Introduction 61
The Fourier Transform: Fourier Series Analysis 64
Periodic Functions 64
Symmetry 67
Discrete Time Fourier Analysis 67
Aperiodic Functions 69
Frequency Resolution 71
Truncated Fourier Analysis: Data Windowing 71
Power Spectrum 74
MATLAB Implementation 77
Direct FFT and Windowing 77
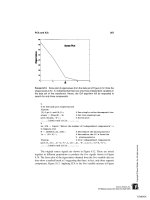
The Welch Method for Power Spectral Density Determination 80
Widow Functions 82
Problems 84
4 Digital Filters 87
The Z-Transform 87
Digital Transfer Function 88
MATLAB Implementation 90
Finite Impulse Response (FIR) Filters 93
FIR Filter Design 94
TLFeBOOK
Contents xv
Derivative Operation: The Two-Point Central Difference
Algorithm 97
MATLAB Implementation 101
Infinite Impulse Response (IIR) Filters 106
Filter Design and Application Using the MATLAB Signal
Processing Toolbox 108
FIR Filters 108
Two-Stage FIR Filter Design 109
Three-Stage Filter Design 111
IIR Filters 117
Two-Stage IIR Filter Design 118
Three-Stage IIR Filter Design: Analog Style Filters 119
Problems 123
5 Spectral Analysis: Modern Techniques 125
Parametric Model-Based Methods 125
MATLAB Implementation 131
Non-Parametric Eigenanalysis Frequency Estimation 136
MATLAB Implementation 138
Problems 144
6 Time–Frequency Methods 147
Basic Approaches 147
Short-Term Fourier Transform: The Spectrogram 148
Wigner-Ville Distribution: A Special Case of Cohen’s Class 149
Choi-Williams and Other Distributions 154
Analytic Signal 155
MATLAB Implementation 156
The Short-Term Fourier Transform 156
Wigner-Ville Distribution 162
Choi-Williams and Other Distributions 167
Problems 172
7 The Wavelet Transform 177
Introduction 177
The Continuous Wavelet Transform 178
Wavelet Time—Frequency Characteristics 180
MATLAB Implementation 183
TLFeBOOK
xvi Contents
The Discrete Wavelet Transform 186
Filter Banks 188
The Relationship Between Analytical Expressions and
Filter Banks 192
MATLAB Implementation 194
Denoising 200
Discontinuity Detection 203
Feature Detection: Wavelet Packets 206
Problems 210
8 Advanced Signal Processing Techniques:
Optimal and Adaptive Filters 213
Optimal Signal Processing: Wiener Filters 213
MATLAB Implementation 216
Adaptive Signal Processing 222
Adaptive Noise Cancellation 226
MATLAB Implementation 227
Phase Sensitive Detection 233
AM Modulation 234
Phase Sensitive Detectors 236
MATLAB Implementation 238
Problems 241
9 Multivariate Analyses: Principal Component Analysis
and Independent Component Analysis 243
Introduction 243
Principal Component Analysis 246
Order Selection 251
MATLAB Implementation 251
Data Rotation 251
Principal Component Analysis Evaluation 254
Independent Component Analysis 259
MATLAB Implementation 265
Problems 270
10 Fundamentals of Image Processing: MATLAB Image
Processing Toolbox 271
Image Processing Basics: MATLAB Image Formats 271
General Image Formats: Image Array Indexing 271
TLFeBOOK
Contents xvii
Data Classes: Intensity Coding Schemes 273
Data Formats 275
Data Conversions 275
Image Display 278
Image Storage and Retrieval 284
Basic Arithmetic Operations 285
Advanced Protocols: Block Processing 292
Sliding Neighborhood Operations 293
Distinct Block Operations 298
Problems 301
11 Image Processing: Filters, Transformations,
and Registration 303
Spectral Analysis: The Fourier Transform 303
MATLAB Implementation 305
Linear Filtering 308
MATLAB Implementation 310
Filter Design 311
Spatial Transformations 320
MATLAB Implementation 322
Affine Transformations 321
General Affine Transformations 324
Projective Transformations 326
Image Registration 331
Unaided Image Registration 333
Interactive Image Registration 337
Problems 339
12 Image Segmentation 343
Pixel-Based Methods 343
Threshold Level Adjustment 344
MATLAB Implementation 349
Continuity-Based Methods 352
MATLAB Implementation 353
Multi-Thresholding 360
Morphological Operations 362
MATLAB Implementation 364
Edge-Based Segmentation 368
MATLAB Implementation 371
Problems 372
TLFeBOOK
xviii Contents
13 Image Reconstruction 375
CT, PET, and SPECT 376
Fan Beam Geometry 382
MATLAB Implementation 383
Radon Transform 383
Inverse Radon Transform: Parallel Beam Geometry 385
Radon and Inverse Radon Transform: Fan Beam Geometry 388
Magnetic Resonance Imaging 390
Basic Principles 390
Data Acquisition: Pulse Sequences 394
Functional MRI 396
MATLAB Implementation 398
Principal Component and Independent Component Analysis 402
Problems 407
Annotated Bibliography 409
Index 413
TLFeBOOK
1
Introduction
TYPICAL MEASUREMENT SYSTEMS
A schematic representation of a typical biomedical measurement system is
shown in Figure 1.1. Here we use the term measurement in the most general
sense to include image acquisition or the acquisition of other forms of diagnostic
information. The physiological process of interest is converted into an electric
F
IGURE
1.1 Schematic representation of typical bioengineering measurement
system.
1
TLFeBOOK
2 Chapter 1
signal via the transducer (Figure 1.1). Some analog signal processing is usually
required, often including amplification and lowpass (or bandpass) filtering.
Since most signal processing is easier to implement using digital methods, the
analog signal is converted to digital format using an analog-to-digital converter.
Once converted, the signal is often stored, or buffered, in memory to facilitate
subsequent signal processing. Alternatively, in some real-time* applications, the
incoming data must be processed as quickly as possible with minimal buffering,
and may not need to be permanently stored. Digital signal processing algorithms
can then be applied to the digitized signal. These signal processing techniques
can take a wide variety of forms and various levels of sophistication, and they
make up the major topic area of this book. Some sort of output is necessary in
any useful system. This usually takes the form of a display, as in imaging sys-
tems, but may be some type of an effector mechanism such as in an automated
drug delivery system.
With the exception of this chapter, this book is limited to digital signal
and image processing concerns. To the extent possible, each topic is introduced
with the minimum amount of information required to use and understand the
approach, and enough information to apply the methodology in an intelligent
manner. Understanding of strengths and weaknesses of the various methods is
also covered, particularly through discovery in the problems at the end of the
chapter. Hence, the problems at the end of each chapter, most of which utilize
the MATLAB
TM
software package (Waltham, MA), constitute an integral part
of the book: a few topics are introduced only in the problems.
A fundamental assumption of this text is that an in-depth mathematical
treatment of signal processing methodology is not essential for effective and
appropriate application of these tools. Thus, this text is designed to develop
skills in the application of signal and image processing technology, but may not
provide the skills necessary to develop new techniques and algorithms. Refer-
ences are provided for those who need to move beyond application of signal
and image processing tools to the design and development of new methodology.
In subsequent chapters, each major section is followed by a section on imple-
mentation using the MATLAB software package. Fluency with the MATLAB
language is assumed and is essential for the use of this text. Where appropriate,
a topic area may also include a more in-depth treatment including some of the
underlying mathematics.
*Learning the vocabulary is an important part of mastering a discipline. In this text we highlight,
using italics, terms commonly used in signal and image processing. Sometimes the highlighted term
is described when it is introduced, but occasionally determination of its definition is left to responsi-
bility of the reader. Real-time processing and buffering are described in the section on analog-to-
digital conversion.
TLFeBOOK
Introduction 3
TRANSDUCERS
A transducer is a device that converts energy from one form to another. By this
definition, a light bulb or a motor is a transducer. In signal processing applica-
tions, the purpose of energy conversion is to transfer information, not to trans-
form energy as with a light bulb or a motor. In measurement systems, all trans-
ducers are so-called input transducers, they convert non-electrical energy into
an electronic signal. An exception to this is the electrode, a transducer that
converts electrical energy from ionic to electronic form. Usually, the output of
a biomedical transducer is a voltage (or current) whose amplitude is proportional
to the measured energy.
The energy that is converted by the input transducer may be generated by
the physiological process itself, indirectly related to the physiological process,
or produced by an external source. In the last case, the externally generated
energy interacts with, and is modified by, the physiological process, and it is
this alteration that produces the measurement. For example, when externally
produced x-rays are transmitted through the body, they are absorbed by the
intervening tissue, and a measurement of this absorption is used to construct an
image. Many diagnostically useful imaging systems are based on this external
energy approach.
In addition to passing external energy through the body, some images are
generated using the energy of radioactive emissions of radioisotopes injected
into the body. These techniques make use of the fact that selected, or tagged,
molecules will collect in specific tissue. The areas where these radioisotopes
collect can be mapped using a gamma camera, or with certain short-lived iso-
topes, better localized using positron emission tomography (PET).
Many physiological processes produce energy that can be detected di-
rectly. For example, cardiac internal pressures are usually measured using a
pressure transducer placed on the tip of catheter introduced into the appropriate
chamber of the heart. The measurement of electrical activity in the heart, mus-
cles, or brain provides other examples of the direct measurement of physiologi-
cal energy. For these measurements, the energy is already electrical and only
needs to be converted from ionic to electronic current using an electrode. These
sources are usually given the term ExG, where the ‘x’ represents the physiologi-
cal process that produces the electrical energy: ECG–electrocardiogram, EEG–
electroencephalogram; EMG–electromyogram; EOG–electrooculargram, ERG–
electroretini ogram ; and EGG–el ectro gastrogram. An exception to this terminology
is the electrical activity generated by this skin which is termed the galvanic skin
response, GSR. Typical physiological energies and the applications that use
these energy forms are shown in Table 1.1
The biotransducer is often the most critical element in the system since it
constitutes the interface between the subject or life process and the rest of the
TLFeBOOK
4 Chapter 1
T
ABLE
1.1 Energy Forms and Related Direct Measurements
Energy Measurement
Mechanical
length, position, and velocity muscle movement, cardiovascular pressures,
muscle contractility
force and pressure valve and other cardiac sounds
Heat body temperature, thermography
Electrical EEG, ECG, EMG, EOG, ERG, EGG, GSR
Chemical ion concentrations
system. The transducer establishes the risk, or noninvasiveness , of the overall
system. For example, an imaging system based on differential absorption of
x-rays, such as a CT (computed tomography) scanner is considered more inva-
sive than an imagining system based on ultrasonic reflection since CT uses
ionizing radiation that may have an associated risk. (The actual risk of ionizing
radiation is still an open question and imaging systems based on x-ray absorp-
tion are considered minimally invasive.) Both ultrasound and x-ray imaging
would be considered less invasive than, for example, monitoring internal cardiac
pressures through cardiac catherization in which a small catheter is treaded into
the heart chambers. Indeed many of the outstanding problems in biomedical
measurement, such as noninvasive measurement of internal cardiac pressures,
or the noninvasive measurement of intracranial pressure, await an appropriate
(and undoubtedly clever) transducer mechanism.
Further Study: The Transducer
The transducer often establishes the major performance criterion of the system.
In a later section, we list and define a number of criteria that apply to measure-
ment systems; however, in practice, measurement resolution, and to a lesser
extent bandwidth, are generally the two most important and troublesome mea-
surement criteria. In fact, it is usually possible to trade-off between these two
criteria. Both of these criteria are usually established by the transducer. Hence,
although it is not the topic of this text, good system design usually calls for care
in the choice or design of the transducer element(s). An efficient, low-noise
transducer design can often reduce the need for extensive subsequent signal
processing and still produce a better measurement.
Input transducers use one of two different fundamental approaches: the
input energy causes the transducer element to generate a voltage or current, or
the input energy creates a change in the electrical properties (i.e., the resistance,
inductance, or capacitance) of the transducer element. Most optical transducers
TLFeBOOK
Introduction 5
use the first approach. Photons strike a photo sensitive material producing free
electrons (or holes) that can then be detected as an external current flow. Piezo-
electric devices used in ultrasound also generate a charge when under mechani-
cal stress. Many examples can be found of the use of the second category, a
change in some electrical property. For example, metals (and semiconductors)
undergo a consistent change in resistance with changes in temperature, and most
temperature transducers utilize this feature. Other examples include the strain
gage, which measures mechanical deformation using the small change in resis-
tance that occurs when the sensing material is stretched.
Many critical problems in medical diagnosis await the development of
new approaches and new transducers. For example, coronary artery disease is a
major cause of death in developed countries, and its treatment would greatly
benefit from early detection. To facilitate early detection, a biomedical instru-
mentation system is required that is inexpensive and easy to operate so that it
could be used for general screening. In coronary artery disease, blood flow to
the arteries of the heart (i.e., coronaries) is reduced due to partial or complete
blockage (i.e., stenoses). One conceptually simple and inexpensive approach is
to detect the sounds generated by turbulent blood flow through partially in-
cluded coronary arteries (called bruits when detected in other arteries such as
the carotids). This approach requires a highly sensitive transducer(s), in this case
a cardiac microphone, as well as advanced signal processing methods. Results of
efforts based on this approach are ongoing, and the problem of noninvasive
detection of coronary artery disease is not yet fully solved.
Other holy grails of diagnostic cardiology include noninvasive measure-
ment of cardiac output (i.e., volume of blood flow pumped by the heart per unit
time) and noninvasive measurement of internal cardiac pressures. The former
has been approached using Doppler ultrasound, but this technique has not yet
been accepted as reliable. Financial gain and modest fame awaits the biomedical
engineer who develops instrumentation that adequately addresses any of these
three outstanding measurement problems.
ANALOG SIGNAL PROCESSING
While the most extensive signal processing is usually performed on digitized
data using algorithms implemented in software, some analog signal processing
is usually necessary. The first analog stage depends on the basic transducer
operation. If the transducer is based on a variation in electrical property, the
first stage must convert that variation in electrical property into a variation in
voltage. If the transducer element is single ended, i.e., only one element changes,
then a constant current source can be used and the detector equation follows
ohm’s law:
TLFeBOOK
6 Chapter 1
V
out
= I(Z +∆Z) where ∆Z = f (input energy). (1)
Figure 1.2 shows an example of a single transducer element used in opera-
tional amplifier circuit that provides constant current operation. The transducer
element in this case is a thermistor, an element that changes its resistance with
temperature. Using circuit analysis, it is easy to show that the thermistor is
driven by a constant current of V
S
/R amps. The output, V
out
,is[(R
T
+∆R
T
)/R]V
S
.
Alternatively, an approximate constant current source can be generated using a
voltage source and a large series resistor, R
S
, where R
S
>> ∆R.
If the transducer can be configured differentially so that one element in-
creases with increasing input energy while the other element decreases, the
bridge circuit is commonly used as a detector. Figure 1.3 shows a device made
to measure intestinal motility using strain gages. A bridge circuit detector is
used in conjunction with a pair of differentially configured strain gages: when
the intestine contracts, the end of the cantilever beam moves downward and the
upper strain gage (visible) is stretched and increases in resistance while the
lower strain gage (not visible) compresses and decreases in resistance. The out-
put of the bridge circuit can be found from simple circuit analysis to be: V
out
=
V
S
∆R/2, where V
S
is the value of the source voltage. If the transducer operates
based on a change in inductance or capacitance, the above techniques are still
useful except a sinusoidal voltage source must be used.
If the transducer element is a voltage generator, the first stage is usually
an amplifier. If the transducer produces a current output, as is the case in many
electromagnetic detectors, then a current-to-voltage amplifier (also termed a
transconductance amplifier) is used to produce a voltage output.
F
IGURE
1.2 A thermistor (a semiconductor that changes resistance as a function
of temperature) used in a constant current configuration.
TLFeBOOK