Atomic Force Microscopy in Cell Biology Episode 1 Part 10 ppt
Bạn đang xem bản rút gọn của tài liệu. Xem và tải ngay bản đầy đủ của tài liệu tại đây (401.25 KB, 20 trang )
166 Langer and Koitschev
between adjacent stereocilia, and (iii) the elastic properties of tip links and their connec-
tions to the transduction channel. Understanding the functional properties of the func-
tional unit formed by tip link and transduction channels requires separation of these three
effects. In this chapter, we show how this problem was addressed using an experimental
tool providing local access to individual stereocilia. The results obtained with the pre-
sented AFM/patch-clamp setup demonstrate that AFM is an appropriate technique to lo-
cally apply forces to individual stereocilia. This simplifies the calculation of stiffness and
actual displacement of the mechanosensory structures (iii) of an individual stereocilium.
The methods applyingforce to the entire hair bundle do notallow thediscrimination of the
contributions of the three interrelated structural components. Presented data confirm that
AFM allows local investigation of stereocilia stiffness. At small deflection amplitudes
lateral links produce only a weak increase of measured stereocilia stiffness, thereby
allowing local stimulation of single stereocilia by AFM. However, it may happen that
neighboring stereocilia are significantly displaced by directly pulling at the side links.
The transduction current amplitude measured was about twice that expected for a single
transduction channel. This might be explained in three different ways: (i) the AFM tip
pulled at two serially arranged tip links connecting adjacent stereocilia of different rows,
thereby opening one channel each; (ii) the AFM tip pulled at one tip link connected
with two transduction channels located at both ends of the tip link; (iii) the AFM tip
displaces the directly stimulated stereocilium and one adjacent stereocilium. These ques-
tions must be answered in future experiments measuring the effect of side link elasticity
on total stiffness as a function of stereocilium displacement. Presently, we can conclude
from AFM/patch-clamp measurements that only few transduction channels located very
near to the stimulating AFM tip contribute to the total current.
VI. Outlook
The combination of AFM and patch-clamp is not limited to the examination of hair
cells; it answers other questions in cell biology, such as, for example, the molecular
mechanism of voltage-dependent membrane displacements. Quite often AFM has been
used to identify ion channels in the plasma membrane of cells imaging the membrane
surface. High-resolution images of proteins in cell membranes were normally obtained
on rigid substrates such as, e.g., mica. However, it was difficult to identify ion channels
in plasma membranes of intact cells. Even if we identify lump-like structures on the
membrane surface appearing similar to the expected structure of the protein, we still
must be critical. It is currently impossible to exclude the fact that identified structures
correspond to a different type of protein appearing very similar to the protein we would
like to localize. In this case it would be very helpful to verify our observation using
a second independent technique such as patch-clamp. Patch-clamp could be used as
a tool for electrical stimulation of polar molecules in the membrane of whole cells
as ion channels while the AFM cantilever locally senses the resulting conformational
changes (Mosbacher et al., 1998). In first experiments Mosbacher et al. demonstrated
that the membrane movement of HEK293 cells became sensitive to the holding potential
7. Sensory Cells of Inner Ear Examined by AFM 167
after transfection with Shaker K
+
channels. The total movement remained in phase
with the displacement current of the highly charged transmembrane segment S4 to high
frequencies suggesting that Mosbacher et al. observed movement of the voltage sensor
region rather than changes in the pore gating transition. Using AFM and patch-clamp in
combination with chemical blockage, it should be possible to specifically identify ion
channels in the plasma membrane and to study their kinetics as well as the force exerted
by the ion channel.
Acknowledgments
I would like to thank Peter Ruppersberg for making this project possible and giving me the freedom to
independently do myscientificwork; J. K. H.H¨orber, for histechnical supportand helpful scientific discussions;
Stefan Fink, for his continuous support during experiments and reading this manuscript; and Alfons R¨usch, for
helpful discussions. I am grateful to Wolfgang
¨
Offner of the EMBL in Heidelberg for developing the reliable
and excellent AFM electronics. This work was financially supported by the Deutsche Forschungsgemeinschaft
(Klinische Forschergruppe H¨orforschung DFG Nr. Ze 149/6-2 and LA 1227/1-1) and the fortuene program
(Projects Nr. 347-2 and Nr. 712-0-0) of the University Clinic T¨ubingen.
References
Alexander, S., Hellemans, L., Marti, O., Schneir, J., Ellings, V., Hansma, P. K., Longmire, M., and Gurleey, J.
(1989). An atomic-resolution atomic-force microscope implemented using an optical lever. J. Appl. Phys.
65, 164–167.
Binnig, G., Gerber, C., and Quate, C. F. (1986). Atomic force microscope. Phys. Rev. Lett. 56(9), 930–933.
Binnig, G., and Smith, D. P. E. (1986). Single-tube three-dimensional scanner for scanning tunneling micro-
scopy. Rev. Sci. Instrum. 57,Issue 8, 1688–1689.
Denk, W., Holt, J. R., Shepherd, G. M., and Corey, D. P. (1995). Calcium imaging of single stereocilia in hair
cells: localization of transduction channels at both ends of tip links. Neuron 15(6), 1311–1321.
Florin, E. L., Moy, V. T., and Gaub, H. E. (1994). Adhesion forces between individual ligand-receptor pairs.
Science 1994 264(5157), 415–417.
Furness, D. N., and Hackney, C. M. (1985). Cross links between the stereocilia in the guinea pig cochlea.
Hear. Res. 18, 177–188.
Furness, D. N., Richardson, G. P., and Russell, I. J. (1989). Stereociliary bundle morphology in organotypic
cultures of the mouse cochlea. Hear. Res. 38(1–2), 95–109.
G´el´eoc, G. S. G., Lennan, G. W. T., Richardson, G. P., and Kros, C. J. (1997). A quantitive comparison of
mechanoelectrical transduction in vestibular and auditory hair cells of neonatal mice. Proc. Roy. Soc. Lond.
B 264, 611–621.
Gillespie, P. G. (1995). Molecular machinery of auditory and vestibular transduction. Curr. Opin. Neurobiol.
5(4), 449–455.
G¨oddenhenrich, T., Lemke, H., and Hartmann, U. (1990). J. Vac. Sci. Technol. A6, 383.
G¨oddenhenrich, T., M¨uller, S., and Heiden, C. (1994). A lateral modulation technique for simultaneous friction
and topography measurements with the atomic force microscope. Rev. Sci. Instrum. 65(9), 2870–2873.
Hoh, J. H., and Schoenenberger, C. A. (1994). Surface morphology and mechanical properties of MDCK
monolayers by scanning force microscopy. J. Cell Sci. 107(Pt 5), 1105–1114.
H¨orber, J. K. H., H¨aberle, W., Ohnesorge, F., Binnig, G., Liebich, H. G., Czerny, C. P., Mahnel, H., and Mayr,
A. (1992). Investigation of living cells in the nanometer regime with the scanning force microscope. Scan.
Microsc. 6, 919–930.
H¨orber, J. K., Mosbacher, J., H¨aberle, W., Ruppersberg, J. P., and Sakmann, B. (1995). A look at membrane
patches with a scanning force microscope. Biophys. J. 68(5), 1687–1693.
168 Langer and Koitschev
Howard, J., and Ashmore, J. F. (1986). Stiffness of sensory hair bundles in the sacculus of the frog. Hear. Res.
23(1), 93–104.
Howard, J., Roberts, W. M., and Hudspeth, A. J. (1988). Mechanoelectrical transduction by hair cells. Annu.
Rev. Biophys. Biophys. Chem. 17, 99–124.
Hudspeth, A. J., and Corey, D. P. (1977). Sensitivity, polarity, and conductance change in the response of
vertebrate hair cells to controlled mechanical stimuli. Proc. Natl. Acad. Sci. U.S.A. 74(6), 2407–2411.
Jaramillo, F., and Hudspeth, A. J. (1991). Localization of the hair cell’s transduction channels at the hair
bundle’s top by iontophoretic application of a channel blocker. Neuron 7(3), 409–420.
Langer, M. G., Fink, S., Koitschev, A., Rexhausen, U., H¨orber, J. K. H., and Ruppersberg, J. P. (2001). Lateral
mechanical coupling of stereocilia in cochlear hair bundles. Biophys. J. 80, 2608–2621.
Langer, M. G., Koitschev, A., Haase, H., Rexhausen, U., H¨orber, J. K., and Ruppersberg, J. P. (2000). Me-
chanical stimulation of individual stereocilia of living cochlear hair cells by atomic force microscopy.
Ultramicroscopy 82(1–4), 269–278.
Langer, M. G.,
¨
Offner, W., Wittmann, H., Fl¨osser, H., Schaar, H., H¨aberle, W., Pralle, A., Ruppersberg,
J. P., and H¨orber, J. K. H. (1997). A scanning force microscope for simultaneous force and patch-clamp
measurements on living cell tissues. Rev. Sci. Instrum. 68(6), 2583–2590.
Lenoir, M., Puel, J. L., and Pujol, R. (1987). Stereocilia and tectorial membrane development in the rat cochlea:
A SEM study. Anat. Embryol. 175, 477–487.
Lim, D. J. (1986). Functional structure of the organ of Corti: A review. Hear. Res. 22, 117–146.
Markin, V. S., and Hudspeth, A. J. (1995). Gating-spring models of mechanoelectrical transduction by hair
cells of the internal ear. Annu. Rev. Biophys. Biomol. Struct. 24, 59–83.
Marquis, R.E., andHudspeth, A. J. (1997). Effects of extracellular Ca2+concentration on hair-bundle stiffness
and gating-spring integrity in hair cells. Proc. Natl. Acad. Sci. U.S.A. 94(22), 11,923–11,928.
Martin, Y., Willams, C. C., and Wickramashinghe, H. K. (1987). Atomic force microscope-force mapping and
profiling on a sub 100-
˚
A scale. J. Appl. Phys. 61, 4723–4729.
Meyer, E. (1992). Atomic force microscopy. Prog. Surf. Sci. (UK) 41, 3–49.
Meyer, G., and Amer, N. (1988). Novel optical approach to atomic force microscopy. Appl. Phys. Lett. 53,
1054 ff.
Miller, G. L., Wagner, E. R., and Sleator, T. (1990). Resonant phase shift technique for the measurement of
small changes in grounded capacitors. Rev. Sci. Instrum. 61, 1267.
Mosbacher, J., Langer, M. G., H¨orber, J. K. H., and Sachs, F. (1998). Voltage-dependent membrane displace-
ments measured by atomic force microscopy. J. Gen. Physiol. 111(1), 65–74.
Neubauer, G., Cohen, S. R., McClelland, G. M., Horne, D., and Mate, C. M. (1990). Force microscopy with
a bidirectional capacitance sensor. Rev. Sci. Instrum. 61, 2296–2308.
Oesterhelt, F., Oesterhelt,D., Pfeiffer, M.,Engel, A., Gaub, H. E., and Muller,D. J. (2000). Unfolding pathways
of individual bacteriorhodopsins. Science 288(5463), 143–146.
Parpura, V., and Fernandez, J. M. (1996). Atomic force microscopy study of the secretory granule lumen.
Biophys. J. 71(5), 2356–2366.
Pickles, J. O., Comis, S. D., and Osborne, M. P. (1984). Cross links between stereocilia in the guinea-pig organ
of Corti, and their possible relation to sensory transduction. Hear. Res. 15, 103–112.
Radmacher, M.,Fritz, M., Kacher, C. M.,Cleveland, J. P., and Hansma, P. K.(1996). Measuring the viscoelastic
properties of human platelets with the atomic force microscope. Biophys. J. 70(1), 556–567.
Rotsch, C., and Radmacher, M. (2000). Drug-induced changes of cytoskeletal structure and mechanics in
fibroblasts: an atomic force microscopy study. Biophys. J. 78(1), 520–535.
Russell, I. J., and Richardson, G. P. (1987). The morphology and physiology of hair cells in organotypic
cultures of the mouse cochlea. Hear. Res. 31, 9–24.
Sakman, B., and Neher, E. (1995). “Single-Channel Recording,” Second Edition. Plenum Press, New York/
London.
Shroff, S. G., Saner, D. R., and Lal, R. (1995). Dynamic micromechanical properties of cultured rat atrial
myocytes measured by atomic force microscopy. Am. J. Physiol. 269(1, Pt 1), 286–92.
Siegel, J., Witt, J., Venturi, N., and Field, S. (1995). Compact large-range cryogenic scanner. Rev. Sci. Instrum.
66(3), 2520–2532.
7. Sensory Cells of Inner Ear Examined by AFM 169
Sobkowicz, H. M., Bereman, B., and Rose, J. E. (1975). Organotypic development of the organ of Corti in
culture. J. Neurocytol. 4(5), 543–572.
Tilney, L. G., and Tilney, M. S. (1986). Functional organization of the cytoskeleton. Hear. Res. 22, 55–77.
Vo n B ´ek´esy, G. (1960). “Experiments in Hearing,” p. 745. MacGraw-Hill, New York.
Zhao, Y., Yamoah, E. N., and Gillespie, P. G. (1996). Regeneration of broken tip links and restoration of
mechanical transduction in hair cells. Proc. Natl. Acad. Sci. U.S.A. 24, 93(26), 15,469–15,474.
Zine, A., and Romand, R. (1996). Development of the auditory receptors of the rat: A SEM study. Brain Res.
721, 49–58.
This Page Intentionally Left Blank
CHAPTER 8
Biotechnological Applications
of Atomic Force Microscopy
Guillaume Charras,
∗
Petri Lehenkari,
†
and Mike Horton
∗
∗
Bone and Mineral Center
Department of Medicine
The Rayne Institute
University College London
London, WC1E 6JJ
United Kingdom
†
Departments of Surgery and Anatomy
University of Oulu
Oulu
Finland
I. Introduction
II. Methods
A. Microscope–AFM Interface
B. Integrating AFM with Confocal Microscopy and/or Frame Grabbing
C. Confocal Microscope Settings for Use with AFM
D. Increased z-Range Scanner
E. Tip Modifications and Derivatization
III. Analysis
A. Binding Force Measurements on Intact Cells
B. Binding Map Analysis
C. Material Property Analysis
D. Induced Strain Calculation
E. Interfacing AFM Measurements with Finite Element Modeling Techniques
IV. Application Examples
A. Measurement of Adhesion Force of α
v
β
3
Integrin on Osteoclasts
B. Functional Receptor Mapping of Receptors on Live Osteoclasts
C. Simultaneous AFM and Confocal Imaging of Live Cells
D. Mechanical Stimulation of Live Osteoblasts
E. Biomechanics
METHODS IN CELL BIOLOGY, VOL. 68
Copyright 2002, Elsevier Science (USA). All rights reserved.
0091-679X/02 $35.00
171
172 Charras et al.
V. Future Directions and Improvements
A. Problems To Be Solved
B. Pharmaceutical Applications and Future Directions
References
I. Introduction
Ever since the invention ofthe atomic force microscopein 1986 by Binniget al. (1986),
atomic force microscopy (AFM) has been extensively applied to the study of a variety
of biological phenomena. Indeed, AFM has several advantages that make it particularly
attractive to cell biologists. First, it can yield high-resolution spatial images of live cells
under near physiological conditions. Second, due to the ability of the AFM to measure
forces, it has become possible to evaluate physical parameters in biological materials,
such as material properties and binding forces, which had previously been inaccessible.
To date, AFM applications in cell biology can be classified into five broad categories:
imaging, material property measurements, binding force measurements, biophysics, and
micromanipulation studies.
Several authors have studied the innocuity of AFM imaging on living cells. Using
cells incubated with a cytoplasmic fluorescent dye, Parpura et al. (1995) showed that
standard AFM tips did not induce dye leakage from cells, but sharper tips did. Schaus
and Henderson (1997) showed that cells imaged with AFM remained viable for up to
48 h postimaging. However, they also showed that phospholipid membrane components
accumulated on the tip during contact imaging. This phenomenon was not observed
when force–distance curves where repeatedly taken on cells. You et al. (2000) found
that continuous contact imaging for up to2hincontact mode induced cell retraction.
All of these results taken together show that AFM is only minimally disruptive to cells
when used for short periods of time.
Imaging is the most straightforward of AFM applications and has served, in particular,
to give biology a sense of space by enabling the three-dimensional visualization of
biological phenomena. (See the work by Jena and by Le Grimellec and Radmacher in
Chapters 2, 3, and 4 in this book.) Imaging has now been extensively applied to a large
number of cell types and biological phenomena. Henderson et al. (1992) imaged the
dynamics of filamentous actin in living glial cells. Lal and co-workers (Shroff et al.,
1995) imaged the outgrowth of neurites and witnessed cytoskeletal reorganization. In a
particularly valuable study, Kuznetsov et al. (1997) examined both the motility and the
division of living cells. Nuclear pores and their conformational changes in responses to a
varietyof compounds were examinedby Dankerand Oberleithner (2000).Schneider etal.
(1997) observed the membrane mechanisms involved in exocytosis. M¨uller (M¨uller and
Engel, 1999) examined the molecular structure of the porin, Ompf, and its rearrangement
in response to voltage changes (Engel and M¨uller, 2000.) (See also Chapter 13 in this
work by M¨uller and Engel.) Many of these results would have be unobtainable using
other imaging techniques.
8. AFM and Cell Biology 173
By taking force–distance curves over a whole grid and analyzing each force–distance
curve, AFM enables the material properties of cells to be estimated (Radmacher, 1997;
Weisenhorn et al., 1993). Although the material properties of cells can be assessed using
other techniques such as micropipette aspiration, laser tweezers, or microbead pulling,
AFM offers the unique combination of high-degree precision in spatial resolution in
material property measurement and the possibility of obtaining measurements from
cells spread on substratum. This latter application is the subject of another chapter of
this book. (See Chapter 3 in this work by Le Grimellec and co-workers and Chapter 4
in this work by Radmacher).
Whereas many measurements of binding forces between ligand and receptor adsorbed
to mica have been reported (Florin et al., 1994; Hinterdorfer et al., 1996) (see also
Chapters 6 and 14–16 in this work), there have been few attempts to apply this technique
to living cells. Recently, Lehenkari and Horton (1999) were the first to measure the bind-
ing forces between integrin receptors in intact cells and Arg–Gly–Asp (RGD) amino acid
sequence-containing extracellular matrix protein ligands. Using a modification of their
technique, Lehenkari et al. (2000) reported the first binding map of functional receptors
on living cells. In a similar study, Grandbois et al. (2000) showed that it was possible
to differentiate red blood cells of different blood groups within a mixed population by
using affinity imaging with the blood group A specific lectin from Helix pomatia.
Thanks to its capacity to measure cellular profiles and cellular material properties at
high resolution, AFM can be applied to biomechanical and biophysical problems. Davies
(1997) used high-resolution images of endothelial cells and computational fluid dynam-
ics to calculate the shear stresses on cells due to fluid flow. Sato et al. (2000) examined
the changes in material properties of bovine endothelial cells after exposure to fluid shear
stress. Charras and Horton (2002a) utilized the material properties and topographies of
live osteoblasts acquired using AFM as an input into finite element modeling software to
calculate the cellular strains resulting from a variety of mechanical stimuli. Several stud-
ies have taken advantage of the possibility of acquiring three-dimensional images of cells
to study real-time changes in cell volume. Schneider et al. (1997) measured the changes
in cell volume in endothelial cells upon exposure to aldosterone. Quist et al. (2000) used
AFM to investigate the modulation of cell volume by extracellular calcium levels and
showed that these were mediated through connexin protein containing gap junctions.
In the last category of applications, AFM has been used as an ultraprecise micro-
manipulator. Domke et al. (1999) used the AFM to map the mechanical pulse of cultured
cardiomyocytes. Thie et al. (1998) examined the adhesive forces between trophoblasts
and uterine epitheliumusing whole cellsinstead of isolatedmolecules to functionalizethe
tips. The adhesion forces recorded between cells were around 3 nN, which is an order
of magnitude higher than the molecule–ligand adhesion forces. Recently, Sagvolden
et al. (1999) developed a new use of AFM to quantify the adhesion forces of cells to
a substrate. Charras and colleagues (Charras et al., 2000; Charras and Horton, 2002b),
who used AFM to stimulate cells mechanically, measured cellular material properties
while monitoring the changes in intracellular calcium resulting from stimulation and
showed that cells exhibiting changes in intracellular calcium had been submitted to a
higher strain.
174 Charras et al.
In summary, over the years, AFM has shown that it has the potential to become a
crucial instrument in cell biology; however, to realize its full potential in this field, a
certain number of problems needed to be solved.
1. The AFM had to be interfaced to an optical microscope to be able to choose the
cell to be examined.
2. The cells had to be maintained in a near-physiological state during examination,
and the culture conditions had to be easily changeable during imaging.
3. As certain cell types are very tall and certain substrates very uneven, the z range of
the AFM had to be extended beyond the range that is commercially available for these
applications.
4. Phase-contrast and fluorescent imaging of the cells examined using AFM during
or postexperimentation had to be possible.
5. A fast and robust method for tip derivatization and tip modification had to be found.
(See also Chapter 6 by Hinterdorfer in this work.)
In this chapter, we shall provide examples of methodologies to address these issues
with cell biology in mind. We shall detail several postprocessing and experimental proto-
cols. To illustrate the use of these solutions and methodologies, we will show applications
taken fromour own research. Finally, weshall detail theproblems that remainto be solved
before large-scale application of AFM in cell biology. We shall also give our views on
possible uses of the AFM in both biotechnological and pharmaceutical industries.
II. Methods
A. Microscope–AFM Interface
In all of our own work that we cite in this review, we have exclusively used a Thermo-
microscopes (Topometrix) Explorer AFM. While the principles that we expound remain
general, it is entirely possible that some of the specific issues that we have encountered
or their solutions are “machine specific” and this should be taken into consideration by
the reader.
For use with AFM, the obvious choice of an optical microscope is one of “inverted”
design (Fig. 1). The microscope should be chosen preferably with several side ports
to easily integrate frame grabbing and confocal microscopy capabilities. Because the
microscope is a structure with large acoustic and thermal dimensions, it has the potential
to be a major source of vibrations within the system. We took several steps to eliminate
these. A commercially available air-floated table (TMS) was used upon which to install
the microscope. The microscope itself was vibrationally isolated from the table using
several layers of standard bubble wrap. Finally, the microscope–AFM interface was
designed to make the AFM and the microscope thermally and mechanically united
(Lehenkari et al., 2000).
The microscope–AFM interface has to satisfy a certain number of criteria so that
examination conditions are as close as possible to the physiological ones. Cells have to
8. AFM and Cell Biology 175
Fig. 1 The hybrid AFM–confocal microscope. Photograph (A) of the experimental setup and a cross-
sectional diagram (B) of the AFM-inverted microscope interface and optical path. The Thermomicroscopes
Explorer AFM (1) is fitted to the inverted microscope interface (2) that allows alignment of the tip into
the desired position, independent of the movement of the microscope stage (3) and the sample holder (4),
thus allowing the placement of the desired object into the AFM imaging point. This configuration allows
simultaneous light[phase-contrast and CCDcapture, (5)] and epifluoresecence confocalimaging [Bio-Rad side
port attachment,not shown (6)].Note that the AFM/AFM holder/sample holdercombination (2 + 4) iscapable
of vertical movement diminishing any interfering “noise” in the closed loop of the AFM-inverted microscope.
Reprinted fromUltramicroscopy 82, Lehenkari, P. P., Charras, G. T., Nyk¨anen, A., and Horton, M. A., Adapting
atomic force microscopy for cell biology, pp. 289–295. Copyright (2000), with permission from Elsevier
Science.
176 Charras et al.
be cultured under normal conditions on glass or plastic coverslips, as transparency is
needed to visualize them. It must also be possible to move the sample independently of
the AFM scanner head to select the cell to be examined and ensure that the whole cell
is within the xy range of the AFM scanner. The interface that we designed consisted of
two parts: the sample holder and the AFM holder.
The sample holder was designed to fit within the circular area at the center of the
microscope platen. In its center, a short, tapered tube was machined. The coverslip was
fitted into the central tube in a sandwiched layer consisting of a rubber O ring, the
coverslip, and another O ring, and finally, water tightness was ensured by screwing a
tapered, hard plastic ring within the tube.
The AFM holder consisted of two parts: first, a base plate that firmly fits to the micro-
scope stage. This base plate had a large circular aperture in the center to enable access
to the sample. A smaller plate could slide horizontally above the base plate. Several
kinematic mounting holes were machined in the top plate surface so that the AFM
mounts could be fit stably and located with precision. A circular aperture was cut in its
center to give access to the sample. Once the AFM and the optics were aligned, the top
plate could be immobilized with respect to the base plate by tightening two screws.
Medium exchange could be effected using a simple system that fitted above the sample
holder and beneath the AFM. This system consisted of two syringes linked to the sample
holder via small plastic tubes. One syringe was used to empty the chamber, whereas the
other contained the replacement medium.
Temperature could be controlled simply by fitting an external heating coil to the
underside of the microscope platen along with a temperature controller. When a CO
2
environmental chamber is not available, great care must taken to properly buffer the
culture medium to avoid abrupt pH changes.
B. Integrating AFM with Confocal Microscopy and/or Frame Grabbing
Taking images of the examined cell prior to and after AFM analysis may provide
information that is important to an experiment. This can be achieved simply by adding
an “off-the-shelf” CCD camera to the side port of the microscope and linking it to a
PC equipped with a frame-grabbing card. A simple single or series of phase contrast
optical images of the cell can be obtained by this method. Moreover, if a CCD camera
of sufficient sensitivity is used, fluorescence images can also be obtained (but see the
following discussion of confocal microscopy).
Alternatively, a confocal microscope can be integrated via the side port of the in-
verted microscope. This enables the monitoring of cellular reaction to AFM experimen-
tation using fluorescent reporter systems such as, for example, the calcium-sensitive
dye Fluo-3; fluorescent enzyme substrate activity indicators, as for caspases activated in
apoptosis; or cells transfected with green fluorescent protein (GFP) reporter gene con-
structs. There are a number of manufacturers that provide such add-on confocal laser
scanning capabilities, and great care must be taken in choosing the one that best suits the
particular AFM system used. Indeed, a number of mechanical parts within the confocal
laser scan head move during imaging. Scanning mirrors in the Bio-Rad confocal mi-
croscope are controlled by galvanometers and interference is potentially produced, but
8. AFM and Cell Biology 177
these have not proved to be problematic at the relatively low-resolution AFM being
applied. Other confocal microscopes may produce noise, but they have not been tested.
Other moving parts (dichroic filters, confocal apertures) are preset prior to imaging. The
remaining components are separated from the confocal scan head and unlikely to pro-
duce electrical/mechanical/thermal inteference. In our system, we found the Bio-Rad
Radiance 2000 system to be particularly well suited as many of the moving parts are
located in a separate box and therefore introduce no additional perturbation to the system.
C. Confocal Microscope Settings for Use with AFM
During confocal microscopy measurements, great care must taken to set the dichroic
wheel to separate red and green channels so that the laser light used in the AFM light
lever detection system can be eliminated. In our setup, decoupling at 560 nm worked
well. A band pass filter should also be used on the green channel to further eliminate red
laser bleed through. In our experimental setup, we used a 530- to 560-nm band pass filter.
The AFM and optical imaging z positions should also be as far apart as possible to reduce
stray light cross-talk. Furthermore, with certain cantilevers, there is a large reflection of
the confocal laser beam from the underside of the cantilever. If the fluorescent signal is
strong enough, this can be reduced by applying a polarizer to the emitted signal, as the
reflected light will be polarized in the same way as the light emitted by the laser source.
D. Increased z-Range Scanner
Cells can range anywhere between 100 nm (at the flat edge of a spread cell) and 50 μm
(at the top of the cell body) in height. Therefore, the maximum z range in commercially
available AFMs is not suited to the imaging of cells under certain conditions. The first
solution that springs to mind is to manufacture longer piezo-electric ceramics for the scan
heads. However, becauseideal piezo-electric crystalshave a linear response to the feeding
current, increasing the size of the piezo-electric ceramic results in a loss of accuracy and
linearity. To overcome this problem, we designed an AFM scanner head in which two
standard specification piezo-electric ceramics are electrically and mechanically coupled
in series but physically located parallel to the scan head. This allows the doubling of the
z range of the scanner without a large loss of accuracy (Fig. 2).
E. Tip Modifications and Derivatization
Several methods exist for tip derivatization and the subject is detailed in other chapters
(See Chapter 6 in this work by Hinterdorfer.) However, we have found a particularly
simple way of derivatizing AFM cantilevers. A solution of 10 mg/ml polyethylene
glycol (MW: 8000, Sigma Chemicals) was prepared in PBS. A drop of this solution was
deposited on a coverslip, and using the optical feedback camera of our AFM, the tip
was dipped in the PEG solution for 30 s at room temperature. Unbound PEG was then
washed off with PBS. On a fresh coverslip, a drop of the ligand to be used (concentration
>1 mg/ml) was deposited, and the tip was again dipped in the solution for 30 s. Unbound
ligand was washed off with PBS. One downfall of this simple passive chemisorption
178 Charras et al.
Fig. 2 Schematic illustration of the double z-range scanner head. The two piezo-ceramics function in series
and are located and offset in parallel inside a rigid cylinder that allows movement only in the z-direction
over a range of up to 20 μm. Reprinted from Ultramicroscopy 82, Lehenkari, P. P., Charras, G. T., Nyk¨anen,
A., and Horton, M. A., Adapting atomic force microscopy for cell biology, pp. 289–295. Copyright (2000),
with permission from Elsevier Science.
method is that only a limited number of binding measurements can be effected before
the ligand is desorbed. Therefore, the prolonged force–distance cycling required for
affinity mapping is not possible using this derivatization technique.
To remedy this, glass beads (Sigma) with diameters varying from 10 to 40 μm were
glued onto the cantilevers and derivatized as described previously. The bead-modified
tips are coated with a greater number of ligand molecules, and therefore affinity mapping
is possible due to the large number of ligand molecules present; hence, sufficient ligand
density is maintained on the glass bead tip in relation to the cell membrane contact
area. However, the estimation of the number of receptors in any location on the cell
is not possible, as the number of ligand molecules on the tip is unknown. The glass
beads were glued onto the cantilevers by dipping the cantilevers into UV-activatable
glue (GlassBond, Loctite), and particular care was taken to avoid depositing glue on
the top side of the cantilever. To ascertain that no glue had been deposited on the top
of the cantilever, the AFM gain was checked before and after coating. In case of failure,
the cantilevers can be cleaned by dipping them sequentially in 50% ethanol and acetone.
Dry beads were then settled onto a coverslip on the sample holder, and the AFM was
placed on top of the optical microscope. The cantilever was aligned with the chosen
bead and slowly lowered toward the bead. After touch down, the AFM was lifted off the
stage, the cantilever was taken off and exposed to daylight to crosslink the glue. Note that
cantilevers must be calibrated prior to bead gluing if any numerical values are needed.
III. Analysis
A. Binding Force Measurements on Intact Cells
Most receptors, such as integrin cell adhesion receptors, require optimal cellular sur-
roundings and organization within the plasma membrane in addition to association with
8. AFM and Cell Biology 179
lipids and accessory molecules to achieve their correct in vivo function and mechanical
binding properties. Therefore, it is imperative to investigate the binding properties of a
given receptor within its physiological cellular environment.
The actual analysis of the force–distance curve will not be detailed here, as it is the
subject of other chapters of this book, which we invite you to refer to. (See Chapters 6
and 14–16 in this work.)
Binding force measurements on cells may be facilitated by brief fixation (30 to 60 s)
in 2.5% paraformaldehyde in sucrose buffer. However, great care must be taken not
to overfix the cells because binding disappears due to the destruction of the receptor.
Moreover, this process is likely to be dependent upon the exact system under study–
integrins appear robust in this context, whereas multicomponent receptors or enzyme
complexes are likely to be less so. Furthermore, imaging the cells at low temperature
may help to reduce both their motility and the lateral movement of molecules within the
lipid bilayer.
As there is often a high receptor concentration at the cell surface, there may be several
unbinding events within the force–distance curve. Integrins may be present at mil-
lions of copies per cell, whereas growth factor receptors may be expressed at several
orders of magnitude less—this clearly may have large effects upon the fraction of force–
distance cycles that involve a receptor–ligand interaction. Each of these steps should
be measured, and a multipeak Gaussian fitting effected on the total binding force dis-
tribution in order to detect possible multiple adhesions and calculate minimal binding
that may approach single-molecule events. Studies of isolated macromolecule bind-
ing (for example, streptavidin–biotin) have shown a cantilever pull-off rate dependency
for the value of the minimum single-molecule binding force obtained (Merkel et al.,
1999). While such a detailed analysis involving thousands of force–distance measure-
ments is possible and appropriate, it is not feasible with cells which are delicate (cell
damage on repeated tip contact is likely) and motile (a really slow pull-off would be
impossible).
B. Binding Map Analysis
Binding map analysis is particularly useful for visualizing the location of receptors to
a given ligand when no antibody to this receptor exists or when the receptor has not yet
been identified. AFM may thus represent a viable alternative to single-cell autoradio-
graphy that uses radioisotopically labeled probes and is methodologically complex and
slow. Furthermore, it may help to determine whether a receptor that is detected through
immunostaining is actually functional in a given cell type.
Prior to analysis on a cell surface, a dry run should be effected on an area with no
cells to evaluate the extent of nonspecific binding. If nonspecific binding is present, steps
must be taken to eliminate it. Also, taking a phase-contrast image or a high-resolution
AFM image prior to binding map analysis will greatly help to visually localize the points
where receptor–ligand adhesion takes place. It is recommended not to take the image
after the analysis, as the cell may have reacted to the ligand that is being studied, such as
through an alteration in shape or rate of movement. A sensor response curve should be
180 Charras et al.
Fig. 3 Typical binding curve for an affinity map experiment. The out-of-contact part of the curve is used to
determine the mean value of the deflection and the standard deviation of the noise. The size of the adhesion
jump is compared to the size of the noise standard deviation, and if it is more than threefold greater there is a
99.7% chance of the jump being due to true adhesion.
taken on a hard material (e.g., the culture substrate) to obtain the conversion factor
between current (nA) and force (nN).
To effect a binding map analysis, one must first acquire force–distance curves in each
point of a grid superimposed to the cell surface. Thereafter, each force–distance curve
must be analyzed separately to search for an adhesion event. To do so, we suggest a
very simple method in which only the retraction curve is needed (Fig. 3). First, one must
evaluate a length of the retraction curves where the AFM tip is no longer in contact with
the cell in all of theforce–distance curves. Second, the mean andthe standard deviation of
the population of points where the tip is out of contact should be calculated. The tail-end
part of the curve can be approximated by a horizontal straight line. We assume that the
distribution of tip deflections when the tip is out of contact follows a normal distribution.
The experimental curve values can then be examined one by one from the last point
that was taken into account in the fitting of the tail end of the curve. A criterion for an
adhesion event can be derived using the standard deviation. For a normal distribution,
99.7% of the observations lie within 3 SD of the mean. Therefore, if a point of the curve
is further than 3 SD away from the mean of the tail end of the curve, adhesion is taking
place with a 0.3% possibility of error. This measurement can be effected without prior
flash fixing of the cells.
C. Material Property Analysis
1. Conical Tips
As this is the subject of another chapter of this book and we invite you to refer to it.
(See Chapters 3 and 4 in this work by Le Grimellec and co-workers and Radmacher.)
8. AFM and Cell Biology 181
2. Spherical Tips
This calculation needs prior determination of the radius of the sphere and cantilever
spring constant. The radius of the sphere can be measured simply by using a digitized
image of the sphere/cantilever system.
The material properties can be evaluated using the indentation of a Hertzian half-space
with a spherical indentor (Johnson, 1985; Weisenhorn et al., 1993). The indentation
resulting from the force F applied by spherical indentor onto the surface of a cell with
the elastic modulus E is
δ
spherical
=
3
4
F(1 − ν
2
)
E
1
√
R
2/3
,
where R is the radius of the spherical tipand ν is the localPoisson ratio. The loading force
F canbe obtained from the springconstant ofthe cantilever k and thedeflection d(F =kd).
Let z be the distance traveled by the AFM head and z0 be the height at contact. One
can express the change in height as a function of the deflection d, the initial deflection
d0 and the indention δ: z − z 0 = d − d0 + δ. The equation of the force–distance curve
after contact for the spherical indentor can be rewritten as (adapted from Radmacher
et al. (1996))
z − z0 = d − d0 +
3
4
k(1 −ν
2
)
E
1
√
R
2/3
(d − d0)
2/3
.
A good fit of this curve can be obtained by taking two points of the curve and solving for E
and z0 (Radmacher et al., 1996). The equation for the spherical indentor can be rewritten
as a third-degree equation and solved exactly using Cardano’s method (Arnaudies and
Fraysse, 1989) or iteratively using numerical methods. The elastic modulus obtained is
a measure of the compound local elasticity over the area of indentation.
D. Induced Strain Calculation
Because cells are responsive to mechanical stimuli, it can be informative to calculate
the strains induced in the cellular material by AFM indentation to attempt to correlate
cellular reaction to applied strain. The induced strain can only be calculated simply for
spherical tips. For conical tips, numerical methods such as finite element modeling must
be used.
From the elastic modulus and the force applied, one can calculate the strains applied
on the surface of the cell by a spherical indentor using the Hertzian theory of contact.
The total force P applied by a spherical indentor with a radius R to a surface with the
elastic modulus E (determined from the force–distance curve) creates an indentation
with a radius a (Johnson, 1985); for example
a =
3
4
PR(1 − ν
2
)
E
1/3
.
The relationship between the maximum pressure p 0 applied and the total load P applied
182 Charras et al.
by the AFM is (Johnson, 1985)
P =
2
3
π p
0
a
2
⇔ p
0
=
3
2
P
πa
2
.
Thereafter, one can determine the radial displacements
u
r
on the surface of the elastic
half-plane (Johnson, 1985) and from those the radial strains
ε
rr
at the surface can be
calculated as
ε
rr
(r) =
∂
u
r
(r)
∂r
=
(1 − 2ν)(1 + ν)
3E
a
2
r
2
p
0
1 −
1 −
r
2
a
2
3/2
−
(1 − 2ν)(1 + ν)
E
p
0
1 −
r
2
a
2
1/2
, r ≤ a
ε
rr
(r) =
∂
u
r
(r)
∂r
=
(1 − 2ν)(1 + ν)
3E
a
2
r
2
p
0
, r > a.
The strain distribution under the area of indentation has both a compressive and a tensile
component. Both the tensile and compressive components of the radial surface strain
can be calculated for each cell.
Calculation of the radial tangential or vertical strains within the cell thickness can only
be performed using finite element modeling techniques. However, a detailed description
of this technique is beyond the scope of this chapter and more details can be found in
Charras et al. (2000) and Charras and Horton (2002b).
E. Interfacing AFM Measurements with Finite Element Modeling Techniques
The simultaneous acquisition of cell topography and a map of the local material prop-
erties of the cellular material make AFM an ideal tool for interfacing with finite element
modeling techniques. After digital extraction of the cell from the image, topography can
be utilized to create the mesh of the cellular structure, and the material properties can
be grouped into several collectors and used to describe the local material properties of
the cell in the finite element model. As this application is very software dependent, one
needs to adapt the methodology depending on the AFM, postprocessing analysis, and
FEM software. Further details cannot be given here, but the reader is referred to Barbee
et al. (1995).
IV. Application Examples
A. Measurement of Adhesion Force of α
v
β
3
Integrin on Osteoclasts
Adhesion forces between an antibody, F11, to rat α
v
β
3
, or a linear RGD (Arg–Gly–
Asp) containing ligand (Lehenkari et al., 1999), and α
v
β
3
receptors on intact bone cells
(osteoclasts and osteoblasts) were measured (Fig. 4). Several unbinding events could
be observed in many cases. Multipeak Gaussian fitting revealed that they were integer
multiples of each other. Further, ligands which had predicted higher affinities for the
receptor gave greater binding forces, and the amino acid sequence/pH/divalent cation
8. AFM and Cell Biology 183
Fig. 4 Measuring interaction forces between ligands and cell-surface receptors by AFM. Interaction forces
were evaluated betweenF11 antibody molecules on theAFM cantilever tipand surface-expressed α
v
β
3
integrin
dimers on freshly isolated osteoclasts. (A) Analysis at high retraction speeds (50 μm/s) revealed a typically
large single release of multiple molecular interactions (the “jump” in the AFM retraction curve seen at +).
(B) Reduction of the retraction speed to 1 μm/s enabled a “stepwise” release of one or more binding events
to be visualized (each marked,
∗
) and quantitated. (C) Individual release forces were plotted as a histogram
and accumulate around certain values; these can be further analyzed by Gaussian curve fitting [as described in
Lehenkari and Horton (1999)]. (D) Results from (C) were tabulated, and since (A–D) show particular multiples
of a certain integral force, dividing the values of each group by the number of placements of the group within
the histogram, these results could be combined. The strategy employed here revealed that the binding force
between F11 and osteoclast α
v
β
3
is 127 ±16 pN (mean ± SD). Adapted from Lehenkari, P. P., and Horton,
M. A. (1999). Single integrin molecule adhesion forces in intact cells measured by atomic force microscopy.
Biochem. Biophys. Res. Commun. 259, 645–650, with permission from Academic Press.
184 Charras et al.
dependency of the receptor–ligand interaction examined by AFM was similar to that
observed under bulk measurement conditions using other techniques (Lehenkari and
Horton, 1999).
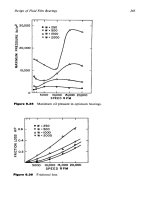
B. Functional Receptor Mapping of Receptors on Live Osteoclasts
VIP receptor mapping was carried out on live osteoclasts and analyzed with custom
written software as discussed earlier (Lundberg et al., 2000). VIP receptors appeared
to be localized mainly to the periphery and midzone of the osteoclast cell membrane
(Fig. 5).
C. Simultaneous AFM and Confocal Imaging of Live Cells
Mouse B16 melanoma cells were transfected with a green fluorescent protein (GFP)
reporter construct linked to F-Actin (Ballestrem et al., 1998). This cell was imaged with
the confocal microscope prior to AFM contact imaging. The shape of the cell is easily
recognizable and several features can be distinguished in both images. F-actin fibers
and focal adhesion structures are easily identified as can the nucleus in both images
(Fig. 6).
D. Mechanical Stimulation of Live Osteoblasts
Virtually all cell types have been reported to adapt to their mechanical environment
(Donahue et al., 1995). Among these, bone cells are particularly interesting, as bone is
a dynamic material that continually adapts its structure in response to mechanical usage
(Rubin and Lanyon, 1985).To assess cellular responses,we chose to monitor intracellular
calcium intensity changes as it is one of the very early and easily measurable responses
to mechanical stimulation. In this application, primary rat osteoblasts were stimulated
mechanically using 200μm V-shaped cantilevers with glass beads glued onto the tip.
The force applied was varied between 1 and 30 nN. Cells reacted either instantaneously
after the cantilever came into contact with the cell or when the cantilever was lifted off
the cell (Fig. 7).
E. Biomechanics
Cells respond to many different mechanical stimuli. Among these, fluid flow has often
been used to mechanically stimulate cells. Indeed, endothelial cells submitted to fluid
flow for 24 h align in the direction of the flow. Using computational fluid dynamics in
conjunction with acquisition of the cellular profile by AFM, Davies (1997) showed that
this change in alignment served to reduce the shear stresses on the cell surface of the
cells. In our application, we show the flow velocity over a live osteoblast. The AFM
topography image was acquired in contact mode, converted into a finite element mesh,
and the laminar flow of a viscous incompressible fluid was simulated over the cell surface
(shown here only in the center of the cell) (Fig. 8).
8. AFM and Cell Biology 185
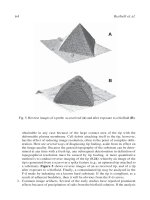
Fig. 5 Mapping receptordistribution in living cells.First a low-resolution topographic heightmap (A, in μm)
was created using the “ball” tip cantilever (hence, the low resolution of the image). The interaction forces
between vasoactive intestinal peptide (VIP) and its cellular receptor were analyzed by taking repeated force–
distance measurements across the entire surface of freshly isolated rat osteoclasts. Glucagon, a negative control
peptide, failed to show any binding under the same measurement conditions. This enabled the distribution of
the VIP–receptor binding forces on the cells to be evaluated (B, in nN). The two were then merged into an
image of the binding forces displayed on a pseudo-three-dimensional height image of a cell (C). The dashed
line shows the outline of the osteoclast; the arrows show the VIP binding sites in the midzone of the cell and
was also located at the top of the osteoclast (arrowhead); some nonspecific binding was seen at the glass surface
with test and control peptides. Adapted from Lundberg, P., Lie, A., Bjurholm, A., Lehenkari, P., Horton, M.,
Lerner, U. H., and Ransjo, M. (2000). Vasoactive intestinal peptide (VIP) regulates osteoclastic activity via
specific binding sites on both osteoclasts and osteoblasts. Bone 27, 803–810, with permission from Elsevier
Science.