ECONOMYUSA IN BRIEF phần 1 pptx
Bạn đang xem bản rút gọn của tài liệu. Xem và tải ngay bản đầy đủ của tài liệu tại đây (1.62 MB, 11 trang )
ECONOMY
U S A
I N B R I E F
1
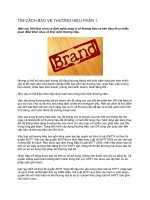
The port of Baltimore, like scores of other ports
on the East Coast, Gulf Coast, and West Coast,
demonstrates the increasing role of trade in the U.S.
economy.
George Washington addressing the
Constitutional Convention in Philadelphia, 1787.
3
dynamic economies overseas. And it faces challenges both at
home and abroad.
But what do we mean by the U.S. economy anyway?
Goods and Services
A
national economy comprises a country’s production
of goods and services. Real gross domestic product
(GDP) measures such output produced by labor and
property in the United States.
Workers use capital and natural resources to produce
goods and services. Natural resources are those supplied by
planet Earth: air, water, trees, coal, soil.
Capital includes physical capital: tools, machines,
technology (high and low). It includes intellectual property:
copyrights, patents, trademarks. It includes human capital:
training, skills, experience.
Most natural resources in the United States come from land
privately owned by individuals or corporations or leased from
governments at the national and state levels. Governments set
rules for using natural resources, such as controlling pollution.
The United States is rich in mineral resources, although
it has already passed the point of peak production for some,
including oil. It has much fertile farm soil and a moderate
climate. It has extensive coastlines on the Atlantic and Pacic
2
W
hen the United States sneezes, an economists’
proverb says, the rest of the world catches a cold.
Between 1995 and 2005, the United States
accounted directly for one-third of global economic expansion,
according to the nonprot Council on Competitiveness.
Between 1983 and 2004, soaring U.S. imports added nearly 20
percent of the increase of the world’s exports.
“Developing countries accounted for an increasing share of
U.S. exports, 32.8 percent in 1985 versus 47.0 percent in 2006,” a
Congressional Research Service (CRS) report says. “Developing
countries accounted for 34.5 percent of U.S. imports in 1985 and
54.7 percent in 2006.”
Like a rugged four-wheel-drive vehicle crossing rough
terrain, the U.S. economy cruised along in the early 2000s, even
while hitting some big rocks: a stock market crash, terrorist
attacks, wars in Iraq and Afghanistan, corporate accounting
scandals, widespread hurricane destruction, surging energy
prices, sliding real estate values.
After a mild recession in March-November 2001, the U.S.
economy resumed expanding, an average 2.9 percent during
2002-2006, while price ination, unemployment, and interest
rates remained relatively low.
By various measures the United States remains the world’s
most productive, competitive, and inuential large economy.
Yet more and more the U.S. economy is itself inuenced by
5
By various measures the United States accounts for
20 to 30 percent of world GDP. Purchasing power
parity is a conversion rate into a common currency
that equalizes the purchasing power of dierent
currencies.
4
through lower levels of management down to the foremen on
the shop oor.
Some businesses use a more exible organization,
especially in high-technology industries where skilled workers
develop, modify, and customize products rapidly. These
companies have “attened” their organizations, reducing
the number of managers and delegating more authority to
interdisciplinary teams of workers. Often teams form to carry
out a project and then disband when the project is completed,
with team members moving to new challenges with other
groups.
So what does the U.S. economy actually produce?
A Service Economy
S
ervices produced by private industry accounted for
67.8 percent of U.S. gross domestic product in 2006,
with real estate and nancial services such as banking,
insurance, and investment on top. Some other categories of
services are wholesale and retail sales; transportation; health
care; legal, scientic, and management services; education; arts;
entertainment; recreation; hotels and other accommodation;
restaurants, bars, and other food and beverage services.
Production of goods accounted for 19.8 percent of GDP:
manufacturing — such as computers, autos, aircraft, machinery
7
oceans and the Gulf of Mexico. Rivers ow from far within the
continent, and the ve Great Lakes on the border with Canada
provide additional shipping access. Extensive waterways,
railroads, highways, and air transportation shape the 50
individual states into a single economic unit.
Individuals or corporations own most U.S. technology
and other physical capital. The U.S. economy is especially
rich in information technology, accounting for major gains in
productivity over the past decade. Governments set rules for
buying, selling, and using capital.
Individuals, corporations, universities, and other research
institutions own intellectual property. Worldwide theft of U.S.
copyrighted lms, music CDs, and software, as well as patented
designs, is estimated at billions of dollars a year.
Since the United States abolished slavery during the Civil
War in 1863, all U.S. workers own their own labor and are free
to sell it to employers for wages or work for themselves — self-
employment. Governments set rules for hiring and employing
workers.
To produce goods and services, business managers
organize and direct labor, capital, and natural resources in
response to market signals. In a traditional business structure,
management works through a top-down chain of command.
In a typical factory, for example, authority ows from the chief
executive, who aims to run the entire business eciently,
6
Services such as banking, retail sales, transportation, and health care
account for two-thirds of the value of U.S. GDP.
9
— 12.1 percent; construction, 4.9 percent; oil and gas drilling
and other mining, 1.9 percent; agriculture, less than 1 percent.
Federal, state, and local governments accounted for the
rest — 12.4 percent of GDP.
The most rapidly expanding sectors are nancial services;
professional, scientic, and technical services; durable goods
manufacturing, especially computers and electronic products;
real estate; and health care.
Decreasing their share of GDP growth are agriculture and
mining and some other kinds of manufacturing, such as textiles.
Hills of corn in Kansas are reminders that agriculture, accounting for a small share of GDP,
remains an important part of the U.S. economy.
8
11
“Low-value, commodity-based manufacturing is disappearing
from the United States, moving to developing nations where
routine manufacturing can be performed at low cost,” the
Council on Competitiveness says.
Yet the United States remains the world’s top manufacturing
country, its factories producing goods worth $1.49 trillion in
2005, 1.5 times the level in the next country, Japan. And the
value of U.S. agricultural production trails that of only China and
India.
Even though agriculture now has a small share of GDP,
farmers remain economically and politically powerful forces.
In 2002 the market value of U.S. farm production amounted
to more than $200 billion, including $45 billion for cattle and
calves; nearly $40 billion for grains, such as corn and wheat,
and oilseeds such as soybeans; nearly $24 billion for poultry
and eggs; $20 billion for milk and other dairy products; and $12
billion for hogs and pigs.
Even though the United States has more than 2 million
farms, a relatively tiny number of big corporate farms
dominate — 1.6 percent of farms in 2002 accounted for half of
all sales.
Despite its overall trade decit, the United States has a
surplus in agriculture. U.S. farm exports in 2007 are forecast
at $78 billion, with the largest share going to Asian countries,
although Canada and Mexico account for the largest share of
10
While the United States maintains a trade surplus in services, it runs a
large decit in merchandise goods trade.
recent growth in agricultural exports. About one-fourth of U.S.
farm output is exported.
The United States also maintains a trade surplus in services,
$79.7 billion in 2006. The biggest U.S. services export category
was travel by foreigners to the United States, $85.8 billion that
year.
In contrast, the United States runs a large and growing
decit in merchandise goods trade. While the United States
exported more than $1 trillion in goods in 2006, it imported
more than $1.8 trillion worth.
By far the top imports that year were autos and auto parts,
$211.9 billion, and crude oil, $225.2 billion. The top sources of
U.S. imports were Canada, China, Mexico, Japan, and Germany.
Among the top U.S. exports in 2006 were autos and
auto parts, semiconductors, and civilian aircraft. The top U.S.
export destinations were Canada, Mexico, Japan, China, and the
United Kingdom.
In 2000-2006, even though U.S. goods exports increased 33
percent, U.S. goods imports went up even faster, 52 percent; the
goods decit nearly doubled over those years.
The $758.5 billion trade decit amounted to 5.7 percent of
2006 GDP, a level viewed as unsustainable by many economists
because it relies on continuing inows of foreign investment to
pay for it.
But what makes the U.S. economy so dynamic?
13
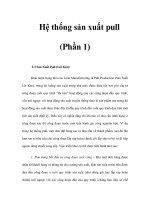
Construction accounts for nearly 5 percent of the U.S. economy; here a worker ts pipe on a
gasoline station under construction in Georgia.
12
The U.S. trade decit, by far the largest of any
country, amounted to 5.7 percent of GDP in 2006.
15
14
its commitment to market forces from the 1970s on by
dismantling regulations that had sheltered some industries
— such as trucking, airlines, and telecommunications — from
market competition for decades.
Vigorous competition and a regulatory system that
embraces technological change have made the U.S. economy
productive and provided American households with relatively
high incomes. U.S. productivity went up briskly in the 1990s,
with a peak 4.1 percent gain in 2002. This widened a lead over
the European Union and Japan, mostly by more eective
Trans World Airlines was one of the tens of thousands of businesses that le for bankruptcy
every year, some shutting down permanently.
17
Creative Destruction
W
ith a large land mass, natural resources, a
stable government, and a relatively well-
educated workforce, the U.S. economy has some
competitive advantages in the world marketplace. Importantly,
it also has a willingness to endure, even embrace, change.
The U.S. economic system reects what 20th-century
Austrian economist Joseph Schumpeter described as free-
market capitalism’s “creative destruction.” Jobs, companies,
entire industries come and go.
Even cities and regions expand and, if they cannot adjust
to change, contract — some old industrialized cities in the “Rust
Belt” of the Northeast and Midwest and some agricultural states
in the Great Plains have lost lots of people to other cities and
regions over decades.
In a free market, decisions about what to produce and what
prices to charge for products are made through the give and
take of independent buyers and sellers — sometimes a few,
sometimes millions — not by government or powerful private
interests. Prices set this way best reect the value of goods and
services and best guide production of what is most needed.
Americans also view free markets as a way of promoting
individual freedom and political pluralism and opposing
concentrations of power. The U.S. federal government renewed
16
General Electric, remains on the index now. Others disappeared
from the index as they were acquired by other companies, split
into smaller companies, became relatively smaller players in
the economy, or simply dissolved. Some of the companies that
replaced them started out as small businesses.
So does the large number of small businesses help explain
the U.S. economy’s dynamism?
Businesses Large and Small
S
mall businesses, those having fewer than 500
employees, loom large in the U.S. economy. They can
respond quickly to changing economic conditions
and customer needs with innovative technical solutions to
production problems. Their share of nonfarm GDP reached 50.7
percent in 2004.
“Of the nearly 26 million rms in the United States, most are
very small — 97.5 percent — have fewer than 20 employees,”
the U.S. Small Business Administration says. “Yet cumulatively,
these rms account for half of our nonfarm real gross domestic
product, and they have generated 60 to 80 percent of the net
new jobs over the past decade.”
Many entrepreneurs began by tinkering with hand-
assembled machines in a home garage. A few expanded small
businesses quickly into large, powerful corporations. Some
1918
application of information technology. Since then, productivity
gains have fallen o, only 1.6 percent in 2006.
A dynamic economy implies the freedom to fail. In the
United States, business failure does not carry the social stigma
it does in some countries. Failure, in fact, is often viewed as a
valuable learning experience for the entrepreneur, who may
succeed the next time.
In 2005 the U.S. government recorded the creation of about
671,800 businesses and the demise of about 544,800 others.
Many small, little-known businesses start up each year; some
succeed, some fail.
Tens of thousands of businesses enter bankruptcy each
year, and some of them shut down permanently. In 2005 more
than 39,000 businesses led for bankruptcy.
In the United States even well-known big businesses fail.
Trans World Airlines, United Air Lines, Delta Air Lines, Northwest
Airlines, US Airways, Continental Airlines, Eastern Airlines, and
Pan Am are just some of the major commercial airlines that have
led for bankruptcy since air travel deregulation in 1979 led
to more vigorous competition. Some have re-emerged; others
have disappeared forever, their assets scavenged by surviving
competitors.
Another measure of the U.S. economy’s dynamism: Of the
12 companies that Dow Jones listed in 1896 when it created its
famous stock index to represent the industrial sector, only one,