Aircraft Design: Synthesis and Analysis - part 8 docx
Bạn đang xem bản rút gọn của tài liệu. Xem và tải ngay bản đầy đủ của tài liệu tại đây (8.8 MB, 52 trang )
Materials
Choice of materials emphasizes not only strength/weight ratio but also:
● Fracture toughness
● Crack propagation rate
● Notch sensitivity
● Stress corrosion resistance
● Exfoliation corrosion resistance
Acoustic fatigue testing is important in affected portions of structure.
Doublers are used to reduce stress concentrations around splices, cut-outs, doors, windows, access panels, etc., and
to serve as tear-stoppers at frames and longerons.
Generally DC-10 uses 2024-T3 aluminum for tension structure such as lower wing skins, pressure critical fuselage
skins and minimum gage applications. This material has excellent fatigue strength, fracture toughness and notch
sensitivity. 7075-T6 aluminum has the highest strength with acceptable toughness. It is used for strength critical
structures such as fuselage floor beams, stabilizers and spar caps in control surfaces. It is also used for upper wing
skins.
For those parts in which residual stresses could possibly be present, 7075-T73 material is used. 7075-T73 material
has superior stress corrosion resistance and exfoliation corrosion resistance, and good fracture toughness. Typical
applications are fittings that can have detrimental preloads induced during assembly or that are subjected to
sustained operational loads. Thick-section forgings are 7075-T73, due to the possible residual stresses induced
during heat treatment. The integral ends of 7075-T6 stringers and spar caps are overaged to T73 locally. This
unique use of the T73 temper virtually eliminates possibility of stress corrosion cracking in critical joint areas.
Miscellaneous Numbers
Although the yield stress of 7075 or 2024 Aluminum is higher, a typical value for design stress at limit load is
54,000 psi. The density of aluminum is .101 lb / in
3
Minimum usable material thickness is about 0.06 inches for high speed transport wings. This is set by lightning
strike requirements. (Minimum skin gauge on other portions of the aircraft, such as the fuselage, is about 0.05
inches to permit countersinking for flush rivets.
On the Cessna Citation, a small high speed airplane, 0.04 inches is the minimum gauge on the inner portion of the
wing, but 0.05 inches is preferred. Ribs may be as thin as 0.025 inches. Spar webs are about 0.06 inches at the tip.
For low speed aircraft where flush rivets are not a requirement and loads are low, minimum skin gauge is as low as
0.016 inches where little handling is likely, such as on outer wings and tail cones. Around fuel tanks (inboard
wings) 0.03 inches is minimum. On light aircraft, the spar or spars carry almost all of the bending and shear loads.
Wing skins are generally stiffened. Skins contribute to compression load only near the spars (which serve as
stiffeners in a limited area). Lower skins do contribute to tension capability but the main function of the skin in
these cases is to carry torsion loads and define the section shape.
In transport wings, skin thicknesses usually are large enough, when designed for bending, to handle torsion loads.
Fuel density is 6.7 lb/gallon.
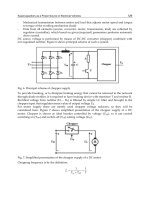
Structural Optimization and Design
Structures are often analyzed using complex finite element analysis methods. These tools have evolved over the
past decades to be the basis of most structural design tasks. A candidate structure is analyzed subject to the
predicted loads and the finite element program predicts deflections, stresses, strains, and even buckling of the many
elements. The designed can then resize components to reduce weight or prevent failure. In recent years, structural
optimization has been combined with finite element analysis to determine component gauges that may minimize
weight subject to a number of constraints. Such tools are becoming very useful and there are many examples of
substantial weight reduction using these methods. Surprisingly, however, it appears that modern methods do not do
a better job of predicting failure of the resulting designs, as shown by the figure below, constructed from recent Air
Force data.
>
Aircraft Weight Estimation
Overview
The multitude of considerations affecting structural design, the complexity of the load distribution
through a redundant structure, and the large number of intricate systems required in an airplane, make
weight estimation a difficult and precarious career. When the detail design drawings are complete, the
weight engineer can calculate the weight of each and every part thousands of them and add them all
up and indeed this is eventually done. But in the advanced design phase, this cannot be done because
there are no drawings of details. In the beginning, the advanced design engineer creates only a 3-view
and some approximate specifications. The rest of the design remains undefined.
One may start the design process with only very simple estimates of the overall empty weight of the
aircraft based purely on statistical results. Some of these correlations are not bad, such as the observation
that the ratio of empty weight to gross weight of most airplanes is about 50%. Of course, this is a very
rough estimate and does not apply at all to aircraft such as the Voyager or other special purpose designs.
One of the interesting aspects of this data is that it does not seem to follow the expected "square-cube"
law. We might expect that the stress in similar structures increases with the linear dimensions if the
imposed load is proportional to the structural weight because the latter grows as the cube of the linear
dimension while the material cross-section carrying the load grows as the square. There are several
reasons that the relationship is not so simple:
1. Some aircraft components are not affected very much by the square-cube law.
2. New and better materials and techniques have helped empty weight.
3. Higher wing loadings are used for larger aircraft.
4. Some portions of airplanes have material size fixed by minimum "handling" thickness.
The figures below show some of this effect. They are from a classic paper by F.A. Cleveland entitled,
"Size Effects in Conventional Aircraft Design" (J. of Aircraft, Nov. 1970).
" As might be expected there is a considerable diversity of scaling among components. This is
particularly apparent between the airframe components where the square-cube law has a strong influence,
as on the lifting surfaces, and those where it has little effect, as on the fuselage. The landing gear,
powerplant, and air-conditioning system, tend to increases gross weight, but the electrical system,
electronics, instruments ice-protection and furnishings are affected more by mission requirements than
by aircraft size. On balance, the overall factor of about 2.1 reflects the tendency of the square/cube law to
project a modestly increasing structural weight fraction with size."
The next step in weight estimation involves a component build-up, in much the same fashion as we
considered aircraft drag. This is the approach described here. It involves a combination of structural
analysis and statistical comparisons, with the complexity of the analysis dependent on the available
information and computational resources.
If the analysis is too simple or the statistical parameters are not chosen properly, these correlations have
dubious validity. In some cases such correlations can be expected to hold for a very restricted class of
aircraft, or to hold with accuracy sufficient for presentation only on log-log plots. It is very important that
the method be based on the fundamental physics of the design rather than on a ad-hoc correlation
parameter. One must also be cautious of the self-fulfilling nature of such correlations. If one expects,
based on historical precedent that a wing should weigh 20,000 lbs, one may work hard to reduce the
weight if the original design weighs 25,000 lbs. When the design is finally brought down to the initial
estimate the project leader may be satisfied, and the new design appears as a point on the next edition of
the plot.
The following sections provide methods for estimating the component weights for advanced design
purposes. Some of the sections (e.g. wing weight estimation) provide a more in-depth discussion of the
derivation of the method and comparisons with several aircraft. The correlations vary from fair to very
good, and provide a reasonable basis for estimating weights. They are based on a variety of sources, from
published methods of aircraft manufacturers to methods developed by NASA and some developed
originally here. We do not use Boeing's method or Douglas' method because these methods constitute
some of the most proprietary parts of the preliminary design systems in use at these companies.
Component Weight Methods
In the following sections, aircraft weights are divided into the following components. Each company
divides the weight into different categories, so it is sometime difficult to compare various components
from different manufacturers. Here we divide the system into the following categories:
Wing
Horizontal Tail
Vertical Tail
Fuselage
Landing Gear
Surface Controls
Propulsion System
APU
Instruments and Navigation
Hydraulics and Pneumatics
Electrical System
Electronics
Furnishings
Air Conditioning and Anti-Ice
Crew
Flight Attendants
Operating Items
Payload
Fuel
Sample Weight Statements
Companies typically present a summary of these items in an airplane weight statement. Some examples
are available from this link.
Total Weights
The component weights are grouped together to form a number of total weights that are routinely used in
aircraft design. This section lists some of the typical weights and their definitions.
Component Weights
1. Wing
The wing weights index is related to the fully-stressed bending weight of the wing box. It includes the
effect of total wing load (at the ultimate load factor, N
ult
), span (b), average airfoil thickness (t/c), taper
(λ), sweep of the structural axis (Λ
ea
), and gross wing area (S
wg
). The total wing weight is based on this
bending index and actual data from 15 transport aircraft.
Additional information on the wing weight
computation is provided from this link.
2. Horizontal Tail
The horizontal tail weight, including elevator, is determined similarly, but the weight index introduces
both exposed and gross horizontal tail areas as well as the tail length (distance from airplane c.g. to
aerodynamic center of the horizontal tail). The method assumes that the elevator is about 25% of the
horizontal tail area. Several sources suggest treating V-tails as conventional horizontal tails with the area
and span that would be obtained if the v-tail dihedral were removed.
3. Vertical Tail and Rudder
This graph shows the vertical fin (vertical tail less rudder) weight. The rudder itself may be assumed to
occupy about 25% of S
V
and weighs 60% more per unit area. The weight of the vertical portion of a T-
tail is about 25% greater than that of a conventional tail; a penalty of 5% to 35% is assessed for vertical
tails with center engines. (The formula below does not include the rudder weight, but S
v
is the area of the
vertical tail with rudder.)
4. Fuselage
Fuselage weight is based on gross fuselage wetted area (without cutouts for fillets or surface intersections
and upon a pressure-bending load parameter.
The pressure index is: I
p
= 1.5E-3 * P * B
The bending index is: I
b
= 1.91E-4 N * W * L / H
2
where: P = maximum pressure differential (lb / sq ft)
B = fuselage width (ft)
H = fuselage height (ft)
L = fuselage length (ft)
N = limit load factor at ZFW
W = ZFW
max
- weight of wing and wing-mounted engines, nacelles and pylons.
The fuselage is pressure-dominated when: I
p
> I
b
.
When fuselage is pressure dominated: I
fuse
= I
p
When fuselage is not pressure-dominated: I
fuse
= (I
p
2
+ I
b
2
) / (2 I
b
)
To better represent the distributed support provided by the wing, the effective fuselage length is taken to
be the actual fuselage length minus the wing root chord / 2.
The fuselage weight is then:
W
fuse
= (1.051 + .102 * I
fuse
) * S
fuse
Subtract 8.5% for all-cargo aircraft.
5. Landing Gear
Gear weight is about 4.0% of the take-off weight. This is the total landing gear weight including
structure, actuating system, and the rolling assembly consisting of wheels, brakes, and tires. The rolling
assembly is approximately 39% of the total gear weight:
W
gear
= 0.04 TOW
6. Surface Controls
Surface controls are the systems associated with control surface actuation, not the control surfaces
themselves. This system weight depends primarily on the area of the horizontal and vertical tails.
W
sc
= I
sc
* (S
H
+ S
V
)
where:
I
sc
= 3.5 (lb / sq ft) for fully-powered controls
2.5 for part-power systems
1.7 for full aerodynamic controls.
7. Propulsion System
The propulsion system weight is about 60% greater than that of the dry engine alone. The engine
structural section, or nacelle group, and the propulsion group which includes the engines, engine exhaust,
reverser, starting, controls, lubricating, and fuel systems are handled together as the total propulsion
weight. This weight, which includes nacelle and pylon weight, may be estimated as:
W
propulsion
= 1.6 W
engine dry weight
The correlation below may be used if engine dry weight is not available.
8. Auxiliary Power Unit (APU)
Smaller airplanes may not have an APU, but if it is there, its weight may be estimated by:
W
apu
(lbs) = 7 * N
seats
We will assume that there is no APU for airplanes with fewer than 9 seats.
9. Instruments and Navigational Equipment
W
Inst&Nav
= 100 lbs for business jet, 800 lb for domestic transport, 1200 lb for long range or overwater
operation.
10. Hydraulics and pneumatics
W
hyd&pneu
(lb)= .65 * S
ref
(ft
2
)
11. Electrical
W
electrical
(lb) = 13 * Nseats or use 1950. lbs for cargo aircraft. Note that this correlation does not work
well for smaller aircraft and should be replaced with a more representative value if known.
12. Electronics
W
electronics
= 300 lbs for business jet, 900 lbs domestic transport, 1500 lbs long range
13. Furnishings
Furnishings are often divided into accommodations proportional to the number of actual passenger seats
installed, and furnishings-other, which is a function of the total cabin size and is found as a function of
the number of all-coach passengers that can be fit into the fuselage.
Here we will not distinguish between the actual number of seats and the maximum number. Similarly, a
more accurate furnishings weight is based on the actual division of seats between first class and coach,
and the maximum number of seats that can be installed on the aircraft. For our purposes we simply use:
W
furnish
(lbs) (43.7 037*N
seats
)*N
seats
+ 46.*N
seats
When the number of seats exceeds 300, we use:
W
furnish
(43.7 037*300)*N
seats
+ 46.*N
seats
For overwater or long range aircraft, we add another 23 lbs per seat. For business jets, most anything is
possible.
14. Air conditioning and anti-ice
Data on these systems suggest a very large scatter. We use:
W
aircond
(lbs)= 15 * N
seats
although this is probably too high for very large aircraft.
15. Operating Items Less Crew
W
operitems
(lbs) = 17 * N
pax
, Short range, austere
28 * N
pax
, medium range, coach or business jet
40 * N
pax
, long range, first class
16. Flight Crew
W
crew
= 180 + 25 lbs per flight-deck crew member
17. Flight attendants
There are typically 20-30 pax / attend, although the FAA rules do not require this many. Currently flight
attendant weights include just 130 lbs and 20 lbs of baggage, although this would probably be considered
low by todays standards.
W
attend
= 130 + 20 lbs per attendant
18. Payload
Typically 205 lbs / passenger (165 per person + 40 lbs baggage) is used by major U.S. airlines. 210
lbs/passenger is sometimes assumed for international operations. One generally allocates 4.5 ft
3
per
passenger for baggage volume or 5.2 ft
3
for international operations.
The aircraft may also carry cargo as desired. An added cargo weight of 20lbs / pax is reasonable in the
determination of maximum zero fuel weight if no other guidelines are available. Typical passenger load
factors (actual / maximum) range from 60% to 70%.
For cargo aircraft 8.9 lbs/ft
3
is typical of containerized cargo, while bulk cargo occupies about 7.7 lb /
ft
3
. Typical cargo laod factors are 40% for containerized and 25% for bulk cargo.
Wing Weight
The wing weight is taken as the sum of two terms, a portion that varies directly with the wing area and a
part that varies in proportion to the amount of material required to resist the applied bending loads. This
estimate is done statistically, but is based on an index that is related to the weight of a fully-stressed
beam. A derivation is given here.
Wing Weight Breakdown
DC-8-55 DC-10-10 STOL Study
Wing Bending Material 13,115 21,830 5,983
Wing Spars, Webs,
Stiffeners
2,301 2,822 1,136
Bending, Spars, Webs,
Stiffners
15,416 24,652 7,119
Ribs 1,463 2,333 825
Wing Box Weight 22,718 33,623 10,387
Total Wing Weight 33,604 49,298 20,861
Bending / Total .387 .443 .287
Box / Total .676 .682 .498
Detailed Wing Weight Buildup
Item Weight (lbs)
Bending Material
upper surface
lower surface
13,211
14,250
Shear Material 4,004
Ribs and Bulkheads 4,570
Leading Edge 1,910
Trailing Edge 1,450
Tips 125
Slats and Supports 3,400
Spoilers and Supports 650
Ailerons and Supports 1,305
Flaps and Supports 5,960
Wing/Fuselage Fairing 960
Wing Fuselage Attach 1,000
Main Gear Doors 160
Exterior Finish 190
Primer and Sealant 30
Total 53,175
Derivation of the Wing Weight Index
Consider a section of a wing structural box assumed symmetrical about a neutral axis. If we consider
only the bending stress in the wing upper and lower skins, then, the bending moment is related to the
normal stress by:
M
b
= 2 σ
A
2
t
2
= σA
t
2
where M
b
is the bending moment at the spanwise section under consideration, t is the section thickness,
and A is the total cross sectional area of the stressed material. If the skins are carrying a given allowable
stress then:
σ
allow
=
2 M
b
(y)
tA
or:
A =
2 M
b
(y)
t σ
allow
The weight of this material is then:
W
b
= 2
⌠
⌡
b/2
0
ρA dy =
4 ρ
σ[t/ c]
⌠
⌡
b/2
0
M
b
c
dy
where an average value of t/c is used. If the wing has a linear chord distribution then:
c(y) =
S
b
(
2
1+λ
) (1-η(1 - λ))
where η is the dimensionless span statio, 2y/b. The wing bending moment is related to the lift by:
M
b
(y) =
⌠
⌡
b/2
y
l(y) y dy =
L
total
b
⌠
⌡
b/2
y
l
(L/b)
avg
y dy
Combining these expressions leads to:
W
b
=
4 ρ
σ[t/ c]
L
total
b
⌠
⌡
b/2
0
∫
y
b/2
[l/( (L/b)
avg
)]
y
/
c
dy dy
=
2 ρb
3
L
total
σS [t/ c]
⌠
⌡
1
0
∫
η
1
[l/( (L/b)
avg
)] [(η(1+λ))/( (1-η(1 - λ)))]dη dη
The double integral may be evaluated for a given shape of the lift distribution. When a simple shape is
assumed, the effect of sweep is added, and the total lift is set equal to the ultimate load factor times a sort
of average between zero fuel weight and maximum take-off weight, we obtain:
W
b
∝
ρb
3
n
ult
[√(ZFW) (TOW)] (1+2λ)
σS [t/ c] (1+λ)cos
2
Λ
The actual wing weight will be larger than this because the material is not fully-stressed and because
shear material is also needed. We correlate actual wing weights to this index to produce a wing weight
estimate.
Sample Aircraft Weight Statements
Small Commercial Aircraft
Larger Commercial Aircraft
Military Aircraft
* Estimated
Total Weights
The component weights are grouped together to form a number of total weights that are routinely used in
aircraft design. This section lists some of the typical weights and their definitions.
● Maximum Taxi Weight
● Maximum Brake Release Weight
● Maximum Landing Weight
● Maximum Zero-Fuel Weight
● Operational Empty Weight
● Manufacturer's Empty Weight
The weights are defined as follows:
MAXIMUM TAXI WEIGHT
The certified maximum allowable weight of the airplane when it is on the ground. This limit is
determined by the structural loading on the landing gear under a specified set of conditions and/or wing
bending loads.
MAXIMUM BRAKE RELEASE WEIGHT
The certified maximum weight of the airplane at the start of takeoff roll. Maximum Brake Release
Weight will always be less than Maximum Taxi Weight to allow for fuel burned during taxi. Brake
release weight, in operation, may be limited to values less than Maximum Brake Release Weight by
airplane performance, and/or airfield characteristics.
MAXIMUM LANDING WEIGHT
The certified maximum weight of the airplane at touch-down. This limit is determined by the structural
loads on the landing gear, but not under the same conditions that determine maximum taxi weight.
Landing weight, in operation, may also be limited to values less than Maximum Landing Weight by
airplane performance and/or airfield characteristics.
MAXIMUM ZERO FUEL WEIGHT
The maximum weight of the airplane without usable fuel.
OPERATIONAL EMPTY WEIGHT
Manufacturer's empty weight plus standard and operational items. Standard items include unusable fuel,
engine oil, emergency equipment, toilet fluid and chemicals, galley, buffet and bar structure, etc.
Operational items include crew and baggage, manuals and navigational equipment, removable service
equipment for cabin, galley and bar, food and beverages, life vests, life rafts, etc.
MANUFACTURER'S EMPTY WEIGHT
Weight of the structure, powerplant, furnishings, systems, and other items of equipment that are
considered an integral part of a particular airplane configuration. It is essentially a "dry" weight,
including only those fluids contained in a closed system (such as hydraulic fluid).
Other totals that are commonly used include:
Actual take-off weight
Maximum take-off weight
Landing weight
Zero payload weight
The airplane zero fuel weight is the sum of each of the components as shown below. Note that the actual
zero fuel weight is generally less than the maximum zero fuel weight. The maximum zero fuel weight,
may in fact exceed the zero fuel weight that is possible for this particular aircraft, but the structure is
designed to handle the larger values to accommodate future growth.
Wzfw = Wwing + Whoriz + Wvert + Wrud + Wfuse
+ Wcrew + Wopitems + Waircond + WElectn + WElectc
+ Wsurfc + Wgear + Whydpnu + Wpropul + WAttend
+ Wpax + Wbags + Wcargo + WOther
+ Winst + Wapu + Wfurnish
Wpayload = Wpax+Wbags+Wcargo
Wmt = Wzfw-(Wpayload+Wcrew+Wattend+Wopitems)
Wreserv = .08*Wzfw
Wfuel = TOW-Wzfw-Wreserv
Wnopay = Wmt+Wfuel+Wreserv+Wcrew+Wattend+Wopitems
Landing weight includes 1/2 maneuver fuel
Wland = Wzfw+Wreserv+.0035*TOW
Wowe = Wzfw-Wpayload
Interactive Placard Diagram
The placard diagram for your aircraft is shown above. The input parameters may be specified here and
are defined as follows:
Init. Cruise Altitude: Initial cruise altitude (ft)
Cruise Mach: Design cruise Mach number
Altitude at Vc:
Altitude for which the airplane is to be capable
of operating at the design Mach number (ft)
Note that the Vc altitude (also known as the "knee" of the placard) determines the maximum dynamic
pressure for which the aircraft is to be designed. Typical values for transonic aircraft are in the 26,000 -
28,000 ft range.
For SST's, the placard is often more complex, but one should choose the Vc altitude here to produce a
reasonable low altitude maximum speed. The Concorde, for example, has a Vc speed of about 400 kts
EAS up to 30,000 ft. A cruise Mach number of 2.0 and a Vc altitude of 57,000 ft leads to this value of
Vc. The Concorde actually allows higher q's above 32,000 ft, but for our calculations of gust loads, this
simpler placard will suffice.
Interactive V-n Diagram
The V-n diagram for your aircraft is shown above based on parameters specified elsewhere. See the
placard diagram for calculation of the design airspeeds Vc and Vd.