Báo cáo y học: "Ultrasound properties of articular cartilage in the tibio-femoral joint in knee osteoarthritis: relation to clinical assessment (International Cartilage Repair Society grade)" pptx
Bạn đang xem bản rút gọn của tài liệu. Xem và tải ngay bản đầy đủ của tài liệu tại đây (871.12 KB, 9 trang )
Open Access
Available online />Page 1 of 9
(page number not for citation purposes)
Vol 10 No 4
Research article
Ultrasound properties of articular cartilage in the tibio-femoral
joint in knee osteoarthritis: relation to clinical assessment
(International Cartilage Repair Society grade)
Hiroshi Kuroki
1
, Yasuaki Nakagawa
2
, Koji Mori
3
, Masahiko Kobayashi
2
, Ko Yasura
2
,
Yukihiro Okamoto
2
, Takashi Suzuki
2
, Kohei Nishitani
2
and Takashi Nakamura
2
1
Department of Physical Therapy, Human Health Sciences, Graduate School of Medicine, Kyoto University, 53 Kawahara-Cho, Shogoin, Sakyo-Ku,
Kyoto 606-8507, Japan
2
Department of Orthopaedic Surgery, Graduate School of Medicine, Kyoto University, 54 Kawahara-Cho, Shogoin, Sakyo-Ku, Kyoto 606-8507, Japan
3
Department of Applied Medical Engineering Science, Graduate School of Medicine, Yamaguchi University, 2-16-1 Tokiwadai, Ube, Yamaguchi 755-
8611, Japan
Corresponding author: Yasuaki Nakagawa,
Received: 2 Dec 2006 Revisions requested: 7 Feb 2007 Revisions received: 2 Jul 2008 Accepted: 13 Jul 2008 Published: 13 Jul 2008
Arthritis Research & Therapy 2008, 10:R78 (doi:10.1186/ar2452)
This article is online at: />© 2008 Kuroki et al.; licensee BioMed Central Ltd.
This is an open access article distributed under the terms of the Creative Commons Attribution License ( />),
which permits unrestricted use, distribution, and reproduction in any medium, provided the original work is properly cited.
Abstract
Introduction There is a lack of data relating the macroscopic
appearance of cartilage to its ultrasound properties. The
purpose of the present study was to evaluate degenerated
cartilage and healthy-looking cartilage using an ultrasound
system.
Methods Ultrasound properties – signal intensity (a measure of
superficial cartilage integrity), echo duration (a parameter
related to the surface irregularity) and the interval between
signals (that is, time of flight – which is related to the thickness
and ultrasound speed of cartilage) – of 20 knees were
measured at seven sites: the lateral femoral condyle (site A,
anterior; site B, posterior), the medial condyle (site C), the lateral
tibial plateau (site D, center; site E, under the meniscus) and the
medial tibial plateau (site F, anterior; site G, posterior). The sites
were evaluated macroscopically and classed using the
International Cartilage Repair Society (ICRS) grading system.
Results The signal intensity of grade 0 cartilage was
significantly greater than the intensities of grade 1, grade 2 or
grade 3 cartilage. Signal intensity decreased with increasing
ICRS grades. The signal intensity was greater at site B than at
site C, site D, site F and site G. The signal intensity of grade 0
was greater at site B than at site E. The echo duration did not
differ between the grades and between the sites. The interval
between signals of grade 3 was less than the intervals of grade
0, grade 1 or grade 2. The interval between signals at site C was
less than the intervals at site A, site B, site D, and site E.
Conclusion Site-specific differences in signal intensity suggest
that a superficial collagen network may be maintained in
cartilage of the lateral condyle but may deteriorate in cartilage of
the medial condyle and the medial tibial plateau in varus knee
osteoarthritis. Signal intensity may be helpful to differentiate
ICRS grades, especially grade 0 cartilage from grade 1
cartilage.
Introduction
Osteoarthritis is a degenerative disorder that progresses
slowly, characterized by erosive deterioration of articular carti-
lage. Changes in the cartilage structure and composition, in
morphologic and metabolic features, and in mechanical prop-
erties occur during the development and progression of
osteoarthritis.
Studies using high-frequency pulse-echo ultrasound have elu-
cidated several features of articular cartilage. Ultrasound may
provide information about the integrity of cartilage [1-5] and
the thickness of cartilage [1,6,7] by assuming a predefined
ultrasound speed within the tissue, and ultrasound assess-
ment of cartilage degeneration has been extensively studied
[8-15]. Although it is believed that osteoarthritis begins with
fibrillation of superficial cartilage and then progresses to the
deep zone of cartilage, the very early events that occur on the
surface of normal articular cartilage are unknown.
ICRS = International Cartilage Repair Society.
Arthritis Research & Therapy Vol 10 No 4 Kuroki et al.
Page 2 of 9
(page number not for citation purposes)
The International Cartilage Repair Society (ICRS) describes
cartilage standard evaluation as follows: grade 0, normal carti-
lage; grade 1, near-normal cartilage with superficial lesions;
grade 2, cartilage with lesions extending to <50% of the depth
of the cartilage; grade 3, cartilage with defects that extend to
>50% of the depth of the cartilage; and grade 4, severely
abnormal cartilage in which the cartilage defects reach
subchondral bone [16]. A study on the relationship between
ICRS grades and mechanical properties of articular cartilage
was reported recently [17]. The study mentioned that differen-
tiating between healthy cartilage and ICRS grade 1 cartilage
may be difficult using mechanical testing alone [17].
Ultrasound studies have revealed that high-frequency pulse-
echo ultrasound is sensitive for detecting degeneration of the
superficial collagen-rich cartilage zone [10], and that ultra-
sound detects microstructural changes up to a depth of 500
μ
m [18]. Ultrasound measurements also appear to be related
to changes in the extracellular matrix collagen and fibrillar net-
work organization [12]. To our knowledge, there are no ultra-
sound studies on ICRS grades. The purpose of our study was
therefore to investigate the relationship between ICRS grades
and ultrasound properties. In addition, site-specific differences
in the ultrasound properties of cartilage were investigated. We
hypothesized that the ultrasound response of articular carti-
lage would be related to its ICRS grading.
Methods
Patients
From January 2003 to March 2004, patients with knee oste-
oarthritis who were attending the knee clinic at the Depart-
ment of Orthopedic Surgery, Kyoto University Hospital, were
screened for eligibility to undergo total knee arthroplasty.
Patients who were diagnosed with varus knee osteoarthritis,
common in Japan, underwent total knee arthroplasty and were
involved in the present study. Twenty knees of 20 patients
(mean age, 76 years; age range, 68 to 83 years; two males
and 18 females) who gave informed consent to ultrasound
measurement of their articular cartilages were studied. During
the usual total knee arthroplasty procedure, after the knee joint
was opened, ultrasound evaluation of articular cartilage was
conducted at the femoral condyles and tibial plateaus in vivo.
After ultrasound evaluation, the articular cartilages and bone
were cut and trimmed for total knee arthroplasty.
We modified the ICRS articular cartilage injury mapping sys-
tem [16] and defined the seven sites of knee cartilage: site A,
femoral lateral condyle (anterior); site B, lateral condyle (pos-
terior); site C, medial condyle; site D, lateral tibial plateau
(center); site E, lateral tibial plateau (under the meniscus); site
F, medial tibial plateau (anterior); and site G, medial tibial pla-
teau (posterior) (Figure 1).
Ultrasound evaluation
Before ultrasound evaluation, cartilage at the seven sites was
evaluated macroscopically using the ICRS articular cartilage
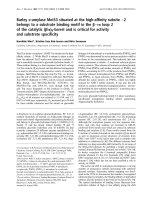
Figure 1
Anatomical location of the kneeAnatomical location of the knee. Site A, femoral lateral condyle (anterior); site B, lateral condyle (posterior); site C, medial condyle; site D, lateral
tibial plateau (center); site E, lateral tibial plateau (under the meniscus); site F, medial tibial plateau (anterior); site G, medial tibial plateau (posterior).
Rt, right; Lt, left.
Available online />Page 3 of 9
(page number not for citation purposes)
injury classification system to determine the grade of severity
of osteoarthritis. At least two surgeons joined in the macro-
scopic evaluation and agreed with the grading decision. After
the grading had been made, the signal intensity (a measure of
superficial cartilage integrity), the echo duration (a parameter
related to the surface irregularity) and the interval between sig-
nals (that is, time of flight – which is related to thickness and
ultrasound speed of cartilage) were measured using an ultra-
sound system that has been described previously [11,15,19].
Briefly, the ultrasound system consists of a transducer, a
pulser/receiver (Olympus NDT Japan Inc., Tokyo, Japan) and a
personal computer, and provides a method for quantitatively
evaluating articular cartilage (Figure 2a). The system can be
set up for arthroscopic use, for open surgery, or with a saline
bath for experimental measurement. The diameter of the trans-
ducer is approximately 3 mm and it is covered with a saline-
filled cone.
For the present study, the ultrasound system was set at a 10
MHz center frequency, the sampling frequency was 500 MHz,
no filtering or averaging was applied, and the system was set
up for open surgery. The nominal center frequency of the
transducers was 10 MHz (virtual center frequency, 12.6 MHz).
The bandwidth at -6 dB was 7.7 to 17.4 MHz. The target was
a 0.3175-cm diameter steel ball and the water path was
0.8509 centimeters, as per the manufacturer's instructions.
Using the wavelet transform for ultrasound reflection waves
from the cartilage surface and from the subchondral bone
[11,14,19], the three acoustic parameters (signal intensity,
echo duration and interval between signals of cartilage) could
be analyzed (Figure 2b). The wavelet transform is defined by
the following equation:
where the function f(t) is the ultrasound wave. The function
φ
a,
b
(t) is the mother wavelet ( is the complex conjugate of
φ
a, b
(t)), where a is a dilation parameter and b is a translation
parameter. In this system, we use the Gabor function as the
mother wavelet. The equation is given by:
where
ω
p
is the center of frequency and
λ
is the frequency
bandwidth.
In the present study,
ω
p
was set at 40 MHz and
λ
was set at
5.336. The
λ
values were selected to approximately satisfy the
Gabor function as and can be used
as the mother wavelet.
Three acoustic parameters were obtained from 510 points. A
few measurements were conducted for each of the 510 meas-
urement points, and finally the measurement in which the
highest reflection wave from the cartilage surface was
Wab
a
ft
tb
a
t
ab
,()
,
()
=
−
⎛
⎝
⎜
⎞
⎠
⎟
−∞
∞
∫
1
ϕ
d
ϕ
ab
t
,
()
ϕ
π
ω
γ
ω
γ
ω
t
pp
tit
p
()
=
⎛
⎝
⎜
⎜
⎞
⎠
⎟
⎟
−
⎛
⎝
⎜
⎜
⎞
⎠
⎟
⎟
+
⎧
⎨
⎪
⎩
⎪
⎫
⎬
⎪
⎭
⎪
1
4
1
2
12 2
ex p
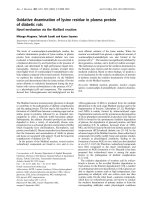
Figure 2
The ultrasound system, typical ultrasound echo and wavelet mapThe ultrasound system, typical ultrasound echo and wavelet map.
(a) The ultrasound measurement system employed, consisting of a
transducer, a pulser/receiver (i), a digital oscilloscope (ii) and a per-
sonal computer (iii). The system can be used with arthroscopy (iv, v),
open surgery (vi) or a saline bath (vii) for experimental measurement.
The ultrasound wave output from the transducer travels through the
saline. The reflected waves return to the transducer and generate elec-
trical signals that are proportional to their intensity. (b) Typical ultra-
sound echo (lower) and wavelet map (upper). The wavelet map was
calculated from the ultrasound echo using wavelet transform. The first
(left) of the two large-amplitude groups was the echo (t = 2.0 μs:
Group N) reflected from the cartilage surface, and the second (t = 3.9
μs: Group K) was reflected from the subchondral bone (right). The sig-
nal intensity (as shown by the scale) of Group N is a measure of super-
ficial cartilage integrity. The time interval between Group N and Group
K is related to thickness and ultrasound speed of cartilage. The echo
duration of Group N is a parameter related to the surface irregularity of
cartilage. See [20,30,31].
γπ
=≈2 2 5 336/ln.
Arthritis Research & Therapy Vol 10 No 4 Kuroki et al.
Page 4 of 9
(page number not for citation purposes)
obtained was considered the acoustic parameter for each
point – because the magnitude of signal intensity is greatest
when the direction of the reflection wave is perpendicular. The
same surgeon conducted all ultrasound measurements.
Acoustic parameters from 38 points were not readable
because the reflected ultrasound waves from the cartilage sur-
face and from the subchondral bone overlapped and could not
be differentiated. Mean values were calculated in cases where
measurements were conducted in the same grades and in the
same sites of the same knees. By this averaging procedure,
229 data for 20 knees were obtained from the 472 points
(Additional file 1). Acoustic parameters from ICRS grade 4 tis-
sues (68 data from 20 knees) were not used for the present
study as, by definition, grade 4 tissue demonstrates full-thick-
ness cartilage loss. The acoustic parameters obtained from
the remaining 161 data sets of ICRS grade 0, grade 1, grade
2 and grade 3 tissues were therefore used for the study (Table
1). The data were blind-coded and analyzed by a researcher
who is not a surgeon.
Statistical analysis
Because the number of individual points measured varied
between the 20 knees (Additional file 1), mean values were
calculated for the individual knees if more than two points were
measured at each grade and at each site. By this averaging,
one datum per knee was allocated at each grade and at each
site. Because 16 out of the 20 knees provided all the data from
grade 0 to grade 3, the data of the grades from the 16 knees
were compared statistically using the nonparametric Friedman
test (P < 0.05 was taken as statistically significant). The post
hoc Scheffe F test was used for multiple comparison among
the grades. Because 11 out of the 20 knees had all the data
of grade 0 cartilage at sites A, B and E, the signal intensity of
the grade 0 cartilage of sites A, B and E was also compared
in the 11 knees using the nonparametric Friedman test and the
post hoc Scheffe F test.
Because 10 out of the 20 knees provided all the data from site
A to site G, the data of the sites from the 10 knees were com-
pared statistically using the nonparametric Friedman test (P <
0.05 was taken as statistically significant). The post hoc
Scheffe F test was used for multiple comparison among the
sites.
The coefficients of correlation of the three acoustic parame-
ters, using test–retest reliability in 11 measurements, were
0.94 for the signal intensity, 0.78 for the echo duration and
0.99 for the interval between signals.
Results
Of the ICRS grades, grade 0 cartilage comprised 55% (11 out
of 20 knees), 80%, 5% and 85%, respectively, at site A, site
B, site D and site E, and comprised 0% at sites C, F and G
(Table 1).
The signal intensities (mean ± standard deviation, relative
value, arbitrary units) of grade 0 (n = 16), grade 1 (n = 16),
grade 2 (n = 16) and grade 3 (n = 16) cartilage were 1.74 ±
0.823 0.84 ± 0.525, 0.75 ± 0.471 and 0.53 ± 0.362, respec-
tively (Figure 3a). The signal intensity of grade 0 cartilage was
significantly greater than the intensities of grade 1, grade 2 or
grade 3 cartilage (P < 0.001) (Figure 3a). The signal intensi-
ties at site A (n = 10), site B (n = 10), site C (n = 10), site D
(n = 10), site E (n = 10), site F (n = 10) and site G (n = 10)
were 1.39 ± 0.935, 2.56 ± 2.588, 0.52 ± 0.450, 0.59 ±
0.535, 1.08 ± 0.674, 0.63 ± 0.480 and 0.62 ± 0.330, respec-
tively (Figure 3b). The signal intensity for site B cartilage was
significantly greater than the intensities for site C (P < 0.01),
site D (P < 0.05), site F (P < 0.05) and site G cartilage (P <
0.05) (Figure 3b). The signal intensities of grade 0 cartilage at
site A (n = 11), site B (n = 11) and site E (n = 11) were 1.51
± 0.905, 2.67 ± 2.369 and 1.00 ± 0.540, respectively; the
signal intensity was greater at site B than at site E (P < 0.05)
(Figure 4).
Table 1
Number of knees (percentage of 20 knees) at each site and at each grade
Grade 0Grade 1Grade 2Grade 3Grade 4
Site A 11 (55) 12 (60) 6 (30) 0 (0) 4 (20)
Site B 16 (80) 8 (40) 5 (25) 0 (0) 3 (15)
Site C 0 (0) 0 (0) 1 (5) 13 (65) 20 (100)
Site D 1 (5) 11 (55) 10 (50) 1 (5) 3 (15)
Site E 17 (85) 7 (35) 1 (5) 0 (0) 1 (5)
Site F 0 (0) 0 (0) 3 (15) 15 (75) 18 (90)
Site G 0 (0) 2 (10) 11 (55) 10 (50) 19 (95)
For International Cartilage Repair Society grades, see Introduction. For anatomical location of sites, see Figure 1.
Available online />Page 5 of 9
(page number not for citation purposes)
Figure 3
Signal intensity, echo duration and interval between signalsSignal intensity, echo duration and interval between signals. (a) The signal intensity (a measure of superficial cartilage integrity) of grade 0 carti-
lage was greater than the intensities of grade 1, grade 2 or grade 3 cartilage (mean and standard deviation). (b) The signal intensity at site B carti-
lage was significantly greater than the intensities at site C, site D, site F or site G cartilage. (c) No difference in echo duration (a parameter related to
the surface irregularity) among the grades. (d) No difference in echo duration among the sites. (e) The interval between signals (that is, time of flight
– which is related to thickness and ultrasound speed of cartilage) of grade 3 cartilage was less than the intervals of grade 0, grade 1 or grade 2 car-
tilage. (f) The interval between signals at site C was less than the intervals at site A, site B, site D or site E. *P < 0.05, **P < 0.01, ***P < 0.001; NS,
not significant.
Arthritis Research & Therapy Vol 10 No 4 Kuroki et al.
Page 6 of 9
(page number not for citation purposes)
The echo durations of grade 0, grade 1, grade 2 and grade 3
cartilage were 1.10 ± 0.170 μs, 1.18 ± 0.242 μs, 1.23 ±
0.342 μs and 1.09 ± 0.283 μs, respectively (Figure 3c). Echo
durations at site A, site B, site C, site D, site E, site F and site
G were 1.19 ± 0.260 μs, 1.13 ± 0.188 μs, 1.13 ± 0.327 μs,
1.07 ± 0.233 μs, 1.19 ± 0.310 μs, 1.07 ± 0.217 μs and 1.12
± 0.284 μs, respectively (Figure 3d). There was no difference
in the echo duration among the grades and among the sites
(Figure 3c,d).
The intervals between signals of grade 0, grade 1, grade 2 and
grade 3 cartilage were 2.80 ± 0.715 μs, 2.89 ± 0.566 μs,
2.87 ± 0.700 μs, 1.92 ± 0.537 μs, respectively (Figure 3e).
The interval for grade 3 cartilage was less than the intervals for
grade 0, grade 1, or grade 2 cartilage (P < 0.001) (Figure 3e).
The intervals between signals at site A, site B, site C, site D,
site E, site F and site G were 2.89 ± 0.735 μs, 2.68 ± 0.416
μs, 1.76 ± 0.604 μs, 3.06 ± 0.575 μs, 2.77 ± 0.883 μs, 2.23
± 0.638 μs and 2.54 ± 0.541 μs, respectively (Figure 3f). The
interval between signals at site C was less than the intervals at
site A (P < 0.01), site B (P < 0.05), site D (P < 0.001) and site
E (P < 0.01) (Figure 3f).
The mean values for the signal intensity, the echo duration and
the interval between signals for each site and for each ICRS
grade of 20 knees are presented in Table 2.
Discussion
The present study shows the relationship between ICRS
grades and ultrasound properties of articular cartilage. The
signal intensity decreased with increasing ICRS grade (Figure
3a). Although differentiating between healthy cartilage and
ICRS grade 1 cartilage may be difficult using mechanical test-
ing alone [17], a differentiation could be detected using ultra-
sound. The ultrasound evaluation is performed within a very
short time (<0.5 s) [20].
The signal intensity and the ICRS grade vary between sites
within the knee. Indentation studies show that cartilage in the
femoral condyles is stiffest, cartilage in the patellar surface of
the femur is softer, and cartilage in the tibial plateau exposed
by the menisci is softest [21,22]. In the present study, the sig-
nal intensity of grade 0 cartilage at site B was greater than that
at site E (Figure 4). Cartilage at site B is located on the lateral
condyle, and site E cartilage is located on the lateral tibial pla-
teau exposed by the lateral meniscus (Figure 1). The data are
therefore consistent with the two indentation studies [21,22].
Although the ultrasound technique differs from the indentation
technique, the results are consistent with each other.
In the lateral condyle, however, the signal intensity of site A
cartilage tended to be less than that of site B cartilage (P =
0.08) (Figure 4). Ultrasound reflection at the cartilage surface
has been shown to be related to the integrity of the superficial
cartilage [23,24]. There are therefore two possible interpreta-
tions of this observation. Because site A is located just anterior
to site B, an early osteoarthritis event has occurred in the ante-
rior cartilage of the lateral condyle and affected the signal
intensity of site A cartilage. Alternatively, cartilage at site A
originally has been more susceptible to deterioration than that
at site B. We observed a greater percentage of osteoarthritis
in site A cartilage than in site B cartilage. At site A, the grade
0, grade 1, grade 2 and grade 3 cartilage comprised 55% (11
out of 20 knees), 60%, 30% and 0%, respectively (Table 1).
At site B, in contrast, the grade 0, grade 1, grade 2 and grade
3 cartilage comprised 80% (16 out of 20 knees), 40%, 25%
and 0%, respectively (Table 1). These percentages suggest
the incidence of early osteoarthritis in the lateral condyle may
be higher in anterior cartilage (site A) than in posterior carti-
lage (site B).
Although the signal intensity of site E cartilage was less than
that of site B cartilage, grade 0 cartilage at site E comprised
85% (17 out of 20 knees), which is greater than the
percentage of grade 0 cartilage at site B (Table 1). Site E car-
tilage is located on the lateral tibial plateau exposed by the lat-
eral meniscus. Site D cartilage is located on the central load-
bearing region in the lateral tibial plateau. We observed that
Figure 4
Signal intensity of grade 0 cartilageSignal intensity of grade 0 cartilage. The signal intensity of grade 0 cartilage at site B (femoral lateral condyle (posterior)) was significantly greater
than that at site E (lateral tibial plateau (under the meniscus)), and tended to be greater than that at site A (femoral lateral condyle (anterior)).
Available online />Page 7 of 9
(page number not for citation purposes)
the medial meniscus was worn and very thin in most patients.
In some patients, it had ruptured at the central part or the
meniscus had disappeared completely. At sites F and site G,
grade 0 cartilage was absent and grade 4 cartilage comprised
a high percentage. The cartilage below the menisci was there-
fore protected from degeneration compared with the central
load-bearing regions.
High-frequency pulse-echo ultrasound is sensitive for detect-
ing degeneration of the superficial collagen-rich cartilage zone
[10]. Ultrasound measurements appear to be related to
changes in the extracellular matrix collagen and the fibrillar net-
work organization [12]. Ultrasound can detect microstructural
changes up to a depth of 500
μ
m [18]. The signal intensity
therefore provides information on the superficial collagen
integrity of cartilage. The decrease in signal intensity in site C
cartilage (Figure 3b) and the above site-specific differences in
signal intensity suggest that the superficial collagen network
was maintained in cartilage of the lateral condyle (site A and
site B) but deteriorated in cartilage of the medial condyle (site
C), in cartilage at the central load-bearing region in the lateral
tibial plateau (site D) and in cartilage of the medial tibial pla-
teau (site F and site G) in varus knee osteoarthritis.
In the present study, the percentages of the signal intensity of
grade 1, grade 2 and grade 3 cartilage to grade 0 cartilage
were 48% (0.84 versus 1.74), 43% (0.75 versus 1.74) and
30% (0.53 versus 1.74), respectively (Figure 3a). The interval
between signals (a parameter of thickness) indicated that car-
tilage wear increased markedly from grade 2 to grade 3 (Fig-
ure 3e). The present study therefore suggests that a signal
intensity <43% is indicative of cartilage degeneration.
Although there was no distinctive difference in the intervals
between signals for grade 1 cartilage and grade 2 cartilage
Table 2
Signal intensity, echo duration and interval between signals at each site for each grade of cartilage from 20 knees
Grade 0 Grade 1 Grade 2 Grade 3
Signal intensity (relative value, arbitrary units)
Site A 1.51 ± 0.863 1.33 ± 0.775 1.05 ± 0.807
Site B 2.60 ± 1.945 0.96 ± 0.433 0.73 ± 0.502
Site C 0.82 0.57 ± 0.456
Site D 1.30 0.72 ± 0.751 0.52 ± 0.483 0.14
Site E 1.30 ± 0.788 0.37 ± 0.230 0.46
Site F 0.84 ± 0.329 0.54 ± 0.402
Site G 1.18 ± 0.218 0.63 ± 0.420 0.40 ± 0.169
Echo duration (
μ
s)
Site A 1.05 ± 0.136 1.23 ± 0.224 1.34 ± 0.438
Site B 1.08 ± 0.201 1.28 ± 0.279 1.29 ± 0.392
Site C 1.10 1.11 ± 0.336
Site D 1.37 1.08 ± 0.301 1.29 ± 0.490 1.17
Site E 1.12 ± 0.220 1.34 ± 0.376 0.97
Site F 1.08 ± 0.083 1.04 ± 0.201
Site G 1.25 ± 0.220 1.09 ± 0.235 1.20 ± 0.389
Interval between signals (
μ
s)
Site A 2.60 ± 0.694 3.07 ± 0.597 3.04 ± 0.672
Site B 2.79 ± 0.441 2.82 ± 0.428 2.72 ± 0.562
Site C 3.05 1.64 ± 0.504
Site D 3.90 3.27 ± 0.525 3.34 ± 0.681 2.39
Site E 2.77 ± 0.794 3.09 ± 0.747 3.68
Site F 2.71 ± 0.787 1.87 ± 0.647
Site G 1.79 ± 0.398 2.67 ± 0.619 2.49 ± 0.553
Data presented as mean ± standard deviation. For International Cartilage Repair Society grades, see Introduction. For anatomical location of sites,
see Figure 1. The number of knees is shown in Additional file 1.
Arthritis Research & Therapy Vol 10 No 4 Kuroki et al.
Page 8 of 9
(page number not for citation purposes)
(Figure 3e), surface recession and wearing of grade 2 carti-
lage was evident on macroscopic examination. A signal inten-
sity <48% might therefore detect the surface recession of
cartilage.
There was no difference in the echo duration among the
grades. Because the low signal intensities of grade 1, grade 2
and grade 3 cartilage (48%, 43% and 30% of that of grade 0
cartilage, respectively) decreased earlier with a shorter time
than that of grade 0 cartilage, detection of irregularity of grade
1, grade 2 and grade 3 cartilage using echo duration might be
limited.
The interval between signals of grade 3 cartilage was signifi-
cantly less than that of grade 0 cartilage (Figure 3e), but that
of grade 1 cartilage and grade 2 cartilage did not differ from
that of grade 0 cartilage. Although these data for grade 1 car-
tilage and grade 2 cartilage are not consistent with ICRS
descriptions, the discrepancies can be explained by a
decrease in the speed of sound in degraded cartilage
[7,25,26]. The speed of sound is dependent on the cartilage
water content, and an increase of water content induces the
decrease of the speed of sound [25]. The water content
increases with the swelling of the tissue [27-29]. Swelling in
fibrillated cartilage [27] with superficial lesions, especially in
grade 1 cartilage, occurs before significant cartilage loss –
and probably arises from a reduction in the elastic restraint of
the collagen network, allowing the glycosaminoglycans within
the fibrillated tissue to swell to a greater degree of hydration
[28]. Because the speed of sound is slightly lower in hydrated
cartilage than in normal cartilage [25], the ultrasound value
obtained from grade 1 cartilage may also reflect the slightly
decreased speed of sound in the hydrated cartilage. The gly-
cosaminoglycans in grade 2 cartilage, in which significant car-
tilage loss occurred, probably swell to a greater degree of
hydration than those in grade 1 cartilage. The greater degree
of hydration in the grade 2 cartilage affects the interval
between signals. Information such as the macroscopic find-
ings of cartilage degeneration is therefore helpful to interpret
the interval between signals using a predefined speed of
sound. An ultrasound arthroscopic probe (Figure 2a) may con-
tribute to confirming visual findings in an area of questionable
degeneration in very early stage of osteoarthritis.
Conclusion
The ultrasound response of articular cartilage may be related
to its ICRS grading. Ultrasound data indicate that the signal
intensity decreases with increasing ICRS grade. Site-specific
differences in signal intensity suggest that the superficial col-
lagen network may be maintained in cartilage of the lateral
condyle but may deteriorate in cartilage of the medial condyle
and the medial tibial plateau in varus knee osteoarthritis. Ultra-
sound evaluation using the signal intensity – dependent on the
ultrasound reflection coefficient at the cartilage surface – may
be helpful to differentiate ICRS grades, especially grade 0
from grade 1 cartilage.
Competing interests
The authors declare that they have no competing interests.
Authors' contributions
HK, YN, MK, KY, YO, TS and KN participated in the ultrasound
measurement during the surgery. HK and KM participated in
the analysis of the ultrasound indices. HK and KY performed
statistical analysis. YN conceived of the study and participated
in its design and coordination. HK drafted the manuscript. YN
and TN helped to draft the manuscript.
Additional files
Acknowledgements
The present study was performed at the Department of Orthopaedic
Surgery, Graduate School of Medicine, Kyoto University. The study was
supported in part by a grant from the 'Grant-in-Aid for Scientific
Research, Japan' and a grant from the 'New Energy and Industrial Tech-
nology Development Organization (NEDO), Japan'. The authors wish to
thank Toshiya Sato, PhD, Professor of Biostatistics, Graduate School of
Medicine, Kyoto University, for advising on the statistical analysis.
References
1. Toyras J, Lyyra-Laitinen T, Niinimaki M, Lindgren R, Nieminen MT,
Kiviranta I, Jurvelin JS: Estimation of the Young's modulus of
articular cartilage using an arthroscopic indentation instru-
ment and ultrasonic measurement of tissue thickness. J
Biomech 2001, 34:251-256.
2. Adler RS, Dedrick DK, Laing TJ, Chiang EH, Meyer CR, Bland PH,
Rubin JM: Quantitative assessment of cartilage surface rough-
ness in osteoarthritis using high frequency ultrasound. Ultra-
sound Med Biol 1992, 18:51-58.
3. Chiang EH, Adler RS, Meyer CR, Rubin JM, Dedrick DK, Laing TJ:
Quantitative assessment of surface roughness using back-
scattered ultrasound: the effects of finite surface curvature.
Ultrasound Med Biol 1994, 20:123-135.
4. Chiang EH, Laing TJ, Meyer CR, Boes JL, Rubin JM, Adler RS:
Ultrasonic characterization of in vitro osteoarthritic articular
cartilage with validation by confocal microscopy. Ultrasound
Med Biol 1997, 23:205-213.
5. Cherin E, Saied A, Laugier P, Netter P, Berger G: Evaluation of
acoustical parameter sensitivity to age-related and osteoar-
thritic changes in articular cartilage using 50-MHz ultrasound.
Ultrasound Med Biol 1998, 24:341-354.
6. Jurvelin JS, Rasanen T, Kolmonen P, Lyyra T: Comparison of opti-
cal, needle probe and ultrasonic techniques for the measure-
ment of articular cartilage thickness. J Biomech 1995,
28:231-235.
The following Additional files are available online:
Additional file 1
A file containing a table that presents the names of the
knees and the number of different points measured at
each site and at each grade.
See />supplementary/ar2452-S1.doc
Available online />Page 9 of 9
(page number not for citation purposes)
7. Suh JK, Youn I, Fu FH: An in situ calibration of an ultrasound
transducer: a potential application for an ultrasonic indenta-
tion test of articular cartilage. J Biomech 2001, 34:1347-1353.
8. Myers SL, Dines K, Brandt DA, Brandt KD, Albrecht ME: Experi-
mental assessment by high frequency ultrasound of articular
cartilage thickness and osteoarthritic changes. J Rheumatol
1995, 22:109-116.
9. Joiner GA, Bogoch ER, Pritzker KP, Buschmann MD, Chevrier A,
Foster FS: High frequency acoustic parameters of human and
bovine articular cartilage following experimentally-induced
matrix degradation. Ultrason Imaging 2001, 23:106-116.
10. Toyras J, Nieminen HJ, Laasanen MS, Nieminen MT, Korhonen RK,
Rieppo J, Hirvonen J, Helminen HJ, Jurvelin JS: Ultrasonic charac-
terization of articular cartilage. Biorheology 2002, 39:161-169.
11. Mori K, Hattori K, Habata T, Yamaoka S, Aoki H, Morita Y, Takakura
Y, Tomita N, Ikeuchi K: Measurement of the mechanical proper-
ties of regenerated articular cartilage using wavelet transfor-
mation. In Tissue Engineering for Therapeutic Use 6 Edited by:
Ikada Y, Umakoshi Y, Hotta T. Tokyo: Elsevier; 2002:133-142.
12. Pellaumail B, Watrin A, Loeuille D, Netter P, Berger G, Laugier P,
Saied A: Effect of articular cartilage proteoglycan depletion on
high frequency ultrasound backscatter. Osteoarthr Cartil 2002,
10:535-541.
13. Laasanen MS, Toyras J, Vasara AI, Hyttinen MM, Saarakkala S, Hir-
vonen J, Jurvelin JS, Kiviranta I: Mechano-acoustic diagnosis of
cartilage degeneration and repair. J Bone Joint Surg Am 2003,
85-A(Suppl 2):78-84.
14. Hattori K, Mori K, Habata T, Takakura Y, Ikeuchi K: Measurement
of the mechanical condition of articular cartilage with an ultra-
sonic probe: quantitative evaluation using wavelet
transformation. Clin Biomech (Bristol, Avon) 2003,
18:553-557.
15. Hattori K, Takakura Y, Morita Y, Takenaka M, Uematsu K, Ikeuchi
K: Can ultrasound predict histological findings in regenerated
cartilage? Rheumatology (Oxford) 2004, 43:302-305.
16. Brittberg M, Peterson L: Introduction to an articular cartilage
classification. ICRS Newslett 1998, 1:8.
17. Kleemann RU, Krocker D, Cedraro A, Tuischer J, Duda GN:
Altered cartilage mechanics and histology in knee osteoarthri-
tis: relation to clinical assessment (ICRS Grade). Osteoarthr
Cartil 2005, 13:958-963.
18. Hattori K, Takakura Y, Ohgushi H, Habata T, Uematsu K, Yamauchi
J, Yamashita K, Fukuchi T, Sato M, Ikeuchi K: Quantitative ultra-
sound can assess the regeneration process of tissue-engi-
neered cartilage using a complex between adherent bone
marrow cells and a three-dimensional scaffold. Arthritis Res
Ther 2005, 7:R552-R559.
19. Kuroki H, Nakagawa Y, Mori K, Ikeuchi K, Nakamura T: Mechanical
effects of autogenous osteochondral surgical grafting proce-
dures and instrumentation on grafts of articular cartilage. Am
J Sports Med 2004, 32:612-620.
20. Kuroki H, Nakagawa Y, Mori K, Kobayashi M, Yasura K, Okamoto
Y, Mizuno Y, Ando K, Ikeuchi K, Nakamura T: Maturation-depend-
ent change and regional variations in acoustic stiffness of rab-
bit articular cartilage: an examination of the superficial
collagen-rich zone of cartilage. Osteoarthr Cartil 2006,
14:784-792.
21. Swann AC, Seedhom BB: The stiffness of normal articular car-
tilage and the predominant acting stress levels: implications
for the aetiology of osteoarthrosis. Br J Rheumatol 1993,
32:16-25.
22. Yao JQ, Seedhom BB: Mechanical conditioning of articular car-
tilage to prevalent stresses. Br J Rheumatol 1993, 32:956-965.
23. Saarakkala S, Toyras J, Hirvonen J, Laasanen MS, Lappalainen R,
Jurvelin JS: Ultrasonic quantitation of superficial degradation of
articular cartilage. Ultrasound Med Biol 2004, 30:783-792.
24. Saarakkala S, Laasanen MS, Jurvelin JS, Toyras J: Quantitative
ultrasound imaging detects degenerative changes in articular
cartilage surface and subchondral bone. Phys Med Biol 2006,
51:5333-5346.
25. Toyras J, Laasanen MS, Saarakkala S, Lammi MJ, Rieppo J, Kurki-
jarvi J, Lappalainen R, Jurvelin JS: Speed of sound in normal and
degenerated bovine articular cartilage.
Ultrasound Med Biol
2003, 29:447-454.
26. Nieminen HJ, Toyras J, Rieppo J, Nieminen MT, Hirvonen J, Korho-
nen R, Jurvelin JS: Real-time ultrasound analysis of articular
cartilage degradation in vitro. Ultrasound Med Biol 2002,
28:519-525.
27. Maroudas A, Venn M: Chemical composition and swelling of
normal and osteoarthrotic femoral head cartilage. II. Swelling.
Ann Rheum Dis 1977, 36:399-406.
28. Bush PG, Hall AC: The volume and morphology of chondro-
cytes within non-degenerate and degenerate human articular
cartilage. Osteoarthr Cartil 2003, 11:242-251.
29. Huntley JS, Simpson AH, Hall AC: Use of non-degenerate
human osteochondral tissue and confocal laser scanning
microscopy for the study of chondrocyte death at cartilage
surgery. Eur Cell Mater 2005, 9:13-22.
30. Kuroki H, Nakagawa Y, Mori K, Ohba M, Suzuki T, Mizuno Y, Ando
K, Takenaka M, Ikeuchi K, Nakamura T: Acoustic stiffness and
change in plug cartilage over time after autologous osteo-
chondral grafting: correlation between ultrasound signal
intensity and histological score in a rabbit model. Arthritis Res
Ther 2004, 6:R492-R504.
31. Kuroki H, Nakagawa Y, Mori K, Kobayashi M, Okamoto Y, Yasura
K, Nishitani K, Nakamura T: Sequential changes in implanted
cartilage after autologous osteochondral transplantation:
postoperative acoustic properties up to 1 year in an in vivo rab-
bit model. Arthroscopy 2007, 23:647-654.