EARTH SCIENCES - Notable Research and Discoveries Part 8 docx
Bạn đang xem bản rút gọn của tài liệu. Xem và tải ngay bản đầy đủ của tài liệu tại đây (2.15 MB, 24 trang )
earth ScienceS
148
dierent types. Hans-Jörg Vogel of the Helmholtz Centre for Envi-
ronmental Research—UFZ in Leipzig, Germany, and Olaf Ippisch
at the University of Stuttgart in Germany recently rened models of
these ows. Many of these models are based on a mathematical for
-
mula called Richards’ equation, which is limited in how large an area
it accurately models. At large scales—a large section of ground—the
model must be broken up into discrete partitions of a certain size, oth
-
erwise it is inaccurate. Vogel and Ippisch found a way of estimating
the size of these partitions so that the models would be correct. e
researchers published their ndings, “Estimation of a Critical Spatial
Discretization Limit for Solving Richards’ Equation at Large Scales,”
in a 2008 issue of
Vadose Zone Journal.
Scientists are also monitoring aquifers to collect even more data. As
crucial sources of water for many regions, aquifer depletion would have
serious consequences. For example, the largest aquifer in North Ameri
-
ca, the Ogallala Aquifer, lies under parts of eight American states (Texas,
New Mexico, Oklahoma, Colorado, Kansas, Nebraska, Wyoming, and
South Dakota). A lot of farms and homes rely on this water. Ogallala’s
supply is dwindling, as estimated by the United States Geological Sur
-
vey
(USGS), and although it is continually recharged, replenishment
happens slowly and over a limited area. Dennis Gitz of the Agricultural
Research Service and his colleagues at Texas Tech University are moni
-
toring the ow of water through the soil around the aquifer with soil
thermometers (the presence of water alters the soil’s temperature). e
researchers are focusing on playa lakes—temporary lakes formed when
rainwater collects in a cavity—to see if water ltering through the soil at
these points is contributing much clean water to the aquifer. If so, then
the playa lake region must be maintained and protected. Gitz and his
colleagues have begun the study by installing sensors at 14 playa lakes
and are preparing to complete 16 others.
As the quality of data improves, so will hydrologic models and pre
-
dictions. Yet researchers may nd themselves trying to hit a moving
target—any modication in the climate aects the water situation, and
the world’s climate seems to be in the midst of substantial changes.
ClIMatE CHanGE and WatER
Global warming has not been uniform. Some regions, such as the south-
eastern United States, have cooled slightly during this time, and some
FOS_Earth Science_DC.indd 148 2/8/10 10:59:16 AM
149
regions, such as parts of Canada and northern Europe, have warmed at
twice the average rate.
Scientists—as well as everybody else—would very much like to
know what is causing global warming. An important contributor is
emissions from factories, automobiles, and other human activities that
have increased the amount of greenhouse gases such as carbon diox
-
ide in Earth’s atmosphere. ese gases tend to raise temperatures by
absorbing infrared radiation, thereby trapping heat. Attributing most
of the recent warming trend to greenhouse gas emissions is a reason
-
able hypothesis, and many scientists accept it, although it is dicult to
prove. Previous warming trends in Earth’s history, such as the one that
ended the last of the ice ages about 12,000 years ago, have occurred well
before human industry arose. No one is certain what the future climate
will be like—Lorenz showed how predictions of complex phenomena
such as weather and climate are usually erroneous.
How will global climate change aect the planet’s hydrology? Glob
-
al averages of precipitation have not changed much over the last cen-
tury, although there has been variability—some tropical and equatorial
regions have experienced less rainfall than usual and other latitudes
have had more. But the warming trend has begun to melt a signicant
amount
of ice on and around the polar regions. NASA studies indicate
that the Arctic ice thickness has diminished about 40 percent in the last
few decades, and glaciers in Greenland and Antarctica are retreating.
Losses of sea ice—a thin layer of ice over water—have been severe, with
an area of sea ice the size of Norway, Denmark, and Sweden combined
having vanished from the Arctic region.
e consequences of melting glaciers will be rising sea levels. As
water shis out of the ice reservoir, much of it will end up in the oceans.
e additional water will creep up the shores of continents and islands,
ooding low-lying areas.
Other impacts of global climate change on the water cycle are less
certain. Periodic changes in the properties of oceans, such as the warming
of El Niño and the cooling of La Niña in the central Pacic Ocean, cor
-
relate with droughts or storms in other parts of the world, even in distant
regions such as the United States. Due to the buttery eect, nearly any
change anywhere in the globe can exert some degree of inuence on any
other region.
In order to gather clues on what
to expect in the future, some scientists
are studying the past. For example, searching for the cause of episodes of
Water Management—Conserving an Essential Resource
FOS_Earth Science_DC.indd 149 2/8/10 10:59:17 AM
earth ScienceS
150
extreme weather that have occurred in the past may give some indication
of the future course of events. One of the most disruptive episodes in terms
of water is a drought. Perhaps the best-known drought in the United States
and the one with the greatest impact on American history was the long-
lasting drought associated with the dust bowl.
Most scientists use models to study phenomena that take place on a
global scale. Models, such as those describing Earth’s interior, as discussed
in chapter 1, or Earth’s magnetic eld, as discussed in chapter 2, distill
what researchers believe is the essence—the critical features—of the prob
-
lem into a simplied set of equations or structures. If the researchers have
correctly identied the essential features, the model reects the behavior
and properties of the phenomenon. If not, the model is misleading.
Siegfried D. Schubert, a researcher at NASA’s Goddard Space Flight
Center in Greenbelt, Maryland, and his colleagues constructed a climate
model based on historical data of sea surface temperatures in the 20th
century. e researchers also used another model, developed at NASA,
involving the atmosphere and its general circulation, the features of which
came from observations obtained with satellites such as
Aqua of
clouds
and precipitation patterns. A powerful computer simulated the behavior
of the models and the time course of the weather patterns and tempera-
tures by solving the various equations and crunching the data. With these
tools, Schubert and his colleagues focused on the relation between sea
surface temperatures and rainfall in the Great Plains states in the 1930s.
El Niño could have played a role in the 1930s drought, and uctua
-
tions in the sea surface temperature in the Pacic Ocean did occur during
the 1930s. But these uctuations were mild and seem insucient to ac-
count for the prolonged drought conditions during the dust bowl. What
Schubert and his colleagues discovered was that a slight cooling of tropi-
cal Pacic Ocean temperatures coincided with unusually warm tropi-
cal Atlantic Ocean temperatures, and this altered the positions of high-
velocity winds in the atmosphere. ese winds have a signicant aect on
temperatures, as they guide or block the movement of air masses.
Atmospheric winds can also play a strong role in precipitation.
Schubert and his colleagues found that shis in ocean temperature dur
-
ing the 1930s altered the ow of a wind system that normally picks up
moisture from
the Gulf of Mexico. Under typical conditions, this moist
air
travels over the United States, particularly the Great Plains states,
where it cools and falls as rain. Without this moisture, the Great Plains
FOS_Earth Science_DC.indd 150 2/8/10 10:59:17 AM
151
dried up, and the conditions aecting the wind lasted for an extended
period of time, resulting in the devastating length of the 1930s drought.
Schubert and his colleagues published their ndings, “On the Cause of
the 1930s Dust Bowl,” in a 2004 issue of
Science.
What will global warming, the loss of polar ice, rising sea levels,
and other climate changes have on the water cycle and water supplies?
Some models suggest a plausible scenario in which the warming trend
will result in increased evaporation, which in turn will lead to more
precipitation. is would be good news, at least for the reduction in
the number and severity of droughts. But a NASA study suggests that
the outlook is not necessarily good in terms of precipitation. Michael
G. Bosilovich, Schubert, and Gregory K. Walker of the Goddard Space
Flight Center used the atmospheric model mentioned above to examine
what may happen to the water cycle. eir model also suggests higher
precipitation levels, but the increase is over water, not land.
While higher temperatures increase evaporation, the warmer air
can also hold more water vapor. e model of Bosilovich and his col
-
leagues predicted higher cycling rates over water than land
in general.
In
other words, the greater evaporation from the seas also fell on the
seas in a rapid water cycle, while on land the opposite was true. e
researchers published their report, “Global Changes of the Water Cycle
Intensity,” in a 2005 issue of the
Journal of Climate.
No one can be sure at this point what the future will hold, but re-
searchers need to continue to improve their models. As the University
of Tokyo researchers Taikan Oki and Shinjiro Kanae wrote in
Science
in August 25, 2006, “Any change in the hydrological cycle will demand
changes in water resource management, whether the change is caused
by global warming or cooling, or by anthropogenic or natural factors. If
society is not well prepared for such changes and fails to monitor varia
-
tions in the hydrological cycle, large numbers of people run the risk of
living under water stress or seeing their livelihoods devastated by water-
related hazards such as oods.”
ConCluSIon
Uncertainties in the future of Earth’s water supplies are mirrored in the
uncertainties and gaps in the scientic understanding of the water cycle.
Most of the world’s water is salty and undrinkable without desalination,
Water Management—Conserving an Essential Resource
FOS_Earth Science_DC.indd 151 2/8/10 10:59:17 AM
earth ScienceS
152
which is an expensive procedure. Burgeoning populations, along with
a rise in pollution, may result in unsustainable demands on freshwater
sources such as rivers and aquifers. Innovations to increase water e
-
ciency help ease the burden, but conservation and management of water
sources are imperative.
e extent to which conservation and management must go to pro
-
tect these water resources depends on the eects climate change may
exert. If disruptions in weather patterns cause an increase in the num
-
ber of areas experiencing prolonged drought or storms and ooding,
strict measures may have to be taken. ese measures may include re
-
strictions on supplies and use, which in certain parts of the world must
already be instituted from time to time. For example, during water
shortages experienced in 2008, residents of Cyprus—an island nation
located in the eastern Mediterranean Sea that has been averaging only
18.4 inches (46 cm) of rain a year for the last three decades—had their
water cut o on certain days in order to ration the meager supply. Using
a water hose for washing patios or cars was prohibited.
A better understanding of large-scale phenomena such as the
world’s water cycle requires extensive observations. A
model running
on
a computer can simulate global weather patterns and predict what
the future may entail, but the predictions will invariably be wrong un
-
less the data and conditions used in the simulation are highly accurate.
To make observations on a worldwide scale, the best tool is a sat
-
ellite. Orbiting high above the planet, sensitive instruments on board
the satellite can watch over vast swaths of land, water, and atmosphere.
Aqua and similar satellites have been useful, but more satellites are
needed. NASA announced in the spring of 2008 that it plans to launch a
satellite in December 2012 to map soil moisture. Scientists presently do
not have any means of monitoring soil moisture globally, so they have
to rely on samples taken at a few scattered points. Soil moisture has
strong eects on evaporation and the water cycle and is a key feature
in the cycling of carbon (organic material) and stored energy. An 19.7-
foot (6-m) antenna will survey areas 620 miles (1,000 km) wide at a time
and examine the entire globe every few days. Worldwide measurements
of soil moisture will greatly aid climate and hydrologic models.
is data, along with fast computers and the skill and
knowledge
of
researchers, will improve the accuracy of weather and water cycle
models. Although the buttery eect remains a serious impediment,
FOS_Earth Science_DC.indd 152 2/8/10 10:59:18 AM
153
the advances in modeling will reduce uncertainty and narrow the range
of possible outcomes predicted by the models. is research is much
needed. A University of Illinois researcher Mark A. Shannon and his
colleagues issued a warning in
Nature in March 20, 2008: “In the com-
ing decades, water scarcity may be a watchword that prompts action
ranging from wholesale population migration to war, unless new ways
to supply clean water are found.” With new satellite data and improved
prediction techniques, scientists and government ocials may be able
to make well-informed decisions to manage, conserve, and replenish
existing water supplies with minimal disruption to society.
CHRonoloGy
312 b.c.e. Romans begin building aqueducts to carry fresh-
water into the city.
1911
c.e. Americans begin tapping the Ogallala Aquifer, the
largest aquifer in North America.
1928 Curaçao, an island in the Caribbean Sea, constructs
a desalination facility, one of the rst major invest-
ments in desalination technology.
1930s e worst drought to strike the United States aects
much of the nation, but particularly an area in the
Great Plains states of Texas, Oklahoma, Colorado,
Kansas, and New Mexico. Drying of the soil, cou
-
pled with poor land management, results
in severe
dust storms that blanket the dust bowl region.
1950s Aer strong episodes of El Niño, researchers begin
to link this phenomenon with storms and droughts
in the United States and elsewhere.
1960s e MIT professor Edward Lorenz (1917–2008)
discovers the buttery eect—small changes in
weather systems can have enormous consequences.
Water Management—Conserving an Essential Resource
FOS_Earth Science_DC.indd 153 2/8/10 10:59:18 AM
EARTH SCIENCES
154
1974 e U.S. government passes the Safe Drinking Wa-
ter Act, which regulates water treatment and sets
appropriate standards.
2002 NASA launches the Aqua satellite. e collected
data improves weather forecasts and hydrologic
modeling and prediction.
2003 e UN issues its rst World Water Development
Report, warning of impending shortages, and des-
ignates the years 2005–2015 as the Water for Life
Decade, urging conservation and careful manage
-
ment of water resources.
2006 In response to serious water shortages, especially
in the western states, the United States establishes
NIDIS to coordinate water monitoring and re-
search eorts across the country.
2007 Tampa Bay desalination plant begins operations.
When operating at full capacity, the plant can sup-
ply about 10 percent of the city’s freshwater needs.
2008 NASA announces a tentative launch date of 2012
for a satellite designed to measure soil moisture.
FuRtHER RESouRCES
Print and Internet
Bosilovich, Michael G., Siegfried D. Schubert, and Gregory K. Walker.
“Global Changes of the Water Cycle Intensity.” Journal of Climate
18 (2005): 1,591–1,608. e researchers’ model predicts that global
warming will lead to higher rainfall, but not on land.
Egan, Timothy. e Worst Hard Time: e Untold Story of ose Who
Survived the Great American Dust Bowl. New York: Mariner Books,
2006. is history of the 1930s dust bowl describes the
economic,
ecological, and human catastrophe in vivid detail.
FOS_Earth Science_DC.indd 154 2/8/10 10:59:18 AM
155
Environmental Protection Agency. “Water.” Available online. URL:
Accessed May 4, 2009.
e EPA’s mission is to monitor and protect the environment of the
United States and the health of its citizens. e safety of drinking
water is extremely important, and this Web resource discusses the
problems posed by various sources of pollution.
National Aeronautics and Space Administration. “Aqua.” Available on
-
line. URL: Accessed May 4, 2009. is Web
resource describes the
Aqua satellite, its instruments, the mission,
and some of the results and images from the cra.
Oki, Taikan, and Shinjiro Kanae. “Global Hydrological Cycles and
World Water Resources.”
Science 313 (August 25, 2006): 1,068–
1,072. Oki and Kanae discuss freshwater resources and how water
cycles aect their quantity and availability.
Outwater, Alice.
Water: A Natural History. New York: Basic Books,
1996. Water is constantly on the go. is book eloquently describes
the journey, from lake to house drain and back again, as water trav
-
els through complex ecological systems.
Pearce, Fred. When the Rivers Run Dry: Water—e Dening Crisis of
the Twenty-First Century. Boston: Beacon Press, 2006. ere is al-
ways a temptation to sensationalize any of the world’s problems into
a crisis for the sake of expanded news coverage, book sales, and so
forth. But water is vital to life, and freshwater resources
are becoming
increasingly scarce, as the author cogently discusses in this book.
Postel, Sandra.
Pillar of Sand: Can the Irrigation Miracle Last? New York:
W. W. Norton & Company, 1999. Crop irrigation requires a signi-
cant portion of today’s freshwater resources, and for thousands of
years irrigation has played a critical role in boosting agriculture and
meeting civilization’s growing food demands. Water shortages im
-
peril this process, but innovations and greater eciencies oer hope
for continued success.
Public Broadcasting Service. “Surviving the Dust Bowl.” Available on
-
line. URL: Accessed
May 4, 2009. e Internet companion to an episode of
American Ex-
perience, these pages include a time line of the events and interviews
with eyewitnesses.
Water Management—Conserving an Essential Resource
FOS_Earth Science_DC.indd 155 2/8/10 10:59:18 AM
earth ScienceS
156
Schubert, Siegfried D., Max J. Suarez, et al. “On the Cause of the 1930s
Dust Bowl.” Science 303 (March 19, 2004): 1,855–1,859. e re-
searchers develop a climate model that may explain the cause of the
1930s dust bowl.
ScienceDaily. “How Will North America’s Largest Aquifer, the Ogal-
lala Aquifer, Fare?” Available online. URL: encedaily.
com/releases/2008/04/080405094350.htm. Accessed May 4, 2009.
Dennis Gitz of the Agricultural Research Service and his colleagues
at Texas Tech University are monitoring the ow of water through
the soil around the Ogallala Aquifer with soil thermometers.
———. “Precision Irrigation Built into Sprinkler Booms Controls Wa
-
ter Usage, Optimizes Crop Growth.” Available online. URL: http://
www.sciencedaily.com/releases/2008/04/080420111817.htm. Ac
-
cessed May 4, 2009. Steven Evett, Susan O’Shaughnessy, and their
colleagues at the Agricultural Research Service are using sensors at
-
tached to crop plants to transmit information concerning plant tem-
perature and health to the irrigation system.
Shannon, Mark A., Paul W. Bohn, et al. “Science and Technology for
Water Purication in the Coming Decades.” Nature 452 (March
20, 2008): 301–310. e researchers review the progress and future
problems of water purication technology.
Tampa Bay Water. “Desalination Plant Fully Operational.” Available
online. URL: />aspx. Accessed May 4, 2009. Tampa Bay Water describes their
de
-
salination plant, which began operating in December 2007.
Texas Council for the Humanities Resource Center. “e Dust Bowl.”
Available online. URL: />texas/dustbowl/. Accessed May 4, 2009. e hardships of life in the
dust bowl are highlighted, including many photographs and an
essay.
United States Geological Survey. “e Water Cycle.” Available online.
URL: Accessed May
4, 2009. With many diagrams and photographs, this Web resource
explains how the water cycle works. Topics include groundwater dis-
charge and storage, runo, inltration, precipitation, springs, water
vapor in the atmosphere, evaporation, and many others.
FOS_Earth Science_DC.indd 156 2/8/10 10:59:19 AM
157
———. “Water Resources of the United States.” Available online. URL:
Accessed May 4, 2009. Maps, annual water
reports, regional studies, and monitoring data are included in these
extremely informative pages.
de Villiers, Marq. Water: e Fate of Our Most Precious Resource. New
York: Mariner Books, 2001. Earth’s rising population puts added
demands on water resources, and people have not always managed
these resources wisely. is book discusses water use from a histori
-
cal, ecological, cultural, and political perspective. Topics include the
distribution of water, climates, dams, aquifers, and irrigation.
Vogel, Hans-Jörg, and Olaf Ippisch. “Estimation of a Critical Spatial
Discretization Limit for Solving Richards’ Equation at Large Scales.”
Vadose Zone Journal 7 (2008): 112–114. e researchers present a
rened model of groundwater ow.
Web Sites
National Integrated Drought Information System. Available online.
URL: . Accessed May 4, 2009. e NIDIS
Web site oers maps and information showing which parts of the
United States are currently experiencing a drought and how long it
might last.
National Oceanic and Atmospheric Administration. Available online.
URL: Accessed May 4, 2009. A wealth of
information is available at NOAA’s home page, including weather
forecasts and climate research.
Water Management—Conserving an Essential Resource
FOS_Earth Science_DC.indd 157 2/8/10 10:59:19 AM
158
6
PREDICTING
EARTHQUAKES
At 2:28 in the a ernoon of Monday, May 12, 2008, millions of Chinese in
Sichuan Province and the surrounding area felt the ground start to shake.
Sichuan Province is a populous region of China and home to many farm-
ers as well as businesses. Many of the homes, factories, schools, bridges,
and roads could not withstand the violent shaking. In the devastation that
followed, more than 69,000 people lost their lives, several hundred thou-
sand su ered injuries, and 5 million were le without homes—all in the
space of a few minutes. is terrifying episode was an earthquake (“quake”
derives from the Old English word cwacian, meaning “to shake or trem-
ble”). e Guardian (Manchester) reported on May 13 that the earthquake
and its a ere ects “caused panic and mass evacuations in cities across the
country, including Beijing, 930 miles away, Shanghai and Wuhan. ey
were felt as far away as Vietnam and ailand, 1,300 miles to the south. In
Shanghai, China’s nancial centre, skyscrapers swayed as the tremor hit,
sending o ce workers rushing into the streets.”
e tragedy was not a novel one for the Chinese. A large number of
earthquakes have struck China in the past, including one in the city of Tang-
shan on July 28, 1976, which killed about 250,000 people, making this event
one of the deadliest disasters of the 20th century. Earthquakes also cluster in
other regions of Asia; on December 26, 2004, an undersea earthquake in the
Indian Ocean generated a huge wave known as a tsunami—a Japanese term
for harbor wave—that swept over low-lying areas in Indonesia and neigh-
boring regions, killing more than 250,000 people. California has also experi-
FOS_Earth Science_DC.indd 158 2/8/10 10:59:19 AM
158
159
enced many earthquakes, including a San Francisco earthquake on April
18, 1906, that destroyed the city and claimed about 3,000 lives.
Most of the damage and casualties from earthquakes are due to col-
lapsing structures or scattered debris. e ground shakes or oscillates
because of earthquake waves, or seismic waves, which spread out from
the earthquake’s origin—the focus (also known as the hypocenter)—
and travel in all directions. Many communities that have experienced
numerous earthquakes require builders to follow strict codes. Buildings
and bridges can be designed to resist at least a moderate amount of
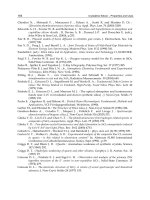
6
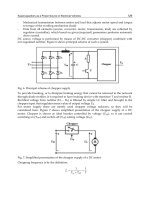
This California highway overpass collapsed during a 1971 earthquake.
(R. Kachadoorian/USGS)
Predicting Earthquakes
FOS_Earth Science_DC.indd 159 2/8/10 10:59:21 AM
earth ScienceS
160
shaking, though there is still danger from ying objects and buckling
oors, and a powerful earthquake can level almost any structure. e
safest strategy would be to evacuate cities and vulnerable buildings be
-
fore the earthquake starts—if advance warning could be provided.
Because the properties of Earth’s interior aect the properties of
seismic waves, geologists have been studying these waves since the 19th
century to learn something about the planet’s inner structure, as dis
-
cussed in chapter 1. Seismic waves are also crucial pieces of information
concerning their source—earthquakes. Yet aer more than a century of
study, scientists have been unable to predict when and where an earth
-
quake will occur. e United States Geological Survey (USGS), Cali-
fornia Geological Survey, and Southern California Earthquake Center
released a report in 2008 saying that California has a greater than 99
percent chance of suering a major earthquake within 30 years. Ac
-
cording to the report, a strong earthquake “is virtually assured in Cali-
fornia during the next 30 years.”
But the report does not specify exactly when the earthquake will occur
or what part of California will be hit. is ambiguity limits the report’s use
-
fulness. Researchers at the frontier of Earth
science would like to do better.
Earthquake forecasts oen rely on historical records and the tendency of
earthquakes to recur in certain areas. is chapter discusses ambitious re
-
search projects that aim to use techniques such as animal behavior, trem-
ors, and fault monitoring to improve earthquake forecasts.
IntRoduCtIon
Geologists gained an important clue about the cause of volcanic activ-
ity when they realized that the vast majority of volcanoes are clustered
around the boundaries of tectonic plates. e same is true for earth
-
quakes. An additional link is that most of the major earthquakes oc-
cur around the Ring of Fire, the narrow ribbon of volcanic and seismic
activity that encircles the Pacic Ocean (see the gure on page 74). e
movement of these massive plates is clearly associated with both earth
-
quakes and volcanoes.
In the 19th century, about 100 years before scientists became
aware of tectonic plates, geologists began fashioning instruments
called seismometers to record seismic waves. A seismometer is a de
-
vice that measures the shaking of the ground as a seismic wave passes
by. In the simplest case, the instrument consists of a freely moving
FOS_Earth Science_DC.indd 160 2/8/10 10:59:21 AM
161
weight, such as a small block, attached to a spring or a hinge. As the
wave passes, the block swings back and forth. A pen or writing instru-
ment attached to the block makes a mark on a roll of paper as it glides
past—a process called seismography—and records the motion over
the course of time on a seismogram. e seismograms of these pio
-
neering researchers enabled them to discover the structure of Earth’s
interior, including the inner core, outer core, and mantle. Seismolo
-
gists of today use electrical devices to magnify the instruments’ mo-
tion, enhancing the sensitivity of seismometers so that they can detect
displacements as small as the diameter of a molecule!
Seismic waves emanate from the earthquake’s focus, as shown in
the following gure, eventually reaching distant seismograph stations.
ese waves vary in frequency from about 0.1 to 30 hertz (cycles per sec
-
ond). A lot of the energy of seismic waves dissipates as it travels through
rocks and soil, which decrease the magnitude of the waves. e area
directly above the focus is known as the
epicenter. Most earthquakes
originate less than about 50 miles (80 km) below the surface, so the epi-
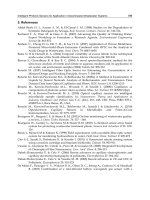
Predicting Earthquakes
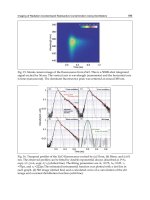
This map depicts plate tectonic activity over the past 1 million years. (NASA)
FOS_Earth Science_DC.indd 161 2/8/10 10:59:22 AM
earth ScienceS
162
center is quite near the focus and is usually the hardest hit region in an
earthquake. Seismologists can calculate the location of an earthquake’s
focus by studying the time of arrival of the seismic waves of various
types (see chapter 1).
Some earthquakes shake the ground a lot, but other earthquakes cre-
ate only a small disturbance. e duration of an earthquake can be a few
seconds to a few minutes, but people feel the ground shaking for about
30 seconds in an average earthquake. In 1902 the Italian researcher Gi-
useppe Mercalli (1850–1914) proposed a scale to measure earthquake
intensity based on observational evidence. An intensity of 1 on this scale
was detectable only with seismometers, while 12 equated total destruc-
tion. Slightly modi ed in 1931, this scale is still used occasionally to de-
scribe the severity of an earthquake’s e ect. e modi ed Mercalli scale
uses Roman numbers from I to XII, with I being least and XII maximal.
A moderate earthquake is a IV—cars can be seen rocking and dishes rat-
tle—and a very strong one is a VII, resulting in slight to moderate damage
to a typical building.
Seismic waves propagate in all directions from the earthquake’s focus.
FOS_Earth Science_DC.indd 162 2/8/10 10:59:32 AM
163
However, since observations are not always reliable and damage de-
pends on the engineering properties of the aected structures, a more
precise scale is needed. (Bigger earthquakes usually cause much more
damage, although the amount of damage also depends on the fragility
of the buildings and structures aected by the motion.) To compare the
magnitudes of dierent earthquakes, scientists used to rely solely on seis
-
mic wave recordings. In 1935 Charles F. Richter (1900–85), a geologist at
the California Institute of Technology, and his colleague Beno Gutenberg
(1889–1960) developed a scale to measure the size of an earthquake. As
described in the following sidebar, the Richter scale (sometimes called the
Richter-Gutenberg scale) assigns a number based on the logarithm of the
amplitude of an earthquake’s seismic waves. e amplitude of a wave is
the size of its peak or maximum deviation from zero or at line.
Because the Richter scale uses base-10 logarithms, the vibrations of,
say, a 5.0 earthquake, are 10 times greater than those of a 4.0 earthquake.
e seismic waves of a 2.0 earthquake on the Richter scale carry roughly
the equivalent amount of energy as a ton of TNT. e seismic waves
of a 5.0 carry about the same energy as the nuclear weapon detonated
over
Nagasaki, Japan, on August 9, 1945, and the seismic waves of a 7.0
have as much energy as that released by the largest nuclear bomb ever
tested—Russia’s Tsar Bomba—equivalent to 50,000,000 tons of TNT.
Until recently, everyone used the Richter scale. But now seismolo
-
gists employ a more direct measurement of earthquake intensity called
moment magnitude, which is based on the actual movement that causes
the earthquake, as described below. is scale generates values similar
to the Richter scale, but a moment magnitude is usually more represen
-
tative of the earthquake’s energy. According to the USGS Earthquake
Magnitude Policy, “Moment magnitude is the preferred magnitude for
all earthquakes listed in USGS catalogs.”
e largest recorded earthquake occurred in Chile in 1960 and reg
-
istered 9.0 on the Richter scale and 9.5 on the moment magnitude scale,
which is abbreviated M
w
. Other sizable events include an Alaska earth-
quake in 1964 that registered 8.4 on the Richter scale and 9.2 M
w
(the larg-
est ever recorded in the United States). Geologists estimate that the 1906
San Francisco earthquake was approximately 8.0 on the Richter scale.
Most people now report the moment magnitude as the earthquake’s mag
-
nitude without mentioning they are not using the Richter scale, which
confuses readers. Seismologists reported that the Sichuan earthquake of
Predicting Earthquakes
FOS_Earth Science_DC.indd 163 2/8/10 10:59:33 AM
earth ScienceS
164
May 12, 2008, measured 7.9 M
w
(not Richter!). e magnitude of the un-
dersea earthquake that generated the December 26, 2004, Indian Ocean
tsunami was 9.3 M
w
.
A large number of earthquakes occur every year, though most are
fortunately so small that only sensitive instruments can detect them.
About 1,000,000 earthquakes above magnitude 2.0 M
w
occur a year. (If
one considers any movement, no matter how small, to be an earthquake,
then earthquakes are continuous—the ground is in motion at some point
on Earth at almost any given time.) Only about a tenth of these earth-
quakes exceed 3.0 M
w
, which is the smallest a person can usually feel. Ten
earthquakes on average will exceed 7.0 M
w
. e state with the most earth-
quakes in the United States is Alaska (California is second).
Even before scientists knew about tectonic plates, they guessed the
basic mechanism of earthquakes. In 1760, British scientist John Michell
Richter Scale—an Early Method of
Quantifying Earthquake Intensity
The California Institute of Technology researchers Charles
Richter and Beno Gutenberg developed the scale in accor-
dance with the amplitude of the vibrations as measured
by their particular seismometer. By comparing instrument
readings rather than subjective observations, the research-
ers could judge the size of any earthquake. This method per-
mitted them to distinguish between the numerous smaller
earthquakes and the rare but important major ones without
having to rely on eyewitnesses.
The range of seismic amplitudes is large—the amplitudes
of some seismic waves are huge compared to others. A scale
with such a wide range is unwieldy because it must include
enormous numbers as well as tiny ones. To make the numbers
more manageable, Richter assigned earthquake magnitudes
based on the logarithm of the amplitude. Logarithms compress
the range; for example, the logarithm (base 10) of 10 is 1, and
FOS_Earth Science_DC.indd 164 2/8/10 10:59:33 AM
165
(1724–93) proposed that rock movements deep below the surface cause
earthquakes to happen. But it took a while before scientists realized how
and why these rocks are moving.
Fault ZonES
Alfred Wegener (1880–1930) proposed a theory of continental dri in
1912, and although his ideas were not entirely correct, geologists in the
1960s realized Earth’s crust is composed of about 12 rigid plates and a
few dozen smaller ones, all moving and jostling each other. ese tectonic
plates ride on a partially molten layer called the asthenosphere. e mo
-
tion is slow, about 1–6 inches (2.5–15 cm) per year on average, but has
dramatic eects. Plate boundaries create space where magma oozes to the
surface, creating the majority of Earth’s volcanoes. And as plates bump,
the logarithm of 100 is 2. (The base-10 logarithm y of a num-
ber x is given by the formula 10
y
= x.) Richter chose the scale’s
0 value to be a certain extremely small amplitude as recorded
by his instrument when located 62 miles (100 km) from the
epicenter. An amplitude 10 times greater than this value would
register 1 on the Richter scale, 100 times greater would reg-
ister 2, 1,000 times greater would register 3, and so on.
A seismic wave’s amplitude depends on the distance from
the focus as well as the sensitivity of the recording instru-
ment, but a mathematical scale was so useful that scientists
adapted the Richter scale for a variety of instruments and
distances. In each case, seismologists calibrate the output of
their instrument to achieve consistent readings of the earth-
quake’s intensity that would be observed 62 miles (100 km)
from the epicenter. There is no minimum or maximum on the
scale. Although 0 is an extremely small value on the Richter
scale—it was about the least that the old instruments could
measure—newer instruments are sensitive enough to detect
smaller amplitudes, which measure negative values on the
Richter scale.
Predicting Earthquakes
FOS_Earth Science_DC.indd 165 2/8/10 10:59:33 AM
earth ScienceS
166
slip underneath, or grind past one another, tremendous forces are un-
leashed. ese forces are responsible for most of the planet’s earthquakes.
A fault is a crack or ssure in which one side or wall moves rela-
tive to the other. Some faults are short, but others extend for 100 miles
(160 km) or more. Faults o en occur around plate boundaries, and the
FOS_Earth Science_DC.indd 166 2/8/10 10:59:36 AM
167
motion of the plates create the forces that move the rocks. As the rocks
on one side try to slide past the rocks on the other, they may get stuck,
arresting the motion temporarily. Stress builds in the fault, as the forc
-
es continue to push or pull against the rocks. e rocks exhibit strain,
deforming or bending, due to the tremendous forces, and nally they
break. A break may occur along an existing fault or it may open up a
new crack, but, either way, the result is a sudden movement and the re
-
lease of a huge quantity of energy. ese events cause earthquakes. e
gure at le illustrates the process.
Most plate boundaries have complicated geometries and do not
consist of a single fault running the length of the boundary. Instead, a
number of dierent faults exist, creating a fault zone or system. Califor
-
nia contains a major fault system that has been responsible for numer-
ous earthquakes in the region. One of the most destructive faults in this
system is the San Andreas Fault, described in the following sidebar.
Following the 1906 San Francisco earthquake, geologists studied
the San Andreas Fault extensively. ey discovered that the giant earth
-
quake
had been caused by a sudden, massive shi along the fault, as
evidenced by osets in roads and other structures that crossed the fault.
Although the theory of plate tectonics was still in the future, in 1910
Henry F. Reid (1859–1944), a geologist at Johns Hopkins University
in Baltimore, Maryland, realized how earthquakes occur. Aer study
-
ing the San Andreas Fault and the 1906 San Francisco earthquake, Reid
proposed a theory of earthquakes called elastic rebound theory. An
elastic material, if deformed by some force, will snap back into place
aer the force disappears; for example, a nger pressed into an elastic
rubber ball will deform the ball’s shape, but aer the nger lis, the ball
will regain its spherical shape. Reid believed that stress builds up over
time along a fault, deforming the rocks, until something nally gives
and the rocks snap back, or rebound, causing a slip along the fault. (See
the gure on page 166.) is sudden movement by a massive amount of
rock sends out a huge amount of shock waves—an earthquake.
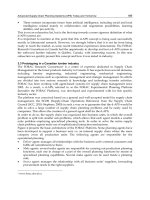
(opposite page) Strain develops along a fault, eventually producing a
rupture (1), which quickly reaches the surface (2) and spreads (3),
extending throughout the fault (4).
Predicting Earthquakes
FOS_Earth Science_DC.indd 167 2/8/10 10:59:36 AM
earth ScienceS
168
San Andreas Fault
Two large tectonic plates, the Pacifi c plate and the North
American plate, meet in California. Part of the boundary in-
cludes the San Andreas Fault, as shown in the following fi g-
ure. The San Andreas Fault takes its name from San Andreas
Lake, which lies a little south of San Francisco in a valley cre-
ated by the fault. Andrew Lawson (1861–1952), a professor
at the University of California, Berkeley, identifi ed the northern
stretch of the fault in 1895 and later discovered it extended
far to the south. San Andreas is the backbone or master fault
in the system, running about 800 miles (1,280 km) from
northern California to San Bernardino in the south. The fi s-
sure extends to a depth of at least 10 miles (16 km).
Rocks on opposite sides of the San Andreas Fault move
past one another horizontally. This motion is due to the plate
movement—the Pacifi c plate moves northwestward with re-
spect to the North American plate at a rate of about 2 inch-
es (5 cm) per year, as measured in the San Francisco area.
Since Los Angeles is on the Pacifi c plate and San Francisco
is on the North American plate, the two cities will slide past
each other in a few million years if the plates continue their
present motion!
In 1906, only 11 years after Lawson’s discovery, this
fault became the center of much attention from geolo-
gists—it was the origin of the tragic San Francisco earth-
quake. Geologists who flocked to the site found that fences,
streams, and roads that stretched across the fault were no
longer lined up, for one side had suddenly shifted. Instead
(continues)
Fault slips are the basis for the moment magnitude measure-
ments mentioned above. The product of the area of a fault’s surface
and the average distance it moved during a slip is called the moment
FOS_Earth Science_DC.indd 168 2/8/10 10:59:37 AM
169
The San Andreas Fault extends through coastal California—this
fault forms part of the boundary of the Pacifi c plate and the North
American plate.
Predicting Earthquakes
of an earthquake. Scientists can estimate the moment from seismo-
grams, but they can also determine the moment by studying the fault
itself.
FOS_Earth Science_DC.indd 169 2/8/10 10:59:44 AM
earth ScienceS
170
A few earthquakes occur far from any plate boundary, similar to the
phenomenon of volcano hot spots. e origin of these earthquakes is
not generally well understood. But cracks or faults within plates would
explain why these events occur, and in some cases evidence for these
faults has been discovered.
of a continuous road or fence, one side was offset from
the other side, across the fault. In some cases, such as
the road at Tomales Bay, the offset was nearly 21 feet (6.4
m)—the center of the road at one side of the fault was a
horizontal distance of 21 feet (6.4 m) from the road at the
other side of the fault!
(continued)
This view shows a portion of the San Andreas Fault at the Carrizo
Plain. The fault runs horizontally across the middle of the photograph.
Note that the stream channel running vertically is out of alignment
due to movement along the fault. (R. E. Wallace/USGS)
FOS_Earth Science_DC.indd 170 2/8/10 10:59:46 AM
171
anks to the work of Lawson, Reid, and numerous other research-
ers, geologists now have a good idea how and why earthquakes occur. But
earthquakes are complex. Geologists can easily identify faults and specify
which regions are likely to experience major earthquakes in the future,
but precise predictions have proven dicult. e large size of the plates
and the complicated nature and geometry of their interactions have thus
far deed specic predictions of future events. Determining if an earth
-
quake will happen at a given place tomorrow or next week is not yet pos-
sible, since the uncertainty is given in decades or even centuries.
But Earth scientists are continuing to work on earthquake predic
-
tion, and their motivation is not just scientic curiosity. e May 12,
2008, earthquake in Sichuan Province, China, killed tens of thousands of
people and is not a rare event. Major earthquakes occur every few years,
causing hundreds or thousands of deaths and billions of dollars in dam
-
age. A number of populous cities or regions are threatened, including San
Francisco, Los Angeles, Tokyo, Tehran, Istanbul, Mexico City, and many
others. At the very least, researchers want to develop warning systems
that would give people a chance to
seek safety before the seismic waves
arrive and the buildings start to crumble.
WaRnInG SyStEMS
A warning system is not the same as the ability to make a prediction. Sup-
pose that 36 miles (58 km) away from city C, a fault slips, creating danger-
ous seismic waves. As chapter 1 described, the fastest seismic waves, the pri-
mary or P waves, travel through rock at about 13,000 miles per hour (20,800
km/hr), or 3.6 miles (5.8 km) a second. e waves take about 10 seconds to
reach C. If the city had a sensor to detect this event and send a message that
traveled much faster than the seismic waves—for instance, by radio, which
is 50,000 times faster—then the citizens would be alerted a little less than 10
seconds before the initial waves of the earthquake hit the city.
But for many earthquakes, the slower surface waves are the most
destructive, since they tend to shake buildings and other structures with
greater power. If the primary waves emanating from the earthquake
trigger the alarm, citizens may have a half-minute or perhaps a little
more to take action before the most violent events occur. Even
10 to 20
seconds is enough to nd cover in most situations.
On
October 1, 2007, Japan instituted an earthquake warning sys
-
tem administered by the Japan Meteorological Agency. An eective sys-
Predicting Earthquakes
FOS_Earth Science_DC.indd 171 2/8/10 10:59:46 AM