Rock Slope Engineering Civil and mining 4th edition phần 9 pptx
Bạn đang xem bản rút gọn của tài liệu. Xem và tải ngay bản đầy đủ của tài liệu tại đây (711.99 KB, 46 trang )
344 Civil engineering applications
Normal stress, (kPa)
Shear stress, (kPa)
residual
=36°
peak
=47°
Peak strength
Residual strength
100
200
300
400
500
100 200 300 400 500 600 700
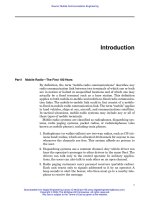
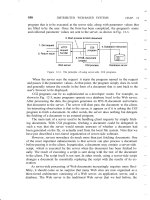
Figure 14.9 Results of direct shear tests
on sheet joints in the granite for Case
Study II.
mass would promote drainage. However, during
heavy precipitation events, it was likely that high,
transient water pressures would develop and this
was accounted for in design.
It was assumed for design that water would
accumulate in the tension crack to depth z
w
, and
that water forces would be generated both in the
tension crack (V ) and along the sliding plane (U)
(Figure 14.10).
14.3.5 Earthquakes
The site was located in seismically active area, and
it was assumed that the actual ground motions
would be made up of both horizontal and ver-
tical components that could be in phase. These
ground motions were incorporated in the design
by using both horizontal (k
H
) and vertical (k
V
)
seismic coefficients as follows:
k
H
= 0.15; and k
V
= 0.67 × k
H
= 0.1
The seismic ground motions were incorporated
into the slope design assuming that the accelera-
tion would act as two pseudo-static forces.
14.3.6 Stability analysis
The nominal, static factor of safety of individual
blocks sliding on the sheet joints dipping at 25
◦
85°
25°
70°
25°
14.8 m
10.0 m
U
V
T
W
k
H
· W
k
V
· W
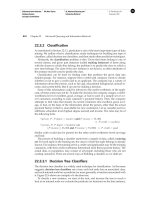
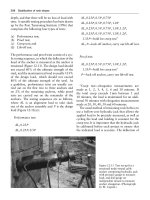
Figure 14.10 Cross-section of block used in design to
model the assemblage of rock blocks in the slope for
Case Study II.
was about 1.5 (tan φ/ tan ψ
p
= tan 36/ tan 25 =
1.5). However, the shear movement along the
sheet joints and the corresponding pattern of ten-
sion cracks behind the face shown in Figure 14.7
indicated that, under certain conditions, the
factor of safety diminished to approximately 1.0.
Civil engineering applications 345
It was considered that the cause of the movement
was a combination of water pressures and ice
jacking on the joints, seismic ground motions over
geologic time and blast damage during construc-
tion. Also, failure could have been progressive
in which movement of one block would drag
the adjacent block(s), and as movement occurred
crushing of rock asperities along the sliding
surfaces reduced the friction angle.
The stability of the sliding blocks was stud-
ied using a plane stability model in which it was
assumed that the cross-section was uniform at
right angles to the slope face, and that sliding took
place on a single plane dipping out of the face. In
order to apply this model to the actual slope, a
simplifying assumption was made in which the
three blocks were replaced by a single equivalent
block that had the same weight as the total of the
three blocks and the same stability characteristics.
The shape and dimensions of the equivalent
single block were defined by the following para-
meters (Figure 14.10):
Sliding plane, dip ψ
p
= 25
◦
; tension crack,
dip ψ
t
= 85
◦
; slope face, dip ψ
f
= 70
◦
;
upper slope, dip ψ
s
= 25
◦
; height of face,
H = 18 m; distance of tension crack behind
crest, b = 10 m.
Stability analysis of this block showed that the
factor of safety was approximately 1.0 when the
water in the tension crack was about 1 m deep,
and a pseudo-static seismic coefficient of 0.15g
was applied. The static factor of safety for these
conditions was 1.53, and reduced to 1.15 when
the water level in the tension crack was 50% of
the crack depth (z
w
= 7.8 m).
14.3.7 Stabilization method
Two alternative stabilization methods were con-
sidered for the slope. Either, to remove the
unstable rock by blasting and then, if necessary
bolt the new face, or reinforce the existing slope
by installing tensioned anchors. The factors con-
sidered in the selection were the need to maintain
traffic on the highway during construction, and
the long-term reliability of the stabilized slope.
The prime advantage of the blasting operation
was that this would have been a long-term solu-
tion. In comparison, the service life of the rock
anchors would be limited to decades due to cor-
rosion of the steel and degradation of the rock
under the head. However, the disadvantage of the
blasting operation was that removal of the rock
in small blasts required for the maintenance of
traffic on the highway might have destabilized the
lower blocks resulting in a large-scale slope fail-
ure. Alternatively, removal of all the loose rock
in a single blast would have required several days
of work to clear the road of broken rock, and
to scale and bolt the new face. Bolting of the new
face would probably have been necessary because
the sheet joints would still daylight in the face and
form a new series of potentially unstable blocks.
It was decided that the preferred stabilization
option was to reinforce the slope by installing
a series of tensioned rock anchors extending
through the sheet joints into sound rock. The
advantages of this alternative were that the work
could proceed with minimal disruption to traffic,
and there would be little uncertainty as to the
condition of the reinforced slope.
The rock anchoring system was designed using
the slope model shown in Figure 14.10. For static
conditions and the tension crack half-filled with
water (z
w
= 7.8 m), it was calculated that an
anchoring force of 550 kN per meter length of
slope was necessary to increase the static factor of
safety to 1.5. With the application of the pseudo-
static seismic coefficients, the factor of safety was
approximately 1.0, which was considered sat-
isfactory taking into account the conservatism
of this method of analysis. The anchors were
installed at an angle of 15
◦
below the horizontal,
which wasrequired for efficient drilling andgrout-
ing of the anchors. The factor of safety of 1.5
was selected to account for some uncertainty in
the mechanism of instability, and the possibility
that there may have been additional loose blocks
behind those that could be observed at the face.
The arrangement of anchors on the face was
dictated by the requirements to reinforce each
346 Civil engineering applications
Trim blasting
Cable anchor
Drain hole
Shotcrete
Borehole wall
Grout
Corrugated sheating
Grout tube (inner annulus)
Steel cables (2)
Grout tube (outer annulus)
Anchor end detail
Highway
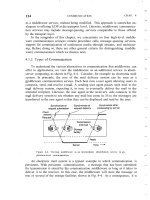
Figure 14.11 Cross-section of stabilized slope for Case Study II showing layout of cable anchors, and the trim
blast, shotcrete and drain holes; detail shows lower end of cable anchors with arrangement of grout tubes.
of the three blocks, to intersect the sheet joints
and to locate the bond zone for the anchors in
sound rock (Figure 14.11). Because of the lim-
ited area on the face in which anchors could be
installed, it was necessary to minimize the number
of anchors. This was achieved using steel strand
cables, because of their higher tensile strength
compared to rigid bars. A further advantage of
the cables was that they could be installed in
a hole drilled with a light rig that would be
set up on the slope without the support of a
heavy crane that would block traffic. Also, the
installation would be facilitated because cable
bundles were lighter than bars, and could be
installed as a single length without the use of
couplings.
Details of the anchor design that met these
design and construction requirements were as
follows:
Working tensile load of 2-strand, 15 mm
diameter, 7-wire strand anchor at 50% of
ultimate tensile strength = 248 kN;
For three rows of anchors arranged as
shown on Figure 14.11, the total support
force = 744 kN (3 × 248 = 744). Therefore
the required horizontal spacing between the
vertical rows:
Spacing
=
supplied anchor force by three rows of anchors
required anchor force for factor of safety of 1.5
=
744 kN
550 kN/m
∼ 1.5 m
Civil engineering applications 347
The bond length (l
b
) for the anchors was
calculated assuming that the shear stress
developed by the tension in the anchor (T )
was uniformly distributed at the rock–grout
peripheral surface of the drill hole (diameter,
d
h
= 80 mm). For the strong granitic rock
in the bond zone the allowable shear strength
(τ
a
) of the rock–grout bond was estimated to
be 1000 kPa (PTI, 1996). The bond length was
calculated as follows:
Bond length =
T
π × d
h
τ
a
=
248
π
x
0.080 ×1000
∼ 1m
The actual bond length used for the anchors
was 2 m to allow for loss of grout in frac-
ture zones in the rock where the bond zones
were located, and to ensure that the steel–
grout bond strength was not exceeded (Wyllie,
1999).
In addition to the cable anchors, which were
required to prevent large-scale instability, the fol-
lowing stabilization measures were implemented
to minimize the risk of surficial rock falls that
could be a hazard to traffic (Figure 14.11):
• Trim blasting was used to remove the over-
hang on the face of the upper block. This rock
was fractured and marginally stable, and it
would not have been safe to set up the drill
on this face and then drill the anchor holes
through it.
• The seams of fractured rock along each of the
sheet joints were first scaled by hand to remove
the loose, surficial rock, and then steel fiber
reinforced shotcrete was applied to prevent
further loosening of the blocks of rock.
• Drain holes, 4 m long on 3 m centers were
drilled through the shotcrete to intersect the
sheet joints and prevent build up of water
pressure in the slope.
14.3.8 Construction issues
The following is a brief description of a number
of issues that were addressed during construc-
tion to accommodate the site conditions actually
encountered.
• Drilling was carried out with a down-the-hole
hammer drill, without the use of casing. Par-
ticular care had to be taken to keep the hole
open and avoid the loss of the hammer when
drilling through the broken rock on the sheet
joints.
• The thrust and rotation components for the
drill were mounted on a frame that was
bolted to the rock face, with a crane only
being used to move the equipment between
holes. This arrangement allowed drilling to
proceed with minimal disruption to highway
traffic.
• Grouting of the anchor holes to the surface
was generally not possible because the grout
often flowed into open fractures behind the
face. In order to ensure that the 2 m long bond
zones were fully grouted, the lower portion
of each hole was filled with water and a well
sounder was used to monitor the water level.
Where seepage into fractures occurred, the
holes were sealed with cement grout and then
redrilled, following which a further water test
was carried out.
• Corrosion protection of the anchors was
provided with a corrugated plastic sheath that
encased the steel cables, with cement grout
filling the annular spaces inside and outside
the sheath. In order to facilitate handling
of the cable assemblies on the steep rock face,
the grouting was only carried out once the
anchors had been installed in the hole. This
involved two grout tubes and a two-stage
grouting process as follows. First, grout was
pumped down the tube contained within the
plastic sheath to fill the sheath and encapsulate
the cables. Second, grout was pumped down
the tube sealed into the end cap of the sheath
to fill the annular space between the sheath
and the borehole wall.
348 Civil engineering applications
• Testing of the anchors to check the load capa-
city of the bond zone was carried out using the
procedures discussed in Section 12.4.2 (PTI,
1996).
14.4 Case Study III—Stability of wedge
in bridge abutment
14.4.1 Site description
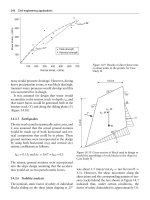
This case study describes the stability analysis of a
bridge abutment in which the geological structure
formed a wedge in the steep rock face on which
the abutment was founded (Figure 14.12). The
analysis involved defining the shape and dimen-
sions of the wedge, the shear strength of the two
sliding planes, and the magnitude and orienta-
tion of a number of external forces. The stability
of the wedge was examined under a combination
of load conditions, and the anchoring force was
calculated to produce a factor of safety against
sliding of at least 1.5.
The site was located in an area subject to both
high precipitation and seismic ground motion.
The bridge was a tensioned cable structure with
the cables attached to a concrete reaction block
located on a bench cut into the rock face. The
cables exerted an outward force on the abut-
ment (15
◦
below the horizontal) along the axis
of the bridge. The structural geology of the site
comprised bedding and two sets of faults that
together formed wedge-shaped blocks in the slope
below the abutment. The stability of the slope
was examined using the wedge stability ana-
lysis method to determine the static and dynamic
factors of safety, with and without rock anchors.
Figure 14.12 is a sketch of the abutment showing
the shape of the wedge and the orientations of the
bridge force (Q). The anchors were installed in
the upper surface of the abutment, inclined at an
angle of 45
◦
below the horizontal, and oriented
at 180
◦
from the direction of the line of inter-
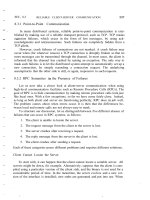
section. On Figure 14.12, the five planes forming
the wedge are numbered according to the system
shown on Figure 7.18(a).
14.4.2 Geology
The rock was slightly weathered, strong, massive
sandstone with the bedding dipping at an angle
Fault F1 (2)
Fault F2 (5)
Bench (3)
Bedding (1)
Face (4)
Line of
intersection
Tensioned
bridge cables (Q)
Abutment
Figure 14.12 View of
wedge in bridge abutment
showing fire planes forming
the wedge in Case Study III.
Civil engineering applications 349
of 22
◦
to the west (orientation 22/270). The
site investigation identified a persistent bedding
plane at a depth of 16 m below the bench level
that contained a weak shale interbed. This plane
formed the flatter of the two sliding planes form-
ing the wedge block. There were also two sets
of faults in the slope with orientations 80/150
(F 1) and 85/055 (F2). The faults were planar
and contained crushed rock and fault gouge, and
were likely to have continuous lengths of tens
of meters. Fault F 1 formed the second sliding
plane, on the left side of the wedge (Figure 14.12).
Fault F 2 formed the tension crack at the back
of the wedge, and was located at a distance of
12 m behind the slope crest, measured along the
outcrop of fault F1.
Figure 14.13 is a stereonet showing the orienta-
tions of the great circles of the three discontinuity
sets, and the slope face (orientation 78/220), and
upper bench (orientation 02/230).
14.4.3 Rock strength
The stability analysis required shear strength val-
ues for both the F1 fault and the bedding. The
fault was likely to be a continuous plane over the
length of the wedge, for which the shear strength
of the crushed rock and gouge would comprise
predominately friction with no significant cohe-
sion. The shear strength of the bedding plane
was that of the shale interbed. The shear strength
of both materials was determined by laborat-
ory testing using a direct shear test machine (see
Figure 4.16).
The direct shear tests carried out on fault
infilling showed friction angles averaging 25
◦
with zero cohesion, and for the shale the fric-
tion angle was 20
◦
and the cohesion was 50 kPa.
Although both the fault and the bedding were
undulating, it was considered that the effective
roughness of these surfaces would not be incor-
porated in the friction angle because shearing was
likely to take place entirely within the weaker
infilling, and not on the rock surfaces.
14.4.4 Ground water
This area was subject to periods of intense rain
that was likely to flood the bench at the crest of the
slope. Basedontheseconditionsitwasassumedfor
the analysis that maximum water pressures would
be developed on the planes forming the wedge.
Bench:
02/230
I
1,2
= 19/237
N
S
EW
Face:
78/220
Tension crack (F2):
85/055
F1: 80/150
Bedding:
22/270
Figure 14.13 Stereonet of five planes forming
wedge in bridge abutment shown in Figure 14.12.
350 Civil engineering applications
14.4.5 Seismicity
The seismic coefficient for the site was 0.1. The
stability analysis used the pseudo-static method in
which the product of the seismic coefficient, the
gravity acceleration and the weight of the wedge
was assumed to produce a horizontal force acting
out of the slope along the line of intersection of
the wedge.
14.4.6 External forces
The external forces acting on the wedge com-
prised water forces on planes 1, 2 and 5, the seis-
mic force, the bridge load and the rock anchors.
Figure 14.14 shows the external forces in plan
and section views.
The water forces were the product of the areas
of planes 1 and 2 and the water pressure distri-
bution. The seismic force was the product of the
horizontal seismic coefficient and the weight of
the wedge. The analysis procedure was to run the
stability analysis to determine the weight of the
wedge (volume multiplied by rock unit weight),
from which the seismic force was calculated.
For the bridge, the structural load on the abut-
ment due to the tensioned cables had a magnitude
of 30 MN, and trend and plunge values of 210
◦
and 15
◦
, respectively. The trend coincidedwiththe
bridge axis that was not at right angles to the rock
face, and the plunge coincided with the sag angle
of the catenary created by the sag in the cables.
The rock anchors were installed in the upper
surface of the bench and extended through the
bedding plane into stable rock to apply normal
and shear (up-dip) forces to the bedding plane.
14.4.7 Stability analysis
The stability of the abutment was analyzed
using the comprehensive wedge analysis proced-
ure described in Appendix III, and the computer
program SWEDGE version 4.01 by Rocscience
(2001). The input data required for this ana-
lysis comprised the shape and dimensions of the
wedge, the rock properties and the external forces
acting on the wedge. Values of these input para-
meters, and the calculated results, are listed on
the next page.
(i) Wedge shape and dimensions
The shape of the wedge was defined by
five surfaces with orientations as shown in
Figure 14.13.
(a) Plane 1 (bedding): 22
◦
/270
◦
(b) Plane 2 (fault F1): 80
◦
/150
◦
(c) Plane 3
(upper slope): 02
◦
/230
◦
Q
Q
U
1
U
1
N
(a) (b)
U
2
T
T
W
Legend
k
h
W —horizontal seismic force =14.1 MN
Q —tension in bridge cables = 30.0 MN
U
2
—water force on plane 2 = 6.5MN
T —tension force in anchor =10.5 MN
U
1
—water force on plane 1 = 19.4MN
W —weight of wedge = 140.6 MN
k
h
W
k
h
W
Figure 14.14 Sketch showing magnitude
and orientation of external forces on wedge:
(a) section view along line of intersection;
(b) plan view.
Civil engineering applications 351
(d) Plane 4 (face): 78
◦
/220
◦
(e) Plane 5
(tension crack,
fault F2): 85
◦
/055
◦
The orientation of the line of intersection
between planes 1 and 2 was calculated to be
(a) Line of intersection: 18.6
◦
/237
◦
The dimensions of the wedge were
defined by two length parameters:
• Height, H 1 (vertical height from line of
intersection to crest): 16 m;
• Length, L (length along plane 1 from
crest to tension crack): 25 m.
(ii) Rock properties
The rock properties comprised the shear
strengths of planes 1 and 2, and the rock
unit weight:
• Bedding with shale interbed: c
1
=
50 kPa, φ
1
= 20
◦
;
• Fault F1: c
2
= 0 kPa, φ
2
= 35
◦
;
• Unit weight of rock, γ
r
= 0.026 MN/m
3
;
and
• Unit weight of water, γ
w
= 0.01 MN/m
3
.
(iii) External forces
The magnitude and orientation of the
external forces were as follows.
• Water forces acted normal to each plane
and were calculated to have the follow-
ing values, for fully saturated condi-
tions:
U
1
= 19.73 MN;
U
2
= 6.44 MN; and
U
5
= 1.55 MN.
• The wedge weight acted vertically and
was calculated (from the wedge volume
and the rock unit weight) to have
magnitude:
W = 143.35 MN
• The horizontal component of the seismic
force acted in the direction along the line
of intersection and had magnitude
k
H
W = 0.1W
= 14.1 MN oriented at 0
◦
/237
◦
• The bridge force, Q acted along the cen-
ter line of the bridge at an angle of 15
◦
below the horizontal:
Q = 30 MN oriented at 15
◦
/210
◦
• The factor of safety of the abutment with
no reinforcement provided by tensioned
anchors was as follows:
(a) FS = 2.58—dry, static, Q = 0
(b) FS = 2.25—saturated, static, Q = 0
(c) FS = 1.73—saturated, k
H
= 0.1,
Q = 0
(d) FS = 1.32—saturated, static, Q =
30 MN
(e) FS = 1.10—saturated, k
H
= 0.1,
Q = 30 MN
• It was considered that the factors of
safety for load conditions (d) and (e)
were inadequate for a structure critical
to the operation of the facility, and
that the minimum required static and
seismic factors of safety should be 1.5
and 1.25, respectively. These factors of
safety were achieved, with the bridge
load applied, by the installation of ten-
sioned anchors (tension load T ), which
gave the following results:
(a) FS = 1.54—saturated, static, T =
10.5 MN, ψ
T
= 15
◦
, α
T
= 056
◦
(parallel to the line of intersec-
tion); and
(b) FS = 1.26—saturated, k
H
= 0.1,
T = 10.5 MN, ψ
T
= 15
◦
, α
T
=
056
◦
.
• It was found that the factor of safety for
the reinforced wedge could be optim-
ized by varying the orientation of the
352 Civil engineering applications
anchors. If the trend of the anchors was
between the trends of the line of intersec-
tion and the bridge load (i.e. α
T
= 035
◦
),
it was possible to reduce the anchor force
required to achieve the required factor of
safety to 8.75 MN.
• It is noted that the discussion in this case
study only addressed the stability of the
wedge, and did not discuss the method
of attaching the tensioned bridge cables
to the rock wedge. Also, it is assumed
that all the external forces acted through
the center of gravity of the wedge so that
no moments were generated.
14.5 Case Study IV—Circular failure
analysis of excavation for rock fall
ditch
14.5.1 Site description
As the result of a series of rock falls from a rock
face above a railway, a program was undertaken
to improve stability conditions (Figure 14.15).
The initial stabilization work involved selective
scaling and bolting of the face, but it was found
that this only provided an improvement for one
or two years before new rock falls occurred as the
rock weathered and blocks loosened on joint sur-
faces. Rock falls were a potential hazard because
the curved alignment and stopping distance of
as much as 2 km meant that trains could not be
brought to a halt if a rock fall was observed.
In order to provide long-term protection against
rock falls, it was decided to excavate the face to
create a ditch that was wide enough to contain
substantial falls from the new face. This work
involved a drilling and blasting operation to cut
back the face to a face angle of 75
◦
, and con-
structing a gabion wall along the outer edge of the
ditch that acted as an energy absorbing barrier to
contain rock falls (Wyllie and Wood, 1981).
The railway and highway were located on
benches cut into a rock slope above a river, and
there were steep rock faces above and below
the upper bench on which the railway was loc-
ated; a 30 m length of the track was supported
by a masonry retaining wall (Figure 14.15). The
Excavated face
Tension crack
Original slope
Ground water
surface
Center of rotation
Gabion
Railroad
Retaining wall
Highway
River
Ditch width
Potential
sliding surface
Figure 14.15 Geometry of slope above railway in Case Study IV. Sketch shows dimensions of ditch after
excavation of slope, and shape of potential circular sliding surface through rock mass.
Civil engineering applications 353
original cut above the railway was about 30 m
high at a face angle of 60
◦
, and the 2 m wide ditch
at the toe of the slope was not adequate to con-
tain rock falls. Blasting had been used to excavate
the slope, and there was moderate blast damage
to the rock in the face.
The site was in a climate with moderate precip-
itation that experienced long periods of freezing
temperatures during the winter. Formation of ice
in fractures in the rock behind the face could
loosen blocks of rock resulting in the occurrence
of rock falls with little warning; rock falls tended
to occur in the spring when the ice started to melt.
14.5.2 Geology
The cut was in medium strong, slightly to mod-
erately weathered volcanic tuff containing joints
spaced at about 0.5–2 m, and lengths up to 3 m.
There was one consistent set of joints that had a
near vertical dip and a strike at about 45
◦
to the
strike of the cut face. However, the orientations
of the other joints were variable over short dis-
tances. Many of the joints had calcite infillings
that had a low cohesive strength.
Because of the variable orientations and lim-
ited persistence of the joints throughout the length
of the cut, there was little structurally controlled
instability on the overall rock face.
14.5.3 Ground water
Because of the low precipitation in the area, it was
assumed that the ground water level in the slope
would have little influence on stability.
14.5.4 Rock shear strength
An important design issue for the project was the
stability of the overall cut face above the railway,
and whether it could be cut back safely to create a
rock fall ditch. The rock strength relevant to this
design was that of the rock mass because poten-
tial failure surfaces would pass partially through
intact rock, and partially along any low persist-
ence joints oriented approximately parallel to this
surface. It was not possible to test samples with
diameters of several meters that would be rep-
resentative of the rock mass, or to determine
the proportions of intact rock and joint plane
that would form the sliding surface in the slope.
Therefore, two empirical methods as described
in the next paragraph were used to estimate the
cohesion and friction angle of the rock mass.
The first method of estimating the rock mass
strength was to carry out a back analysis of the
existing 30 m high cut above the railway, which
involved the following steps. First, there was no
evidence of instability of the overall slope, which
had been standing for over 100 years, or natural
slopes in the same rock type. These slopes had
probably been subject in the past to earthquakes
and occasional periods of high water pressure.
Therefore, a factor of safety in the range of 1.5–
2.0 was assumed for the existing slope. Second,
since there was no geological structure that would
form a sliding surface, it was likely that instability
would take the form of a shallow circular failure,
as described in Chapter 8. Third, as discussed
in Section 14.3.3, the water table was in the
lower part of the slope and it was appropriate
to use Chart Number 2 (Figure 8.7) to perform
stability analyses. Fourth, for blocky rock with
no significant clay on the joint surfaces, a fric-
tion angle of 35
◦
was estimated; the rock unit
weight was 26 kN/m
3
. Using these data, for the
30 m high slope at a face angle of 60
◦
, it was
possible to use the circular failure design chart
to calculate the rock mass cohesion as approxim-
ately 150 kPa (for FS = 1.75; tan φ/FS = 0.40;
c/γ H FS = 0.11). Figure 4.21 was used as an
additional guideline in selecting shear strength
values.
As a comparison with the back analysis method
of determining rock mass strength, the Hoek–
Brown strength criterion (see Section 4.5), was
used to calculate a friction angle of 38
◦
and a
cohesion of about 180 kPa (input parameters:
σ
ci
= 40 MPa; GSI = 45; m
i
= 10; D = 0.9)
based on the program ROCLAB version 1.007
(Rocscience, 2002a).
The two sets of strength values are reasonably
close, but the difference illustrates the uncertainty
in determining rock mass strengths, and the need
to carry out sensitivity analyses to evaluate the
possible influence on this range in strengths on
stability.
354 Civil engineering applications
14.5.5 Ditch and slope design
The two principle design issues for the project
were the dimensions of the ditch to contain rock
falls, and the stability of the slope excavated to
create the ditch.
Ditch. The required depth and width of the
ditch to contain rock falls is related to both
the height and slope angle of the cut face as
illustrated in Figure 12.21 (Ritchie, 1963). These
design recommendations show that the required
ditch dimensions are reduced for a proposed
face angle of 75
◦
, compared to the existing
60
◦
face. Another factor in the ditch design was
the face angle of the outside face of the ditch.
If this face is steep and constructed with energy
absorbing material, then rocks that land in the
base of the ditch are likely to be contained. How-
ever, if the outer face has a gentle slope, they may
roll out of the ditch.
For a 30 m high rock face at an angle of 75
◦
,
the required ditch dimensions were a depth of 2 m
and a base width of 7 m. In order to reduce the
excavation volume, the ditch was excavated to
a depth of 1 m, and a 1 m high gabion wall was
placed along the outer side of the excavation to
create a vertical, energy absorbing barrier.
Slope stability. The stability of the excavated
slope was examined using Circular Chart No. 2.
The proposed excavation would increase the face
angle from 60
◦
to 75
◦
without increasing the
height of 30 m significantly, and the rock mass
strength and the ground water conditions in the
new slope would be identical to those in the
existing slope. Chart number No. 2 showed that
the factor of safety of the new slope was about
1.3 (c/(γH tan φ) = 0.275; tan φ/FS ≈ 0.2).
Figure 14.15 shows the approximate location
of the potential tension crack, and sliding sur-
face with the minimum factor of safety, determ-
ined using Figure 8.11 (X =−0.9H; Y = H ;
b/H = 0.15).
14.5.6 Construction issues
The excavation was by drill and blast methods
because the rock was too strong to be broken by
rippers. The following are some of the issues that
were addressed during construction:
The blasting was carried out in 4.6 m lifts
using vertical holes. The “step-out” required
at the start of each bench to allow clearance
for the head of the drill was 1.2 m, so the
overall slope angle was 75
◦
. The production
holes were 63 mm diameter on a 1.5 m square
pattern and the powder factor was 0.3 kg/m
3
.
Controlled blasting was used on the final
face to minimize the blast damage to the
rock behind the face. The final line holes
were spaced at 0.6 m and charged with de-
coupled, low velocity explosive at a load
factor of 0.3 kg/m of hole length. The final
line holes were detonated last in the sequence
(cushion blasting) because the limited burden
precluded pre-shear blasting.
The detonation sequence of the rows in the
blast was at right angles to the face in order
to limit the throw of blasted rock on to the
railway and highway, and minimize closure
times.
The track was protected from the impact
of falling rock by placing a 1 m thick layer
of gravel on the track before each blast. This
could be quickly removed to allow operations
of the train.
Near the bottom of the cut it was necessary
to protect from blast damage the masonry
retaining wall supporting the track. This was
achieved by controlling the explosive weight
per delay so that the peak particle velocity
of the vibrations in the wall did not exceed
100 mm/s.
14.6 Case Study V—Stabilization of
toppling failure
14.6.1 Site description
A rock slope above a railway was about 25 m
high, and the rock forming the slope was a blocky
granite in which a toppling failure was occurring
(Wyllie, 1980). Movement of the upper toppling
block was crushing the rock at the base and
Civil engineering applications 355
Tension
crack
Top of slab
removed
~2.5 m
6.0 m
70°
W
Rock anchor
J1
J2
Figure 14.16 Idealized configuration of toppling slabs
in Case Study V showing excavation and bolting.
causing rock falls that were a hazard to railway
operations (Figure 14.16). The site was in a high
precipitation climate, with a moderate risk of seis-
mic ground motions. Stabilization measures were
undertaken to limit the rock fall hazard and to
prevent additional toppling motion.
14.6.2 Geology
The granite at the site was fresh and very strong,
and contained three well-defined sets of joints
with orthogonal orientations. The most promin-
ent set (J1) dipped at about 70
◦
, with the strike at
right angles to the railway alignment. The second
set (J2) had the same strike but dipped at about
20
◦
, while the third set (J3) was near vertical with
the strike parallel to the track. The spacing of
the joints was between 2 and 3 m, and the per-
sistence of the J 1 joint set was in the range of
10–40 m. The joints were planar but rough, and
contained no infilling. Figures 14.16 and 14.17
show a sketch of the slope and the dimensions of
the blocks formed by the jointing.
14.6.3 Rock strength
The compressive strength of the granite was in
the range of 50–100 MPa, and it was estimated
that the friction angle of the joints was between
40
◦
and 45
◦
with no cohesion. These values
were determined by inspection because of the lim-
ited time available to assess the site and plan a
stabilization program.
14.6.4 Ground water
The site experienced periods of heavy rainfall
and rapid snow melt, so it was expected that
transient high water pressures would develop in
the lower part of the slope. In the upper part of
the slope, water pressures were unlikely because
water would not collect in the tension cracks
exposed in the face.
14.6.5 Stability conditions
The uniform spacing and orientation of the J1
joints formed a series of slabs in the slope that
were approximately 2.5 m wide and had vertical
heights of as much as 20 m. The slabs dipped at
about 70
◦
so the center of gravity of the slab lay
outside the base when the height exceeded about
6 m; this was a necessary condition for toppling
(see Figure 1.10). As shown in Figure 14.17, the
upper slab had an exposed face about 7 m high
and toppling of this slab had opened a tension
crack about 200 mm wide along the J1 joint set.
As the upper block toppled, it generated thrust
forces on the lower slabs. The short length of
these lower slabs meant that their centers of grav-
ity were well inside their bases so toppling did not
occur. However, the thrust was great enough to
cause the lower blocks to slide on the J 2 joint
set. This set dipped at 20
◦
and had a friction
angle of about 40
◦
; limit equilibrium analysis of
the sliding blocks showed that the thrust force
required to cause sliding was equal to about 50%
of the weight of the block. This shear displace-
ment caused some fracturing and crushing of the
rock that was the source of the rock falls.
The mechanism of instability at the site was
essentially identical to the theoretical toppling
mechanism discussed in Chapter 9 and shown in
356 Civil engineering applications
Figure 14.17 Toppling failure in Case
Study V. Sketch showing extent of upper
toppling block removed by blasting, and
location of rock bolts in lower slope.
Figure 9.7. That is, the tall, upper slabs toppled
and caused the lower, shorter slabs to slide. Pos-
sible stabilization options for these conditions
included reducing the height of the toppling slabs
so that the center of gravity lay inside the base,
or installing a support force in the sliding slabs
at the base. These two measures were adopted,
with the combined effect of reducing the tend-
ency for the upper slabs to topple, and preventing
movement of the lower slabs.
14.6.6 Stabilization method
The following three stabilization measures were
undertaken to reduce the rock fall hazard and to
improve the long-term stability of the slope:
• Scaling was carried out on the face above
the railway to remove loose rock. This work
included the removal of all trees growing in
open cracks in the rock because these had con-
tributed to the loosening of the blocks of rock
on the face.
• A row of bolts was installed through one of
the lower slabs. This work was done prior to
excavation at the crest in order to prevent any
further movement due to blasting vibrations.
• Blasting was used to remove the upper 6 m of
the top slab. The blasting was carried out in
stages in order to limit blast vibrations in the
lower slope and allow additional bolts to be
installed if further movement occurred. The
blasting pattern comprised 6 m long holes on
about 0.6 m centers, with three rows being
detonated on each blast. A light explosive
charge of 0.4 kg/m
3
was used, with spacers
between the sticks of explosive in the blast
holes.
Chapter 15
Mining applications
Alan F. Stewart, P. Mark Hawley, Nick D. Rose
and Brent W. Gilmore
∗
15.1 Introduction
Rock slope engineering of open pit mines requires
careful application and adaptation of the full
range of tools that have been presented in earlier
chapters of this book. Each ore body and host
rock mass is unique, and comprises distinct-
ive mineralogical assemblages and rock types.
In many instances, stratigraphy may be com-
plexly deformed by geologic forces. Geologic
and geomechanical characteristics, such as litho-
logy, mineralogy, alteration, rock strength, in situ
stress, geologic structure and fabric, and ground
water conditions may vary widely between differ-
ent deposits, and even within a given deposit. The
challenge for the slope designer is first to deter-
mine which of these characteristics are important
in terms of stability. The next step is to plan
and execute focused investigations to obtain the
information required to define the key stability
parameters. Stability analyses are then conducted,
and results are used in conjunction with experi-
ence and judgment to develop slope design criteria
for use by mine planners and operators.
In open pit mining, the optimum slope design
is usually one that maximizes overall slope angles
and minimizes the amount of waste stripping.
At the same time, it must effectively manage the
risk of overall slope instability, and provide for
safe and efficient movement of personnel, equip-
ment and materials during mining operations.
The general methodology for designing open pit
∗ Piteau Associates Engineering Ltd, North Vancouver, BC,
Canada.
mine slopes is described in this chapter by way of
four hypothetical examples. These examples rep-
resent a range of mine design and rock mechanics
issues in a variety of geologic environments.
Most open pit mines are developed using
benches that are designed to contain and control
rock falls and small failures. The geometry of the
pit and slopes is defined by the shape of the ore
body, the height and width of the benches, and the
locations of haul roads and stepouts; Figure 1.5
illustrates a typical pit slope geometry. As dis-
cussed in the following examples, inter-ramp
slopes are defined as slope sections comprised of
multiple benches between haul roads or stepouts.
Haul roads are necessary to provide access to the
ore and waste, and stepouts may be required for
reasons of stability or to accommodate the shape
of the ore body. Overall slopes incorporate inter-
ramp slopes as well as haul roads and stepouts,
and extend from the crest to the toe of the pit wall.
15.2 Example 1—porphyry deposits
This example describes a preliminary slope design
investigation conducted as part of a feasibility
study for a new porphyry copper deposit. Preli-
minary mine plans indicated a maximum open pit
depth of 250 m. No mining activity had occurred
in the deposit, and no previous design stud-
ies had been conducted, other than exploration
drilling, mapping and sampling related to ore
reserve definition.
A geotechnical investigation program was
conducted that incorporated site reconnais-
sance, structural mapping of available outcrops,
358 Mining applications
geomechanical logging of drill cores, and a test-
ing program involving point load index testing of
core, and direct shear testing of selected discon-
tinuities. In addition, six geotechnical coreholes
were drilled to obtain oriented core. Piezometers
were targeted for various holes throughout the
property to monitor ground water levels and
obtain an indication of potential pit dewatering
requirements.
15.2.1 Design issues
The proposed pit would have a modest overall
depth of 250 m, and would be excavated in a com-
petent rock mass with a consistent, pervasive set
of joints and faults related to the genesis of the
deposit. Open pit slope design was expected to be
controlled by the stability of individual benches,
and the need to optimize bench geometry to min-
imize waste stripping. Due to the combination of
moderate overall slope height and a competent
rock mass, inter-ramp and overall slope stability
were not significant concerns.
15.2.2 Engineering geology
The porphyritic intrusion was dacitic in compo-
sition, hosted by tertiary andesites and andesite
breccias, and was hydrothermally altered with
a distinctive alteration zonation ranging from
potassic to phyllic to propylitic. In terms of
rock mass competency, the potassic altera-
tion increased the overall competency of the
rock, whereas the phyllic alteration significantly
weakened the rock and reduced discontinuity
shear strength. Propylitic alteration appeared
to have had little influence on overall rock
competency.
Results of the structural mapping and core
orientation indicated a pattern of radial and
tangential jointing and faulting that appeared
to be centered around the intrusive core. The
radial joint set (Set 1) dipped sub-vertically and
with a strike approximately radial to the cen-
ter of the intrusive complex. These structures
were probably related to the original intrusion
and facilitated development of the hydrothermal
NW trending fault
II
III
I
VI
IV
V
Structural
domain
boundary
Approximate
outline of
intrusive
complex
Figure 15.1 Distribution of structural domains.
system that deposited the ore. The strike of the
tangential set (Set 2) was approximately normal
to Set 1 and dipped at 45–60
◦
towards the cen-
ter. Set 2 was probably formed during collapse
of the hydrothermal system. Peak orientations of
these two principal sets varied depending on their
position in relation to the intrusive center.
Based on the distribution of discontinuity ori-
entations, the deposit was divided into six struc-
tural domains distributed radially around the
deposit, as illustrated in Figure 15.1. Within
each structural domain the geologic structural
fabric was expected to be reasonably consistent.
Figure 15.2 is a stereonet that shows the distribu-
tion of discontinuities in Structural Domain I.
Regionally, northwest trending sub-vertical
faults were present throughout the area. In partic-
ular, a large fault zone with a width of about 10 m
was interpreted to intersect the northeast corner
of the proposed pit.
15.2.3 Rock strength and competency
Field estimates of hardness (ISRM, 1981b)
obtained during geomechanical logging of the
drill core were correlated with point load index
results. Both of these measures of rock strength
indicated a moderately hard rock mass, with
unconfined compressive strengths (UCS) ranging
from about 40 to 100 MPa. Local zones of
phyllic alteration had an average UCS as low as
about 5 MPa.
Mining applications 359
1b
1a
N
S
EW
2
1a
2
1c
1b
1c
Set 1
Set 2
+
+
+
+
Figure 15.2 Stereonet of discontinuities in Structural
Domain I.
Laboratory direct shear testing of selected
joints collected from the drill core indicated
friction angles of between about 30
◦
and 42
◦
,
depending on the type and intensity of altera-
tion present. Results also indicated little or no
cohesion. For faults and fault gouge, the aver-
age friction angle was about 20
◦
with negligible
cohesion.
Geomechanical core logging data, including
RQD, joint spacing, joint condition and hardness,
were compiled, and average Rock Mass Ratings
(RMR) were determined according to Bieniawski
(1976). For purposes of rock mass characteriza-
tion, ground water conditions were assumed to
be dry. The average RMR was 65 (good quality
rock mass) for all core, and ranged from approx-
imately 35 (poor quality rock mass) for phyllically
altered rocks to about 85 (very good quality rock
mass) for potassically altered rocks.
15.2.4 Hydrogeology
Initial monitoring of several piezometers installed
in exploration drill holes indicated low piezomet-
ric pressures in most areas of the proposed pit.
However, water levels appeared slightly elevated
in the northeast, probably in response to the
large regional fault zone described above that may
have been acting as an aquitard to ground water
flow. Localized horizontal drain holes, targeting
areas such as this fault zone, and in-pit sumps
would probably be sufficient to manage expected
ground water volumes. Additional hydrogeolo-
gical assessments would be required as the pit
developed.
15.2.5 Slope stability analyses and
slope design
It is usually impractical and uneconomic to design
open pit slopes such that no failures occur. There-
fore, a more pragmatic approach is to design the
pit with benches, and excavate the slopes under
controlled conditions such that any failures that
do occur are caught and effectively controlled on
berms.
Initially, slope stability analysis involved
assessment of possible failure modes relating to
structural discontinuities (i.e. joints and faults)
that could result in shallow failure of individual
benches, or large-scale failure involving multiple
benches or overall slopes. Subsequent analyses
were conducted to assess the potential for deep-
seated rotational rock mass failure of the ultimate
pit slopes, based on preliminary inter-ramp slope
angles developed from the bench designs.
As noted earlier, the rock mass was divided into
six structural domains arranged in pie-shaped
segments about the center of the intrusive com-
plex (Figure 15.1). Based on the preliminary mine
plan, the rock mass was further subdivided into
design sectors, or zones with consistent geologic
structure as well as uniform pit slope orientation.
Within each design sector, kinematic assessments
were conducted to determine possible failure
modes that could occur (see Figure 2.21). Two
basic failure modes were considered: wedge fail-
ures and plane failures. Figure 15.3 is a stereonet
that shows kinematically possible failure modes
identified in a typical design sector in Structural
Domain I. Limit equilibrium stability analyses,
utilizing discontinuity shear strengths determined
from laboratory direct shear testing, were then
360 Mining applications
1
4
N
S
E
W
105
1c
1b
1a
2
2
1a
1b
1c
Kinematically
possible wedge
failure
Kinematically
possible plane
failure
Average slope orientation
in Design Sector 1
Figure 15.3 Stereonet showing
kinematically possible failure modes
in Design Sector 1.
conducted for each failure mode to determine
which failure modes were critical to design. Crit-
ical failure modes were defined as kinematically
possible failures with factors of safety less than or
equal to 1.2. In addition, the dip direction of crit-
ical plane failures was less than about 30
◦
oblique
to the slope, and the trend of the line of intersec-
tion of critical wedge failures was less than about
45
◦
oblique to the slope.
Surface mapping and general reconnaissance
showed that joints were likely to persist through-
out the rock mass, and to have an average con-
tinuity of about 10–15 m. Consequently, they
were expected to have a significant impact on
breakback of individual benches, but to have lim-
ited importance in terms of overall slope stability.
Faults, although not as prevalent, were much
more continuous and could impact inter-ramp
and overall slopes as well as individual benches.
Based on an assessment of the various critical
failure modes, associated factors of safety and
degree of development of the joint and fault sets
involved, the apparent dip or plunge considered
to control bench stability was determined for each
design sector. It was expected that the blasted and
excavated bench face angles would range from
57
◦
to 62
◦
(“breakback angle”).
Bench height is usually determined by the size
of drilling and excavation equipment, and other
mine planning considerations. In this example,
a bench height increment of 15 m was chosen
for feasibility assessments. In the more com-
petent rocks, 30 m high double benches were
considered appropriate. Double benches typic-
ally allow steeper inter-ramp and overall slopes
to be developed, although the size of poten-
tial failures increases and wider catchment berms
are generally required. In the less competent
rocks, single benches were considered appro-
priate to control raveling and rock falls, as
well as bench-scale wedges and plane failures.
Bench heights, minimum berm widths, and the
apparent dip or plunge considered to control
bench stability determined earlier were used
to determine maximum inter-ramp slope angles
for each design sector. Minimum berm widths
of 8 and 10 m were recommended for single
and double benches, respectively. Recommen-
ded inter-ramp slope design criteria ranged from
38
◦
to 42
◦
for single benches developed in zones
Mining applications 361
of intense phyllic alteration, to 45
◦
to 49
◦
for
double benches developed in competent potassic
and propylitic altered rocks. Results of deep-
seated limit equilibrium stability assessments of
the overall slopes indicated adequate stability
for the proposed maximum slope heights and
recommended inter-ramp slope angles.
15.3 Example 2—stratigraphically
controlled deposits
The process for designing slopes in structurally
complex, stratigraphically controlled deposits is
demonstrated in the following example using a
hypothetical open pit coal mine developed in
intensely folded and thrust-faulted sedimentary
strata. While this example was developed based
on the authors’ experience at several mines in
the Canadian Rocky Mountains and Foothills in
British Columbia and Alberta, the concepts can
be applied to other sedimentary, strataform or
stratabound deposits.
15.3.1 Design issues
Layered ore deposits may be tilted, folded and/or
faulted, such as the coal measures of Western
Canada, the iron ore deposits of Brazil, and a vari-
ety of other deposits hosted in bedded sediment-
ary, foliated metamorphic or layered volcanic
rocks. These deposits often present special issues
for pit slope design. For example, the orientation
of bedding or foliation frequently controls wall
stability and slope design, and ore horizons may
be narrow, resulting in project economics that
may be very sensitive to stripping. Also, the struc-
tural geology is often complex and can vary sig-
nificantly over short distances. Stratigraphy may
also be complicated by thrust and normal faulting
that can both follow and cross-cut strata, result-
ing in apparent stratigraphic thickening, thinning
or truncating. It is often difficult or impractical to
understand fully the geologic complexity of these
types of deposits in advance of mining. As a result,
material changes in the interpretation may occur
during mining as strata are exposed and mapped.
Consequently, design criteria need to be flexible
and readily adaptable to both subtle and dramatic
changes in geologic interpretation.
15.3.2 Engineering geology
In this example of an open pit coal mine, the
bottom of the stratigraphic sequence was charac-
terized by a thick sequence of interbedded Jurassic
marine shales and siltstones (Domain 1). These
were overlain by Cretaceous terrestrial siltstones,
sandstones and minor mudstones (Domain 2),
which in turn underlayed Cretaceous coal meas-
ure rocks comprising interbedded coal, car-
bonaceous mudstones, siltstones and sandstones
(Domain 3). The footwall of the lowest coal
seam comprised a relatively massive, thick sand-
stone unit. Figure 15.4 shows a typical geologic
cross-section through the deposit.
The strata had been deformed into a fold
sequence comprising a synclinal core flanked
by overturned anticlines. Thrust faults had
developed approximately parallel to the axial
planes of the folds, and had thickened the coal
sequence in the core of the syncline.
The stereographic projections in Figure 15.5
illustrate the main discontinuity sets, as deter-
mined by outcrop mapping. The most prominent
discontinuity set was bedding joints (Set A), and
although the dip of this set varied widely, the
strike was relatively constant. Peak orientations
generally fell on a great circle, which was con-
sistent with cylindrical folding (note the inferred
fold axis shown on Figure 15.5(a)). In addition to
bedding joints, two other discontinuity sets were
apparent:
• Set B: strike approximately perpendicular to
bedding, and with sub-vertical dip; and
• Set C: strike approximately parallel to bed-
ding, and dip about normal to bedding.
Collectively these three discontinuity sets formed
an approximately orthogonal system, which is
typical of folded sedimentary rocks. The primary
orientation of regional thrust faulting is also
indicated on Figure 15.5(b).
362 Mining applications
W E
Symbols
Domain boundary
Domain
(H =highwall, F = footwall)
Trace of axial plane
(overturned anticline, syncline)
Trace of bedding plane
Thrust fault
1H
2H
3H
2F
3F
2F
3F
3F
3F
1F
1H
Legend
Coal measures, Cretaceous (Domain 3)
Sandstone
Jurassic shale/mudstone (Domain 1)
Undifferentiated
sediments
Cretaceous
(Domain 2)
Figure 15.4 Example 2—typical geologic cross-section of coal formation (modified after Hawley and Stewart
(1986)).
A
(a) (b)
B
B
C
Pole to axial
plane
Pole to region
of thrusting
Figure 15.5
Example 2—stereographic
projections of poles to
discontinuities: (a) bedding and
bedding joints; (b) cross-joints and
faults.
15.3.3 Rock strength and competency
Estimates of intact rock strength, discontinuity
shear strength and general rock mass compet-
ency were developed from geomechanical core
logging, point load testing, and laboratory
unconfined compressive strength and direct shear
testing.
The marine shales and siltstones that form the
base of the sedimentary sequence were thinly bed-
ded, fissile, fair quality rocks. They had low
durability and tended to slake and degrade when
Mining applications 363
exposed. These rocks were highly anisotropic
with UCS ranging from about 35 MPa along bed-
ding to about 80 MPa across bedding. Bedding
joints were closely spaced (<0.3 m), and RMR
values typically ranged from 40 to 50 (i.e. fair
quality rock mass).
The Cretaceous siltstones and sandstones that
formed the footwall of the coal measures were
more massive and competent than the under-
lying Jurassic rocks. Bedding joint spacing was
about 1 m, UCS was typically greater than about
150 MPa and RMR was greater than about 60
(i.e. good quality rock mass).
The competency of the coal measure rocks was
extremely variable. At the low end were sheared
coal seams with UCS of about 14 MPa or less, and
RMR of about 30 (i.e. poor quality rock mass).
Carbonaceous shales and mudstones were slightly
more competent with UCS of about 25 MPa and
RMR of about 40. Interseam siltstones and sand-
stones were the most competent, with strengths
similar to the sedimentary rocks in the immediate
footwall of the coal measures.
The shear strength of the discontinuities also
varied widely, depending on the discontinuity
type, lithology and infilling materials. Faults,
shears and bedding joints in coal had a nominal
friction angle of about 23
◦
and negligible cohe-
sion. Carbonaceous bedding and cross-joints had
a nominal shear strength of about φ = 25
◦
, c =
15 kPa, while non-carbonaceous bedding and
cross-joints had a nominal shear strength of about
φ = 36
◦
, c = 60 kPa.
15.3.4 Hydrogeology
The ground water flow system was anisotropic,
with high hydraulic conductivity in the plane of
bedding compared to that across bedding. Coal
seams and fractured sandstone and siltstone units
tended to act as aquifers, and shale/mudstone
units tended to act as aquitards. The principal
direction of ground water flow was parallel to
the plunging axes of the folds. Because topo-
graphy tended to mimic the gross fold struc-
ture, artesian conditions could exist in the toes
of excavated footwall slopes. Horizontal drain
holes were required to control potentially adverse
piezometric pressures in footwall slopes. High-
wall slopes were typically moderately to well
drained, and enhanced depressurization was not
normally required for these walls.
15.3.5 Structural domains
Based on stratigraphic and competency consider-
ations, the rock mass was first subdivided into
three structural domains: the Jurassic shales and
siltstones (Domain 1), the footwall siltstones and
sandstones (Domain 2), and the coal measures
(Domain 3). Each domain was further subdivided
based on the orientation of bedding with respect
to proposed slope orientations. Footwall domains
(F) were defined as domains where bedding strikes
parallel to the proposed slope and dips in the same
direction as the slope. Highwall domains (H) were
defined as domains where bedding strikes paral-
lel to the proposed slope and dips into the slope.
Domains are shown on Figure 15.4.
15.3.6 Kinematic analyses
Kinematic assessments were conducted for each
domain using stereographic projection techniques
described in Chapter 2 to determine possible
failure modes. These analyses confirmed that pos-
sible failure modes were highly dependent on the
orientation (both strike and dip) of the slope with
respect to bedding. Some examples of kinematic-
ally possible failure modes that were considered
are illustrated schematically in Figure 15.6.
For footwall domains, the key failure modes
that controlled stability all involved sliding along
bedding discontinuities. Simple plane failure may
have occurred where the slope undercut bedding
(Figure 15.6(a)), or bedding was offset by fault-
ing (Figure 15.6(b)). More complex failure modes
may also have occurred, such as bilinear failure
involving shearing through the toe of the slope
(Figure 15.6(c)), ploughing failure where a driv-
ing slab forces a key block to rotate out of the toe
of the slope (Figure 15.6(d)), or bucking failure
(Figure 15.6(e)).
364 Mining applications
Bedding joint
Failure slab
Fault
(a) (b) (c)
(d) (e) (f)
(g) (h)
Figure 15.6 Example 2—kinematically possible failure modes.
For highwall domains, the key failure modes
that controlled stability included toppling on bed-
ding (Figure 15.6(f)), stepped-path plane failure
involving sliding along cross-joints with release
on bedding joints (Figure 15.6(g)), and raveling
(i.e. rock falls involving individual detached rock
blocks) (Figure 15.6(h)).
15.3.7 Stability analyses
Stability analyses were conducted for each of the
primary modes of failure in each domain using
limit equilibrium techniques. Failure models were
developed to assess the sensitivity of stability to
variations in the geometry of the slope, bedding
orientation, bedding joint spacing, rock mass
competency, discontinuity shear strength and
ground water conditions. The analyses techniques
used for simple plane, wedge and toppling failure
were similar to those presented in Chapters 6, 7
and 9. More complex failure modes, such as bilin-
ear slab, ploughing and buckling failure, were
analyzed using limit equilibrium methods similar
to those described by Hawley et al. (1986).
Analyses results for footwall domains were
presented in the form of stability curves that
related the dip of bedding to slope or bench
height for a given factor of safety. As illustrated
schematically in Figure 15.7, multiple curves were
developed for each mode to assess sensitivity to
Mining applications 365
Slope height, H
Slope height, H
Bedding dip,
p
Vertical dowel spacing, V
Increasing
t
Increasing
2
Increasing
p
H
t
Bedding dip,
p
Bedding dip,
p
H
Dowels
V
Horizontal dowel spacing, S
d
S
b
H
Increasing
f
Spacing of joints, S
b
p
f
p
p
p
2
(a)
(c)
(b)
(d)
Figure 15.7 Schematic illustration of stability analysis results: (a) plane failure; (b) ploughing failure;
(c) toppling failure; (d) slab failure with artificial support (modified after Hawley and Stewart (1986)).
variations in key parameters, such as the spacing
of bedding joints, or the dip of cross-joints, and
to assess the cost/benefit of artificial support.
For highwall domains, analysis results for
potential plane, wedge and stepped path failures
were presented in terms of expected breakback
angles using a similar approach as described in
Example 1. Analyses results for potential toppling
failure were presented in the form of stability
curves that relate bedding joint dip and spacing
to stable bench face angle (see Figure 15.7(c)).
15.3.8 Slope design concepts
To provide the mine planners with flexible design
criteria that could be easily adapted to changing
geologic conditions, a series of slope design con-
cepts were developed. Each concept consisted of
a basic slope type, and specific slope design cri-
teria. Each concept was applicable within a given
domain over a specified range of geologic condi-
tions. Table 15.1 summarizes the various slope
design concepts, associated basic slope types,
their range of applicability, and critical failure
modes that control slope design and pertinent
comments.
In developing the slope design concepts, some
basic slope parameters first had to be defined
in consultation with the mine planners. These
included fixed criteria, such as bench height incre-
ment and minimum catch berm width, which
were based on the size of the mining equipment
and regulatory requirements, and more subjective
considerations, such as the overall design factor
of safety and acceptable level of risk.
In some cases, more than one slope design
concept was applicable. For example, artificial
support was an alternative that provided a steeper
slope design than a conventional approach.
Alternative slope design concepts provided the
mine planners with additional flexibility. The
decision as to which alternative to adopt was
based on specific cost/benefit analyses, opera-
tional convenience or other criteria.
Table 15.1 Slope design concepts
Slope
design
concept
Basic
slope
type
Bedding
orientation
Illustration Critical
failure
modes
Applicability Design criteria
F-I Benched
footwall
slope; bedding
undercut.
Bedding dips
shallowly out
of the slope.
Stepped planar
failure on
bedding.
Domains where
bedding joints are
discontinuous or
bedding dip is
flatter than the
friction angle.
Excavate benched slope. Benches
designed to limit the size of
potential stepped failures and
provide catchment for small
failures and raveling debris.
F-ll Unbenched
footwall
slope; bedding
not undercut.
Bedding dips
shallowly to
moderately
out of the
slope.
Planar failure
on bedding.
Domains where
bedding joints are
continuous or
bedding dip is
steeper than the
friction angle, but
not steep enough
to initiate
buckling,
ploughing,
bilinear or other
slab-type failures.
Excavate slope parallel to bedding.
Do not undercut bedding.
F-III Benched
footwall
slope; bedding
not undercut.
Buckling,
ploughing,
bilinear or
other
slab-type
failures.
Domains where
bedding joints are
continuous and
bedding dip is
significantly
steeper than the
friction angle.
Excavate bench faces parallel to
bedding. Do not undercut
bedding. Bench height designed to
limit potential for development of
slab-type failures. Bench width
designed to provide catchment for
small failures and raveling debris.
Bedding dips
moderately to
–
F-IV Unbenched,
supported
footwall
slope; bedding
not undercut.
steeply out of
the slope.
Buckling,
ploughing,
bilinear or
other
slab-type
failures.
Domains where
bedding joints are
continuous and
bedding dip is
significantly
steeper than the
friction angle.
Excavate slope parallel to bedding.
Apply artificial support to prevent
development of major slab-type
failures.
H-I Benched,
unsupported
highwall
slope.
Toppling;
raveling.
Domains where
bedding joints are
continuous and
closely spaced.
Excavate slope using single
benches. Flat bench face angle
designed to limit potential for
toppling. Minimal bench width
designed to provide catchment for
raveling debris.
Bedding
dips
–
H-II Benched,
supported
highwall
slope.
steeply
into slope.
Toppling;
raveling.
Domains where
bedding joints are
continuous and
closely spaced.
Excavate benched slope. Artificial
support designed to limit potential
for toppling, maximize bench
height and/or bench face angle
and/or increase available bench
width to contain small slab-type
failures and raveling debris.
H-III Benched,
unsupported
highwall
slope.
Bedding dips
shallowly to
moderately
into slope.
Planer, stepped
planar,
wedges or
stepped
wedges on
cross-joints;
raveling.
Domains not
subject to other
kinematically
possible failure
modes.
Excavate benched slope. Benches
designed to limit the size of
potential planar, wedge and
stepped failures and provide
catchment for small failures and
raveling debris.
Source: Adapted after Hawley and Stewart (1986).
Mining applications 367
Bedding dip (degrees)
Bench height (m)
Recommended bench
height design criteria
Range of analysis
results for bilinear
failure
Range of analysis results
for ploughing failure
20
60
100
0
40
80
20 6040 8030 7050 90
Figure 15.8 Example 2—typical
footwall bench height design
criteria (modified after Hawley
and Stewart (1986)).
Specific design criteria were developed for the
slope design concept in each domain based on
the results of the stability and sensitivity ana-
lyses. Critical failure modes were determined for
each basic slope type, and analyses results were
used to define ranges of acceptable slope and
bench geometries. For footwall domains, the
results of plane, bilinear and ploughing failure
analyses were used to define allowable unbenched
slope heights based on the dip of bedding (e.g.
Figure 15.8). For highwall domains, toppling fail-
ure analyses were used to define the ranges of
bedding dip where toppling failure controlled sta-
bility, and to assess appropriate slope geometries
to prevent toppling. For highwall domains not
subject to toppling, design criteria were based on
predicted breakback and minimum catch bench
widths required to control small wedge and plane
failures, and raveling.
15.3.9 Preliminary design
A preliminary slope design was prepared based
on the slope design concepts described before.
Detailed geotechnical sections were constructed
at regular intervals normal to the proposed slopes.
On each section, a provisional pit bottom and
slope toe were determined in consultation with
mine planners. Based on the domain and ori-
entation of bedding in the toe of the slope, an
appropriate slope design concept was selected and
applied. This slope design concept was projec-
ted upwards for as far as conditions remained
appropriate. When a point was reached where the
conditions were no longer applicable, a new slope
design concept was chosen. This process was
repeated until the full wall height was developed
and the pit crest was reached on each geotech-
nical section. Figure 15.9 is an example of how
this iterative process was applied to the typical
cross-section given in Figure 15.4.
To achieve a practical overall slope design,
it was necessary to blend the slope geometry
between sections. Bench heights and berm widths
had to be modified locally to deal with local
rolls in the bedding, the occurrence of faults and
other geologic complexities. Once the prelimin-
ary design was completed, an assessment of the
potential for overall or deep-seated slope instabil-
ity was conducted, and slope geometries were
modified as required to meet minimum overall
slope stability objectives.
368 Mining applications
W E
Symbols
Slope design concept
Design sector boundary
Legend
Coal measures, Cretaceous (Domain 3)
Sandstone
Jurassic shale/mudstone (Domain 1)
Undifferentiated
sediments
1H
2F
2F
3F
3F
H-III
H-III
H-II
H-I
F-III
F-II
F-IV
F-I
F-II
Pit
Cretaceous
(Domain 2)
Figure 15.9 Example 2—slope design concepts applied to typical geologic cross-section (modified after Hawley
and Stewart (1986)).
15.4 Example 3—deep-seated deformation
in a weak rock mass
Weak rock mass conditions can occur in many
types of ore deposits, especially where ore depos-
ition is associated with alteration or complex
structural zones. The lithologies associated with
these conditions can be considered to represent a
wide range of geological environments including:
(i) highly fractured plutonic rocks (e.g. copper
porphyry deposits); (ii) metasedimentary or meta-
volcanic rocks (e.g. shear hosted gold deposits);
or (iii) mafic volcanic rocks (e.g. asbestos depo-
sits). This example is a generalized case history
of combined experience at four operating mines
with open pit slopes ranging from 300 to 500 m
high. The main similarity between these projects
is the presence of a weak rock mass associated
with a near-vertical regional fault or shear zone,
exposed in the lower portion of one of the pit
walls, that defines a boundary to the ore body.
Overall, these rock masses are variably
altered, structurally complex and exhibit high
ground water pressures. Slope depressurization is
difficult due to structural compartmentalization
of ground water and low rock mass conductivity.
15.4.1 Design and operational issues
Large-scale pit slopes may be prone to deep-
seated deformation due to stress concentrations
in the highly deformable weak rock mass in the
toe of the slope, or complex modes of failure
such as squeezing or toppling extending to a
considerable depth behind the face. These con-
ditions often require a number of analytical and