High Temperature Strain of Metals and Alloys Part 8 docx
Bạn đang xem bản rút gọn của tài liệu. Xem và tải ngay bản đầy đủ của tài liệu tại đây (251 KB, 15 trang )
6.6 Composition of the γ
Phase and Atomic Vibrations 103
Tab. 6.5 Compositions of B
3
A (γ
) phases and the mean-square
atomic displacements.
Phase u
2
B
, pm
2
u
2
A
, pm
2
723 K 873 K 1023 K 723 K 873 K 1023 K
Ni
2.96
Fe
0.02
Al
1.00
330 470 660 380 580 810
Ni
2.95
Fe
0.05
(Al
0.85
Ti
0.15
) 380 440 600 290 370 460
Ni
2.83
Fe
0.04
Cr
0.07
Mo
0.06
250 380 550 180 230 330
(Al
0.51
Ti
0.31
Nb
0.07
Mo
0.08
Cr
0.03
)
Ni
2.83
Fe
0.04
Cr
0.08
W
0.03
Mo
0.02
230 340 450 30 60 80
(Al
0.43
Ti
0.28
W
0.08
Mo
0.03
Cr
0.10
)
Ni
2.76
Co
0.09
Fe
0.01
Cr
0.06
Mo
0.02
260 340 580 20 40 50
(Al
0.79
W
0.08
Mo
0.11
Cr
0.03
)
the diffusion mobility in the crystal lattice. The probability of an atom transfer
to an adjacent node of the crystal lattice also increases. The smaller the am-
plitudes of the atomic vibrations, the greater the high-temperature strength
of the γ
phase. A decrease in amplitudes results in an increase in the value
of the activation energy ∆U in Eq. (6.13) and the creep rate decreases.
In the first phase, practically pure Ni
3
Al (Table 6.5), the atomic displace-
ments of the lighter atoms of aluminum (nodes A) appreciably exceed the dis-
placement of the nickel atoms (nodes B) at all tested temperatures,
u
2
A
> u
2
B
.
The replacement of approximately one sixth of the aluminum atoms with
titanium atoms decreases the amplitudes of the heat vibrations in the alu-
minum sublattice, so that now
u
2
A
< u
2
B
. The effect of titanium dissolution
in the sublattice A on decreasing amplitudes becomes more evident if the
temperature rises. The effect of adding molybdenum and tungsten to the γ
phase is even greater. One can see from Table 6.5 that the values u
2
A
are 10–16
times less at 1023K in phases containing both these elements.
The vibration amplitudes decrease less in the sublattice B. The decrease
of
u
2
A
is not proportional to the growth of the mean atomic mass because
of Mo and W dissolution, but exceeds it essentially. Actually, the effective
mass of atoms A in the investigated strengthening phases increases only
by 64–78% in comparison with the effective mass of aluminum atoms. The
mass of atoms dissolved at the B nodes is close to that of nickel. This fact is
evidence of the growth of interatomic bonds in the crystal lattice of the alloyed
γ
phase. Comparing the values of the mean-square atomic displacements in
the sublattice A for phases of different composition we can conclude that
they are related, mainly, to the sum of the atomic parts of molybdenum and
tungsten. In Table 6.5 the phases are ordered by increasing this sum while
decreasing
u
2
A
.
104 6 High-temperature Deformation of Superalloys
An energetically efficient mechanism of an elementary diffusion event in
the γ
phase consists of a certain cycle of a vacancy shift. The nodes of both
sublattices must be included in this cycle which is why the diffusion mobility
of elements in the crystal lattice of the γ
phase can be decreased essentially
although the mean-square amplitudes are decreased only significantly in the
aluminum sublattice.
We have compared the mean-square atomic amplitudes in strengthening
phases of superalloys with the rate of the steady-state creep ˙ε of the same
alloys. The superalloy EI437B with
u
2
A
= 460 pm
2
at 1023K has the least
high-temperature strength of the three alloys listed in Table 2.1 whereas the
superalloy EI867 with
u
2
A
=50pm
2
, has the greatest strength.
6.7
Influence of the Particle Size and Concentration
It is the cut of the precipitates that is the rate-controlling process when the av-
erage distance between particles is smaller than a critical value. However, the
interaction of dislocations with particles is dependent on the size of the parti-
cles and on the distance between them. The Orowan mechanism of obstacles
bowing can also be rate-controlling.
The mean particle size and the average distance between particles are de-
pendent on one another. Manonukul et al. [37], by assuming that the precipi-
tates of the γ
phase are arranged in a three-dimensional array, have proposed
to a simple, first approximation, that
λ
p
=
4π
3c
1/3
− 2
2r (6.20)
where
λ
p
is the average distance between particles, c is the volume fraction of
the γ
phase, 2r is the mean particle size, as before. The results of calculations
according to Eq. (6.20) are presented in Table 6.6.
Particle sizes change during ageing at a constant temperature. Both the
particle size and the volume fraction increase. This process is called coarsen-
Tab. 6.6 The mean particles distance λ
p
, nm as a function of the average particle size
and of the γ
phase concentration.
c 0.10 0.15 0.20 0.25 0.30 0.35 0.40 0.45
Ratio λ
p
/2r 1.47 1.03 0.76 0.56 0.41 0.29 0.19 0.10
λ
p
when 2r =20nm 29.4 20.6 15.2 11.2 8.2 5.8 3.8 2.0
λ
p
when 2r =60nm 88.2 61.8 45.6 33.6 24.6 17.4 11.4 6.0
6.7 Influence of the Particle Size and Concentration 105
ing and has an appreciable effect on creep rate. This is reflected in Eq. (6.13),
in which the average particle size, 2¯r, appears within the exp term.
The dependence of precipitate size on time can be represented by the em-
pirical equation given in [37]
2
r =2r
0
+2.96 × 10
5
t
1/3
exp(0.012T ) (6.21)
where the time t is in hours. In Fig. 6.19 the corresponding dependence is
shown for two temperatures.
There is a critical value λ
pc
as well as a critical particle size. If λ
p
≤ λ
pc
the rate-controlling mechanism is the cutting of γ
-particles by slipping dis-
locations. If λ
p
>λ
pc
the rate-controlling mechanism becomes dislocation
bowing.
The C263 superalloy is strengthened by titanium, aluminum, chromium,
molybdenum and cobalt. The volume fraction of γ
phase is equal to 0.095.
In Fig. 6.20 the creep curves for this superalloy are shown. At 1073K and
stress 160MPa the critical particle size was found to be 85 nm. Therefore the
dislocations overcome obstacles with thermally activated cutting. Coarsening
of particles takes place, however, and afterapproximately1.7×10
6
s (472 h) the
critical particle size, 85 nm is achieved, and the rate-controlling mechanism
becomes dislocation bowing. This is indicated in Fig. 6.20 where the transfer
from steady-state to tertiary creep is clearly seen.
It is reasonable, for completeness, to consider the case in which the pre-
cipitate dissolves out such that c =0. The slip of dislocation is controlled by
dislocation networks. The length of the activated dislocation segment l equals
the distance between pinning points.
Fig. 6.19 The increase in the average particle size with time.
B, 973K; C, 1073K.
106 6 High-temperature Deformation of Superalloys
Fig. 6.20 Creep curves in C236 superalloy at 1073K. B, stress
160MPa; C, stress 200MPa. Data from Ref. [37].
6.8
The Prediction of Properties on the Basis of Integrated Databases
Comprehensive tests and investigations are needed in order to design new
superalloys. Variation of the chemical composition of superalloys is known to
be the main method for optimization of alloy properties, however, there are
an astronomical number of combinations. Therefore another approach has
been developed, which consists in the prediction of properties of new alloys.
The idea is as follows [30]. The known data (from the literature and indus-
trial sources) on dependences of certain characteristics (such as the rupture
life, the yield stress, the lattices parameters) on the element concentration
have to be gathered and put into a computer database. A special program is
used to predict the properties of a new superalloy.
This approach does not take into account the physical processes. The struc-
ture of alloys, solution and precipitation of phases, the influence of elements
on interatomic bonds, the mechanism of deformation are not considered.
Moreover, the additive action of alloying elements on properties is also ig-
nored. Nevertheless, such an approach is substantiated, because our knowl-
edge about the extremely complex processes in superalloys is too limited to
be used to predict the properties. The investigators try to evaluate the errors
of prediction and to compare the results with experimental data.
Tancret et al. [30] write: “Because the influence of the composition and
processing parameters on the material properties is extremely complex and
multivariate, designing an alloy “to measure” is not feasible using experi-
ence alone. Modern alloys contain many chemical elements added to achieve
particular properties. The influence of individual alloying elements on me-
6.8 The Prediction of Properties 107
chanical properties can be measured and understood in isolated cases; simple
interactions between two or three elements can be formulated, but describing
all the interactions as a whole is generally impossible”.
The Gaussian processes of the modelling of mechanical properties have
been described. A stochastic process is called a Gaussian process if all the
distributions are subjected to the corresponding distribution.
Suppose that N alloys have been studied. Each tested ith alloy is asso-
ciated with an input vector x
i
. The obtained data D are considered as N
input vectors {x
1
,x
2
, x
N
} =[X
N
]. There are N corresponding outputs
or targets {t
1
,t
2
, , t
N
} =
t
N
, each target being a measurement. The joint
probability distribution, in an N-dimensional space, of the target vector
t
N
is denoted by an expression P (
t
N
|[X
N
]). The known data are denoted by
D = {
t
N
, [X
N
]}. One may consider the data D as an input matrix, where
every column represents one superalloy and every row contains the values of
the same characteristic throughout all alloys.
The aim is to predict the output value, t
N+1
, corresponding to a new in-
put vector, x
N+1
(i.e. a new alloy or test conditions). This means to calcu-
late the one-dimensional probability distribution over the predicted point
P (t
N+1
|x
N+1
,D), given a knowledge of the corresponding input vector,
x
N+1
, and the data D. The new point is given by the following relationship
P (t
N+1
|x
N+1
,D)=
P (t
N+1
,
t
N
|x
N+1
, [X
N
])
P (
t
N
|[X
N
])
(6.22)
The model assumes that the joint probability distribution of any N output
values is a multivariate Gaussian.
Equation (6.22) can be reduced to a univariate Gaussian of the form
P (t
N+1
|x
N+1
,D)=
1
√
2πσ
t
exp
−
(t
N+1
− t
m
)
2
2σ
2
t
(6.23)
where t
m
is the mean value, σ
t
is its standard deviation.
We refer the reader for details to Ref. [30] and to references therein. The
authors have collected the data concerning mechanical properties and, espe-
cially, creep rupture stress.
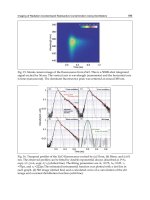
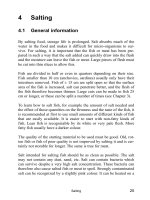
In Fig. 6.21 the predicted and actual effects of stress on rupture life for
IN939 superalloy are presented. This figure shows that the error of the method
is about ±15–20%.
Using the described technique the authors try to estimate the influence
of alloying elements upon the properties of superalloys. Titanium and alu-
minum, when used as the γ
formers, increase creep rupture stress. However,
the respective influence of Al and Ti atoms seems to be inverted. Since tita-
nium atoms are bigger than aluminum atoms (by 4%) they induce an increase
108 6 High-temperature Deformation of Superalloys
Fig. 6.21 Predicted and actual relation between creep
rupture stress for IN939 superalloy and its rupture life, t
r
.
Temperature of tests 1143K. Reprinted from Ref. [30] with
permission from Maney Publishing.
in the γ
parameter and γ
/γ mismatch and thus influence the strain fields. Ti
also increases the anti-phase boundary energy of the γ
phase, which makes
the cutting of particles by dislocations more difficult. Titanium is thus ex-
pected to increase the yield strength more than aluminum and this has been
recognized by the Gaussian process. On the other hand, it has been shown
that an excessive increase in the γ
/γ misfit reduces the creep strength. Thus,
adding titanium, although it increases creep strength by promoting γ
pre-
cipitation, is less effective than adding aluminum because of a higher lattice
misfit, which is also predicted by the model.
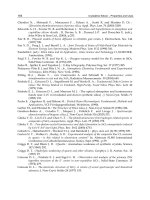
Fig. 6.22 Predicted influence of Co, Mo and W content on the
creep rupture stress at 1023K of the Ni–20Cr–1Al–1Ti–10Co
superalloy. Reprinted from [30] with permission from Maney
Publishing.
6.9 Summary 109
The authors’ predicted influence of Co, Mo and W atoms is presented in
Fig. 6.22. All these elements increase the creep resistance of nickel-based
superalloys, in agreement with known results. It is obvious from this figure
that the error of prediction of about 50% and more shown by the bars is too
great.
The value of the method seems to lie in the possibility to cast out “bad”
solutions even though it fails to find “good” solutions.
6.9
Summary
Superalloys have been developed for aircraft and industrial gas turbines,
rocket engines and space vehicles.
The structure of nickel-based superalloys consists of the γ matrix and the
γ
phase precipitations. This phase is a solid solution of various elements in
the intermetallic compound Ni
3
Al. The γ
phase has remarkable properties;
in particular it hardens with increasing temperature.
Dislocation sub-boundaries form in the matrix of superalloys under the
influence of the applied stress. The loading results in an increase in the
subgrain misorientations and a decrease in subgrain size in the matrix. The
moving dislocations cut the particles during the steady-state stage of creep.
The most probable mechanism of the cutting is a diffusion-controlled motion
of partial dislocations with the anti-phase boundary in the ordered phase. At
the stage of the tertiary creep the shape of the particles becomes irregular as
the coarsening of precipitates takes place.
The experimental dependences between the logarithm of the minimum
strain rate and the applied stress for superalloys are linear. Hence the min-
imum creep rate of superalloys depends exponentially on stress. The com-
puted lengths of the thermally activated dislocation segments are one order
less than the average particle sizes.
The minimum strain rate of superalloys is expressed as
˙ε = bf(c)N
νb
2
0.24 · 2r
exp
−
∆U
kT
exp
0.12τb
2
· 2r
kT
(6.24)
where f(c) is a decreasing function of the concentration of the γ
phase, N
is the dislocation density, 2¯r is the average particle size, ∆U is an activation
energy, τ is the shear stress in the slip plane.
The activation energies, ∆U, for the high-temperature steady-state creep
of superalloys are estimated to vary from 4.18 ×10
−19
to 5.22 ×10
−19
Jat.
−1
when the dislocation density is assumed to be of the order of 10
12
m
−2
.
110 6 High-temperature Deformation of Superalloys
In a phase of type B
3
A (Ni
3
Al) Ti atoms occupy places in sublattice A. Cr,
Fe and Co atoms are located mostly in sublattice B. Atoms of Mo, Nb and
W partition between the two sublattices but are mainly located in A. Under
the effect of solution of W, Mo and Ti atoms in the Ni
3
Al phase the mean-
square vibration amplitudes of A-atoms decrease from 810 to 50–80 pm
2
at
1023K. The smaller the mean-square amplitudes of the atom vibrations in
the hardening phase the higher the creep strength of a superalloy.
Methods of prediction of the properties of new superalloys are being devel-
oped on the basis of integrated databases of superalloy composition and test
results. The error of prediction is from 15 to 50%.
High Temperature Strain of Metals and Alloys, Valim Levitin (Author)
Copyright
c
2006 WILEY-VCH Verlag GmbH & Co. KGaA, Weinheim
ISBN: 3-527-313389-9
111
7
Single Crystals of Superalloys
7.1
Effect of Orientation on Properties
Single crystals of the nickel-based superalloys were developed for gas tur-
bine applications in the 1970s and 1980s. Single-grained castings replaced
polycrystalline moldings for some engines with a view to avoiding slip and
fracture along grain boundaries. The single-crystal superalloys have superior
creep, fatigue and thermal properties compared to conventional cast alloys
because the grain boundaries have been eliminated. Their components are
able to operate at temperatures 200–300K higher, up to 1373K. The rupture
life is considered to be at least 20–40% greater than that of polycrystalline
superalloys.
Cast nickel-based single-crystal superalloys are utilizedforblades in aircraft
and in stationary gas turbines. The blades of very complex geometry are often
constructed with channels so that cooler air can be forced to flow within the
blades during operation.
Single crystals are manufactured by means of the directional crystallization
technique. The preferred crystal growth direction is the < 001 >, i.e. along the
cube side, as compared with < 011 > and< 111 >. TheYoung’s modulushas
a minimal value in the < 001 > direction, so that the thermal stresses in this
direction are minimal. The anisotropy coefficient of the Young’s modulus is
equal to 2.2,whereas the mechanical propertieshave the anisotropy coefficient
of 1.4 at high temperatures.
Many manufacturers recommend to produce the single crystal blades with
< 001 > orientation, however, in practice, there is a misalignment from exact
< 001 > orientation.
The creep behavior of single crystal superalloys is highlyanisotropic. Under
otherwise equal conditions the orientation of a superalloy single crystal is the
factor which contributes to the overall creep strength.
112 7 Single Crystals of Superalloys
The shear stress in a crystalline plane is known to be determined by the
Schmid law
τ = σ ·cos ϕ ·cos ψ (7.1)
where τ is the shear stress in the slip plane, σ is the applied stress, ϕ is the
angle between the applied stress and the perpendicular to the slip plane, ψ is
the angle between the applied stress and the slip direction.
The values of the Schmid factors are shown in Table 7.1. The < 001 > ori-
entation is a multiple slip orientation. All the {111} slip planes are equivalent.
When an orientation moves from < 001 > the Schmid factor increases since
the angles ϕ and ψ decrease. One can see that the Schmid factors are less
for the < 111 > tensile direction than for < 100 > (0.27 in comparison with
0.41). A < 111 > oriented single crystal has to have a higher creep strength.
Some dislocation splittings are also shown in Table 7.1. For crystals oriented
near the < 001 > direction (the tensile axis is also directed along the < 001 >)
the dominant crystalline shear system is {111} < 110 >. This is the so-
called octahedral slip. The system {111} < 110 > operates most frequently
at temperatures in the vicinity of 1023K. The dislocations with the Burgers
Tab. 7.1 The Schmid factors in the cubic face-centered γ,γ
crystal lattices and examples of the dislocation splitting. (hkl),
indexes of the slip plane; [uvw], indexes of the slip direction.
APB, anti-phase sub-boundary; SISF, the superlattice intrinsic
stacking fault.
Axis of (hkl)[uvw] Schmid Eventual
tension factor dislocation splitting
[001] (111) [
¯
101] 0.41 a/2[
¯
101] → a/6[
¯
112] + a/6[
¯
2
¯
11]+APB
[0
¯
11] 0.41
[110] 0
(
¯
111) [0
¯
11] 0.41 a/2[0
¯
11] → a/3[1
¯
12] + a/6[
¯
2
¯
1
¯
1]+SISF
[10
¯
1] 0.41
[
¯
110] 0
(
¯
1
¯
11) [011] 0.41
[101] 0.41
[
¯
110] 0
(1
¯
11) [011] 0.41
[
¯
101] 0.41
[110] 0
[
¯
111] (111) [
¯
110] 0.27 a/2[
¯
110] → a/6[
¯
121] + a/6[
¯
21
¯
1]
+APB
[
¯
101] 0.27
[0
¯
11] 0
[111] (
¯
111) [110] 0.27 a/2[110] → a/3[211] + a/6[
¯
11
¯
2]+SISF
[101] 0.27
[0
¯
11] 0
7.1 Effect of Orientation on Properties 113
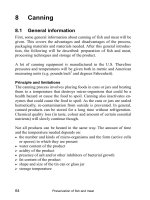
Fig. 7.1 Bar graphs of the orientation
distributions of single-crystal blades fab-
ricated from ZhS6UVI superalloy. Along
the x-axis the angle of a misalignment
from the < 100 > direction is plotted.
The statistical population consists of
2000 blades. Data are shown for cooled
blades (a) and for uncooled blades (b).
Unallowed orientations are shaded.
vector a/2 < 110 > tend to dissociate, as shown in Table 7.1. Therefore slip
occurs in the < 001 > oriented crystals on the system {111} < 112 > at
1023–1123K.
A high primary creep strain and a short rupture life are observed for the
< 011 > oriented single crystals. This is caused by the predominance of a
single {111} < 112 > system. The specimens crept under relatively high
stresses in the < 111 > orientation reveal very low resolved stress in all
{111} < 112 > equivalent slip systems and so creep strength in this orienta-
tion is maximal.
The cube slip {001}< 110 > appears when the material is loaded uniaxially
along a direction far from < 001 >. The higher the temperature the more
propensity for cube slip.
Rubel [40] presented the distributions of orientations in a large group of
cast single-crystal gas-turbine blades. These data are shown in Fig. 7.1. The
relative frequency of misalignment from the < 001 > direction ranged from
20 to 55
◦
. He investigated a series of single blades. In Table 7.2 the initial
orientations of the specimens and the results of the creep tests are presented.
Tab. 7.2 The crystal orientations of the ZhS26VI superalloy single
crystals and results of creep tests at T = 1248K and σ = 226 MPa.
Number ∆θ
[001]
∆θ
[011]
∆θ
[111]
Rupture life, h
1 42.6 8.8 26.5 58.0
2 23.6 20.4 38.1 64.0
3 24.4 19.8 38.0 88.3
4 39.9 20.0 18.3 103.0
5 39.5 20.6 18.6 106.0
6 14.5 30.9 42.4 118.0
7 42.0 23.8 14.8 143.3
8 45.8 25.1 10.2 162.8
9 41.5 25.7 14.4 163.3
10 33.5 27.6 21.4 228.0
114 7 Single Crystals of Superalloys
Fig. 7.2 The crystallographic orientation of the stress
axes and the data of creep tests for ZhS26VI superalloy.
Temperature 1248K, stress 226MPa. The numbers denote
the rupture life in hours.
One may imagine the effect of orientations on properties more obviously
using the standard stereographic triangle. The durabilities of tested speci-
mens are shown in such a way in Fig. 7.2. It is obvious that the properties
are distinguished on account of the high anisotropy of single crystals. The
deformation slip along the system {111} < 110 > is the most probable. The
system of slip {111} < 211 > is also active, though to a lesser degree.
The following empirical equation was proposed on the basis of analysis of
the experimental data.
τ = −0.0261 · T · (lg t
f
+ 20) + 823.7 (7.2)
Fig. 7.3 Comparison of dependence (7.2) (line) with
experimental data of tests (symbols). Rupture life of the
ZhS26VI superalloy is 100h in this temperature range.
7.1 Effect of Orientation on Properties 115
where τ is the shear stress in the active slip system in MPa, t
f
is the rupture
life in hours. The correlation coefficient was found to be 0.88.
The comparison of the linear dependence (7.2) with results of tests shows
that the equation can be used to calculate the long-time strength for durability
of 100h (Fig. 7.3).
The main results of integrated studies of the properties of the ZHS26VI
superalloy specimens are shown in Fig. 7.4. The data are taken from [40]. One
can see that if the orientation is moved from < 001 > and the angle ∆θ
001
ranges from 0 to 25
◦
the properties at first decrease. However, they then
begin to increase (when ∆θ
001
varies from 25 to 54
◦
). Single crystals whose
Fig. 7.4 Effect of orientations of the
ZhS26VI superalloy single crystals on
properties. Isolines of mechanical proper-
ties (MPa) are shown. (a) Yield strength
σ
0.2
at 293K; (b) ultimate stress limit
at 293K; (c) long-time strength τ
1248
100
:
under the indicated stress the rupture
life at 1248K is 100h; (d) fatigue strength
at 293K, number of cycles till fracture is
2 × 10
7
. Data from Ref. [40].
116 7 Single Crystals of Superalloys
axes are close to the < 111 > orientation have the greatest high-temperature
creep strength. In this case very low resolved shear stress operates on all three
principal {111} < 110 > slip systems, so the creep strength is maximal. At
the same time the plasticity decreases.
7.2
Deformation of Single-crystal Superalloys at Lower Temperatures and Higher Stress
Single-crystal superalloys have salient features in response to the applied
stress conditions. The deformation behavior of a single crystal depends on
the superalloy composition, the crystal orientation, the temperature and the
applied stress.
The structure of the cast single-crystal superalloy consists of a high volume
fraction of the coherent γ
phase (up to 75%) separated by thin channels of
γ-matrix. One may conclude that such a crystal is in a sense a composite
material. The directed strengthened γ
areas are alternated with more plas-
tic γ areas. The sizes of the particles and the channel widths are distributed
quantities, even in the initial cast state. The typical size of the γ
precipi-
tates is 300–600 nm, while the γ channels are much narrower, approximately
50–100 nm.
The macroscopic strain rate of single-crystal superalloys is strongly depen-
dent on the temperature and the stress loading conditions.
It is appropriate to distinguish between two temperature areas, where the
superalloys are really used and tested. A difference in the physical processes
proceeding in superalloys is a consequence of their operations within the
different temperature intervals. The first interval is from approximately 1023
to 1123K (750–850
◦
C). We term this area the lower temperature interval.
From the practical standpoint this temperature range is known to be of crucial
importance for cooled gas turbine blades. The roots of blades and the air
cooling channels operate in turbines at relatively low temperatures, such as
1023K.
The turbine entry temperatures continue to rise. “Such developments have,
over the past 20 years or so, contributed significantly to a steady increase
in the turbine entry temperatures of modern aero-engines ; the rate of
approximately 5
◦
C per year average over the past two decades shows no sign
of slowing” [42].
The othertemperaturearea ranges fromabout1223 to 1373K(950–1100
◦
C).
The tests are understood to be conducted under lower stresses at such high
temperatures.
Single-crystal superalloys reveal the usual creep curves within the lower
temperature interval. All four stages of creep are observed. A significant
7.2 Deformation at Lower Temperatures 117
Fig. 7.5 Creep curves for CMSX-4 superalloy. Reprinted from
Ref. [41] with permission from Elsevier Science Ltd.