Volume 08 - Mechanical Testing and Evaluation Part 3 ppt
Bạn đang xem bản rút gọn của tài liệu. Xem và tải ngay bản đầy đủ của tài liệu tại đây (5.36 MB, 150 trang )
• Engineering stress,s: The force at any time during the test divided by the initial area of the test piece; s
= F/A
0
where F is the force, and A
0
is the initial cross section of a test piece.
• True stress, σ: The force at any time divided by the instantaneous area of the test piece; σ = F/A
i
where
F is the force, and A
i
is the instantaneous cross section of a test piece.
Because an increasing force stretches a test piece, thus decreasing its cross-sectional area, the value of true
stress will always be greater than the nominal, or engineering, stress.
These two definitions of stress are further related to one another in terms of the strain that occurs when the
deformation is assumed to occur at a constant volume (as it frequently is). As previously noted, strain can be
expressed as either engineering strain (e) or true strain, where the two expressions of strain are related as ε =
ln(1 + e). When the test-piece volume is constant during deformation (i.e., A
i
L
i
= A
0
L
0
), then the instantaneous
cross section, A
i
, is related to the initial cross section, A
0
, where
A = A
0
exp {-ε}
= A
0
/(1 + e)
If these expressions for instantaneous and initial cross sections are divided into the applied force to obtain
values of true stress (at the instantaneous cross section, A
i
) and engineering stress (at the initial cross section,
A
0
), then:
σ = s exp {ε} = s (1 + e)
Typically, engineering stress is more commonly considered during uniaxial tension tests. All discussions in this
article are based on nominal engineering stress and strain unless otherwise noted. More detailed discussions on
true stress and true strain are in the article “Mechanical Behavior under Tensile and Compressive Loads” in this
Volume.
Uniaxial Tension Testing
John M. (Tim) Holt, Alpha Consultants and Engineering
Stress-Strain Behavior
During a tension test, the force applied to the test piece and the amount of elongation of the test piece are
measured simultaneously. The applied force is measured by the test machine or by accessory force-measuring
devices. The amount of stretching (or extension) can be measured with an extensometer. An extensometer is a
device used to measure the amount of stretch that occurs in a test piece. Because the amount of elastic stretch is
quite small at or around the onset of yielding (in the order of 0.5% or less for steels), some manner of
magnifying the stretch is required. An extensometer may be a mechanical device, in which case the
magnification occurs by mechanical means. An extensometer may also be an electrical device, in which case
the magnification may occur by mechanical means, electrical means, or by a combination of both.
Extensometers generally have fixed gage lengths. If an extensometer is used only to obtain a portion of the
stress-strain curve sufficient to determine the yield properties, the gage length of the extensometer may be
shorter than the gage length required for the elongation-at-fracture measurement. It may also be longer, but in
general, the extensometer gage length should not exceed approximately 85 to 90% of the length of the reduced
section or of the distance between the grips for test pieces without reduced sections. This ratio for some of the
most common test configurations with a 2 in. gage length and 2 in. reduced section is 0.875%.
The applied force, F, and the extension, ΔL, are measured and recorded simultaneously at regular intervals, and
the data pairs can be converted into a stress-strain diagram as shown in Fig. 2. The conversion from force-
extension data to stress-strain properties is shown schematically in Fig. 2(a). Engineering stress, s, is obtained
by dividing the applied force by the original cross-sectional area, A
0
, of the test piece, and strain, e, is obtained
by dividing the amount of extension, ΔL, by the original gage length, L. The basic result is a stress-strain curve
(Fig. 2b) with regions of elastic deformation and permanent (plastic) deformation at stresses greater than those
of the elastic limit (EL in Fig. 2b).
Fig. 2 Stress-strain behavior in the region of the elastic limit. (a) Definition of σ and ε in
terms of initial test piece length, L, and cross-sectional area, A
0
, before application of a
tensile force, F. (b) Stress-strain curve for small strains near the elastic limit (EL)
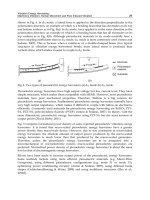
Typical stress-strain curves for three types of steels, aluminum alloys, and plastics are shown in Fig. 3 (Ref 3).
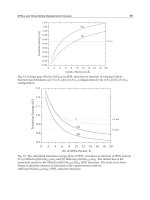
Stress-strain curves for some structural steels are shown in Fig. 4(a) (Ref 4) for elastic conditions and for small
amounts of plastic deformation. The general shape of the stress-strain curves can be described for deformation
in this region. However, as plastic deformation occurs, it is more difficult to generalize about the shape of the
stress-strain curve. Figure 4(b) shows the curves of Fig. 4(a) continued to fracture.
Fig. 3 Typical engineering stress-strain curves from tension tests on (a) three steels, (b)
three aluminum alloys, and (c) three plastics. PTFE, polytetrafluoroethylene. Source: Ref
3
Fig. 4 Typical stress-strain curves for structural steels having specified minimum tensile
properties. (a) Portions of the stress-strain curves in the yield-strength region. (b) Stress-
strain curves extended through failure. Source: Ref 4
Elastic deformation occurs in the initial portion of a stress-strain curve, where the stress-strain relationship is
initially linear. In this region, the stress is proportional to strain. Mechanical behavior in this region of stress-
strain curve is defined by a basic physical property called the modulus of elasticity (often abbreviated as E).
The modulus of elasticity is the slope of the stress-strain line in this linear region, and it is a basic physical
property of all materials. It essentially represents the spring constant of a material.
The modulus of elasticity is also called Hooke's modulus or Young's modulus after the scientists who
discovered and extensively studied the elastic behavior of materials. The behavior was first discovered in the
late 1600s by the English scientist Robert Hooke. He observed that a given force would always cause a
repeatable, elastic deformation in all materials. He further discovered that there was a force above which the
deformation was no longer elastic; that is, the material would not return to its original length after release of the
force. This limiting force is called the elastic limit (EL in Fig. 2b). Later, in the early 1800s, Thomas Young, an
English physicist, further investigated and described this elastic phenomenon, and so his name is associated
with it.
The proportional limit (PL) is a point in the elastic region where the linear relationship between stress and strain
begins to break down. At some point in the stress-strain curve (PL in Fig. 2b), linearity ceases, and small
increase in stress causes a proportionally larger increase in strain. This point is referred to as the proportional
limit (PL) because up to this point, the stress and strain are proportional. If an applied force below the PL point
is removed, the trace of the stress and strain points returns along the original line. If the force is reapplied, the
trace of the stress and strain points increases along the original line. (When an exception to this linearity is
observed, it usually is due to mechanical hysteresis in the extensometer, the force indicating system, the
recording system, or a combination of all three.)
The elastic limit (EL) is a very important property when performing a tension test. If the applied stresses are
below the elastic limit, then the test can be stopped, the test piece unloaded, and the test restarted without
damaging the test piece or adversely affecting the test results. For example, if it is observed that the
extensometer is not recording, the force-elongation curve shows an increasing force, but no elongation. If the
force has not exceeded the elastic limit, the test piece can be unloaded, adjustments made, and the test restarted
without affecting the results of the test. However, if the test piece has been stressed above the EL, plastic
deformation (set) will have occurred (Fig. 2b), and there will be a permanent change in the stress-strain
behavior of the test piece in subsequent tension (or compression) tests.
The PL and the EL are considered identical in most practical instances. In theory, however, the EL is
considered to be slightly higher than the PL, as illustrated in Fig. 2b. The measured values of EL or PL are
highly dependent on the magnification and sensitivity of the extensometer used to measure the extension of the
test piece. In addition, the measurement of PL and EL also highly depends on the care with which a test is
performed.
Plastic Deformation (Set) from Stresses above the Elastic Limit. If a test piece is stressed (or loaded) and then
unloaded, any retest proceeds along the unloading path whether or not the elastic limit was exceeded. For
example, if the initial stress is less than the elastic limit, the load-unload-reload paths are identical. However, if
a test piece is stressed in tension beyond the elastic limit, then the unload path is offset and parallel to the
original loading path (Fig. 2b). Moreover, any subsequent tension measurements will follow the previous
unload path parallel to the original stress-strain line. Thus, the application and removal of stresses above the
elastic limit affect all subsequent stress-strain measurements.
The term set refers to the permanent deformation that occurs when stresses exceed the elastic limit (Fig. 2b).
ASTM E 6 defines set as the strain remaining after the complete release of a load-producing deformation.
Because set is permanent deformation, it affects subsequent stress-strain measurements whether the reloading
occurs in tension or compression. Likewise, permanent set also affects all subsequent tests if the initial loading
exceeds the elastic limit in compression. Discussions of these two situations follow.
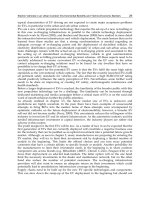
Reloading after Exceeding the Elastic Limit in Tension. If a test piece is initially loaded in tension beyond the
elastic limit and then unloaded, the unload path is parallel to the initial load path but offset by the set; on
reloading in tension, the unloading path will be followed. Figure 5 illustrates a series of stress-strain curves
obtained using a machined round test piece of steel. (The strain axis is not to scale.) In this figure, the test piece
was loaded first to Point A and unloaded. The area of the test piece was again determined (A
2
) and reloaded to
Point B and unloaded. The area of the test piece was determined for a third time (A
3
) and reloaded until fracture
occurred. Because during each loading the stresses at Points A and B were in excess of the elastic limit, plastic
deformation occurred. As the test piece is elongated in this series of tests, the cross-sectional area must decrease
because the volume of the test piece must remain constant. Therefore, A
1
> A
2
> A
3
.
Fig. 5 Effects of prior tensile loading on tensile stress-strain behavior. Solid line, stress-
strain curve based on dimensions of unstrained test piece (unloaded and reloaded twice);
dotted line, stress-strain curve based on dimensions of test piece after first unloading;
dashed line, stress-strain curve based on dimensions of test piece after second unloading.
Note: Graph is not to scale.
The curve with a solid line in Fig. 5 is obtained for engineering stresses calculated using the applied forces
divided by the original cross-sectional area. The curve with a dotted line is obtained from stresses calculated
using the applied forces divided by the cross-sectional area, A
2
, with the origin of this stress-strain curve located
on the abscissa at the end point of the first unloading line. The curve represented by the dashed line is obtained
from the stresses calculated using the applied forces divided by the cross-sectional area, A
3
, with the origin of
this stress-strain curve located on the abscissa at the end point of the second unloading line. This figure
illustrates what happens if a test is stopped, unloaded, and restarted. It also illustrates one of the problems that
can occur when testing pieces from material that has been formed into a part (or otherwise plastically strained
before testing). An example is a test piece that was machined from a failed structure to determine the tensile
properties. If the test piece is from a location that was subjected to tensile deformation during the failure, the
properties obtained are probably not representative of the original properties of the material.
Bauschinger Effect. The other loading condition occurs when the test piece is initially loaded in compression
beyond the elastic limit and then unloaded. The unload path is parallel to the initial load path but offset by the
set; on reloading in tension, the elastic limit is much lower, and the shape of the stress-strain curve is
significantly different. The same phenomenon occurs if the initial loading is in tension and the subsequent
loading is in compression. This condition is called the Bauschinger effect, named for the German scientist who
first described it around 1860. Again, the significance of this phenomenon is that if a test piece is machined
from a location that has been subjected to plastic deformation, the stress-strain properties will be significantly
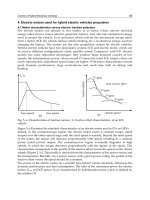
different than if the material had not been so strained. This occurrence is illustrated in Fig. 6, where a machined
round steel test piece was first loaded in tension to about 1% strain, unloaded, loaded in compression to about
1% strain, unloaded, and reloaded in tension. For this steel, the initial portion of tension and compression
stress-strain curves are essentially identical.
Fig. 6 Example of the Bauschinger effect and hysteresis loop in tension-compression-
tension loading. This example shows initial tension loading to 1% strain, followed by
compression loading to 1% strain, and then a second tension loading to 1% strain.
References cited in this section
3. N.E. Dowling, Mechanical Behavior of Materials—Engineering Methods for Deformation, Fracture,
and Fatigue, 2nd ed., Prentice Hall, 1999, p 123
4. R.L. Brockenbough and B.G. Johnson, “Steel Design Manual,” United States Steel Corporation,
ADUSS 27 3400 03, 1974, p 2–3
Uniaxial Tension Testing
John M. (Tim) Holt, Alpha Consultants and Engineering
Properties from Test Results
A number of tensile properties can be determined from the stress-strain diagram. Two of these properties, the
tensile strength and the yield strength, are described in the next section of this article, “Strength Properties.” In
addition, total elongation (ASTM E 6), yield-point elongation (ASTM E 6), Young's modulus (ASTM E 111),
and the strain-hardening exponent (ASTM E 646) are sometimes determined from the stress-strain diagram.
Other tensile properties include the following:
• Poisson's ratio (ASTM E 132)
• Plastic-strain ratio (ASTM E 517)
• Elongation by manual methods (ASTM E 8)
• Reduction of area
These properties require more information than just the data pairs generating a stress-strain curve. None of
these four properties can be determined from a stress-strain diagram.
Strength Properties
Tensile strength and yield strength are the most common strength properties determined in a tension test.
According to ASTM E 6, tensile strength is calculated from the maximum force during a tension test that is
carried to rupture divided by the original cross-sectional area of the test piece. By this definition, it is a stress
value, although some product specifications define the tensile strength as the force (load) sustaining ability of
the product without consideration of the cross-sectional area. Fastener specifications, for example, often refer to
tensile strength as the applied force (load-carrying) capacity of a part with specific dimensions.
The yield strength refers to the stress at which a small, but measurable, amount of inelastic or plastic
deformation occurs. There are three common definitions of yield strength:
• Offset yield strength
• Extension-under-load (EUL) yield strength
• Upper yield strength (or upper yield point)
An upper yield strength (upper yield point) (Fig. 7a) usually occurs with low-carbon steels and some other
metal systems to a limited degree. Often, the pronounced peak of the upper yield is suppressed due to slow
testing speed or nonaxial loading (i.e., bending of the test piece), metallurgical factors, or a combination of
these; in this case, a curve of the type shown in Fig. 7(b) is obtained. The other two definitions of yield
strength, EUL and offset, were developed for materials that do not exhibit the yield-point behavior shown in
Fig. 7. Stress-strain curves without a yield point are illustrated in Fig. 4(a) for USS Con-Pac 80 and USS T-1
steels. To determine either the EUL or the offset yield strength, the stress-strain curve must be determined
during the test. In computer-controlled testing systems, this curve is often stored in memory and may not be
charted or displayed.
Fig. 7 Examples of stress-strain curves exhibiting pronounced yield-point behavior.
Pronounced yielding, of the type shown, is usually called yield-point elongation (YPE). (a)
Classic example of upper-yield-strength (UYS) behavior typically observed in low-carbon
steels with a very pronounced upper yield strength. (b) General example of pronounced
yielding without an upper yield strength. LYS, lower yield strength
Upper yield strength (or upper yield point) can be defined as the stress at which measurable strain occurs
without an increase in the stress; that is, there is a horizontal region of the stress-strain curve (Fig. 7) where
discontinuous yielding occurs. Before the onset of discontinuous yielding, a peak of maximum stress for
yielding is typically observed (Fig. 7a). This pronounced yielding, of the type shown, is usually called yield-
point elongation (YPE). This elongation is a diffusion-related phenomenon, where under certain combinations
of strain rate and temperature as the material deforms, interstitial atoms are dragged along with dislocations, or
dislocations can alternately break away and be repinned, with little or no increase in stress. Either or both of
these actions cause serrations or discontinuous changes in a stress-strain curve, which are usually limited to the
onset of yielding. This type of yield point is sometimes referred to as the upper yield strength or upper yield
point. This type of yield point is usually associated with low-carbon steels, although other metal systems may
exhibit yield points to some degree. For example, the stress-strain curves for A36 and USS Tri-Ten steels
shown in Fig. 4(a) exhibit this behavior.
The yield point is easy to measure because the increase in strain that occurs without an increase in stress is
visually apparent during the conduct of the test by observing the force-indicating system. As shown in Fig. 7,
the yield point is usually quite obvious and thus can easily be determined by observation during a tension test. It
can be determined from a stress-strain curve or by the halt of the dial when the test is performed on machines
that use a dial to indicate the applied force. However, when watching the movement of the dial, sometimes a
minimum value, recorded during discontinuous yielding, is noted. This value is sometimes referred to as the
lower yield point. When the value is ascertained without instrumentation readouts, it is often referred to as the
halt-of-dial or the drop-of-beam yield point (as an average usually results from eye readings). It is almost
always the upper yield point that is determined from instrument readouts.
Extension-under-load (EUL) yield strength is the stress at which a specified amount of stretch has taken place
in the test piece. The EUL is determined by the use of one of the following types of apparatus:
• Autographic devices that secure stress-strain data, followed by an analysis of this data (graphically or
using automated methods) to determine the stress at the specified value of extension
• Devices that indicate when the specified extension occurs so that the stress at that point may be
ascertained
Graphical determination is illustrated in Fig. 8. On the stress-strain curve, the specified amount of extension, 0-
m, is measured along the strain axis from the origin of the curve and a vertical line, m-n, is raised to intersect
the stress-strain curve. The point of intersection, r, is the EUL yield strength, and the value R is read from the
stress axis. Typically, for many materials, the extension specified is 0.5%; however, other values may be
specified. Therefore, when reporting the EUL, the extension also must be reported. For example, yield strength
(EUL = 0.5%) = 52,500 psi is a correct way to report an EUL yield strength. The value determined by the EUL
method may also be termed a yield point.
Fig. 8 Method of determining yield strength by the extension-under-load method (EUL)
(adaptation of Fig. 22 in ASTM E 8)
Offset yield strength is the stress that causes a specified amount of set to occur; that is, at this stress, the test
piece exhibits plastic deformation (set) equal to a specific amount. To determine the offset yield strength, it is
necessary to secure data (autographic or numerical) from which a stress-strain diagram may be constructed
graphically or in computer memory. Figure 9 shows how to use these data; the amount of the specified offset 0-
m is laid out on the strain axis. A line, m-n, parallel to the modulus of elasticity line, 0-A, is drawn to intersect
the stress-strain curve. The point of intersection, r, is the offset yield strength, and the value, R, is read from the
stress axis. Typically, for many materials, the offset specified is 0.2%; however, other values may be specified.
Therefore, when reporting the offset yield strength, the amount of the offset also must be reported; for example,
“0.2 % offset yield strength = 52.8 ksi” or “yield strength (0.2% offset) = 52.8 ksi” are common formats used in
reporting this information.
Fig. 9 Method of determining yield strength by the offset method (adaptation of Fig. 21 in
ASTM E 8)
In Fig. 8 and 9, the initial portion of the stress-strain curve is shown in ideal terms as a straight line.
Unfortunately, the initial portion of the stress-strain curve sometimes does not begin as a straight line but rather
has either a concave or a convex foot (Fig. 10) (Ref 5). The shape of the initial portion of a stress-strain curve
may be influenced by numerous factors such as, but not limited to, the following:
• Seating of the test piece in the grips
• Straightening of a test piece that is initially bent by residual stresses or bent by coil set
• Initial speed of testing
Generally, the aberrations in this portion of the curve should be ignored when fitting a modulus line, such as
that used to determine the origin of the curve. As shown in Fig. 10, a “foot correction” may be determined by
fitting a line, whether by eye or by using a computer program, to the linear portion and then extending this line
back to the abscissa, which becomes point 0 in Fig. 8 and 9. As a rule of thumb, Point D in Fig. 10 should be
less than one-half the specified yield point or yield strength.
Fig. 10 Examples of stress-strain curves requiring foot correction. Point D is the point
where the extension of the straight (elastic) part diverges from the stress-strain curve.
Source: Ref 5
Tangent or Chord Moduli. For materials that do not have a linear relationship between stress and strain, even at
very low stresses, the offset yield is meaningless without defining how to determine the modulus of elasticity.
Often, a chord modulus or a tangent modulus is specified. A chord modulus is the slope of a chord between any
two specified points on the stress-strain curve, usually below the elastic limit. A tangent modulus is the slope of
the stress-strain curve at a specified value of stress or of strain. Chord and tangent moduli are illustrated in Fig.
11. Another technique that has been used is sketched in Fig. 12. The test piece is stressed to approximately the
yield strength, unloaded to about 10% of this value, and reloaded. As previously discussed, the unloading line
will be parallel to what would have been the initial modulus line, and the reloading line will coincide with the
unloading line (assuming no hysteresis in any of the system components). The slope of this line is transferred to
the initial loading line, and the offset is determined as before. The stress or strain at which the test piece is
unloaded usually is not important. This technique is specified in the ISO standard for the tension test of metallic
materials, ISO 6892.
Fig. 11 Stress-strain curves showing straight lines corresponding to (a) Young's modulus
between stress, P, below proportional limit and R, or preload; (b) tangent modulus at any
stress, R; and (c) chord modulus between any two stresses, P and R. Source: Ref 6
Fig. 12 Alternate technique for establishing Young's modulus for a material without an
initial linear portion
Yield-strength-property values generally depend on the definition being used. As shown in Fig. 4(a) for the
USS Con-Pac steel, the EUL yield is greater than the offset yield, but for the USS T-1 steel (Fig. 4a), the
opposite is true. The amount of the difference between the two values is dependent upon the slope of the stress-
strain curve between the two intersections. When the stress-strain data pairs are sampled by a computer, and a
yield spike or peak of the type shown in Fig. 7(a) occurs, the EUL and the offset yield strength will probably be
less than the upper yield point and will probably differ because the m-n lines of Fig. 8 and 9 will intersect at
different points in the region of discontinuous yielding.
Ductility
Ductility is the ability of a material to deform plastically without fracturing. Figure 13 is a sketch of a test piece
with a circular cross section that has been pulled to fracture. As indicated in this sketch, the test piece elongates
during the tension test and correspondingly reduces in cross-sectional area. The two measures of the ductility of
a material are the amount of elongation and reduction in area that occurs during a tension test.
Fig. 13 Sketch of fractured, round tension test piece. Dashed lines show original shape.
Strain = elongation/gage length
Elongation , as previously noted, is defined in ASTM E 6 as the increase in the gage length of a test piece
subjected to a tension force, divided by the original gage length on the test piece. Elongation usually is
expressed as a percentage of the original gage length. ASTM E 6 further indicates the following:
• The increase in gage length may be determined either at or after fracture, as specified for the material
under test.
• The gage length shall be stated when reporting values of elongation.
• Elongation is affected by test-piece geometry (gage length, width, and thickness of the gage section and
of adjacent regions) and test procedure variables, such as alignment and speed of pulling.
The manual measurement of elongation on a tension test piece can be done with the aid of gage marks applied
to the unstrained reduced section. After the test, the amount of stretch between gage marks is measured with an
appropriate device. The use of the term elongation in this instance refers to the total amount of stretch or
extension. Elongation, in the sense of nominal engineering strain, e, is the value of gage extension divided by
the original distance between the gage marks. Strain elongation is usually expressed as a percentage, where the
nominal engineering strain is multiplied by 100 to obtain a percent value; that is:
The final gage length at the completion of the test may be determined in two ways. Historically, it was
determined manually by carefully fitting the two ends of the fractured test piece together (Fig. 13) and
measuring the distance between the gage marks. However, some modern computer-controlled testing systems
obtain data from an extensometer that is left on the test piece through fracture. In this case, the computer may
be programmed to report the elongation as the last strain value obtained prior to some event, perhaps the point
at which the applied force drops to 90% of the maximum value recorded. There has been no general agreement
about what event should be the trigger, and users and machine manufacturers find that different events may be
appropriate for different materials (although some consensus has been reached, see ASTM E 8-99). The
elongation values determined by these two methods are not the same; in general, the result obtained by the
manual method is a couple of percent larger and is more variable because the test-piece ends do not fit together
perfectly. It is strongly recommended that when disagreements arise about elongation results, agreement should
be reached on which method will be used prior to any further testing.
Test methods often specify special conditions that must be followed when a product specification specifies
elongation values that are small, or when the expected elongation values are small. For example, ASTM E 8
defines small as 3% or less.
Effect of Gage Length and Necking. Figure 14 (Ref 7) shows the effect of gage length on elongation values.
Gage length is very important; however, as the gage length becomes quite large, the elongation tends to be
independent of the gage length. The gage length must be specified prior to the test, and it must be shown in the
data record for the test.
Fig. 14 Effect of gage length on the percent elongation. (a) Elongation, %, as a function of
gage length for a fractured tension test piece. (b) Distribution of elongation along a
fractured tension test piece. Original spacing between gage marks, 12.5 mm (0.5 in.).
Source: Ref 7
Figures 13 and 14 also illustrate considerable localized deformation in the vicinity of the fracture. This region
of local deformation is often called a neck, and the occurrence of this deformation is termed necking. Necking
occurs as the force begins to drop after the maximum force has been reached on the stress-strain curve. Up to
the point at which the maximum force occurs, the strain is uniform along the gage length; that is, the strain is
independent of the gage length. However, once necking begins, the gage length becomes very important. When
the gage length is short, this localized deformation becomes the principal portion of measured elongation. For
long gage lengths, the localized deformation is a much smaller portion of the total. For this reason, when
elongation values are reported, the gage length must also be reported, for example, elongation = 25% (50 mm,
or 2.00 in., gage length).
Effect of Test-Piece Dimensions. Test-piece dimensions also have a significant effect on elongation
measurements. Experimental work has verified the general applicability of the following equation:
e = e
0
(L/A
1/2
)
-a
where e
0
is the specific elongation constant; L/A
1/2
the slimness ratio, K, of gage length, L, and cross-sectional
areas, A; and a is another material constant. This equation is known as the Bertella-Oliver equation, and it may
be transformed into logarithmic form and plotted as shown in Fig. 15. In one study, quadruplet sets of machined
circular test pieces (four different diameters ranging from 0.125 to 0.750 in.) and rectangular test pieces ( in.
wide with three thicknesses and 1 in. wide with three thicknesses) were machined from a single plate. Multiple
gage lengths were scribed on each test piece to produce a total of 40 slimness ratios. The results of this study,
for one of the grades of steel tested, are shown in Fig. 16.
Fig. 15 Graphical form of the Bertella-Oliver equation.
Fig. 16 Graphical form of the Bertella-Oliver equation showing actual data
In order to compare elongation values of test pieces with different slimness ratios, it is necessary only to
determine the value of the material constant, a. This calculation can be made by testing the same material with
two different geometries (or the same geometry with different gage lengths) with different slimness ratios, K
1
and K
2
, where
e
0
= e
1
/ = e
2
/
solving for a, then:
(K
2
/K
1
)
-a
= e
2
/e
1
or:
(Eq 1)
(Eq 2)
The values of the e
0
and a parameters depend on the material composition, the strength, and the material
condition and are determined empirically with a best-fit line plot around data points. Reference 8 specifies
“value a = 0.4 for carbon, carbon-manganese, molybdenum, and chromium-molybdenum steels within the
tensile strength range of 275 to 585 MPa (40 to 85 ksi) and in the hot-rolled, in the hot-rolled and normalized,
or in the annealed condition, with or without tempering. Materials that have been cold reduced require the use
of a different value for a, and an appropriate value is not suggested.” Reference 8 uses a value of a = 0.127 for
annealed, austenitic stainless steels. However, Ref 8 states that “these conversions shall not be used where the
width-to-thickness ratio, w/t, of the test piece exceeds 20.” ISO 2566/1 (Ref 9) contains similar statements. In
addition to the limit of (w/t) < 20, Ref 9 also specifies that the slimness ratio shall be less than 25.
Some tension-test specifications do not contain standard test-piece geometries but require that the slimness ratio
be either 5.65 or 11.3. For a round test piece, a slimness ratio of 5.65 produces a 5-to-1 relation between the
diameter and the gage length, and a slimness ratio of 4.51 produces a 4-to-1 relation between the diameter and
gage length (which is that of the test piece in ASTM E 8).
Reduction of area is another measure of the ductility of metal. As a test piece is stretched, the cross-sectional
area decreases, and as long as the stretch is uniform, the reduction of area is proportional to the amount of
stretch or extension. However, once necking begins to occur, proportionality is no longer valid.
According to ASTM E 6, reduction of area is defined as “the difference between the original cross-sectional
area of a tension test piece and the area of its smallest cross section.” Reduction of area is usually expressed as
a percentage of the original cross-sectional area of the test piece. The smallest final cross section may be
measured at or after fracture as specified for the material under test. The reduction of area (RA) is almost
always expressed as a percentage:
Reduction of area is customarily measured only on test pieces with an initial circular cross section because the
shape of the reduced area remains circular or nearly circular throughout the test for such test pieces. With
rectangular test pieces, in contrast, the corners prevent uniform flow from occurring, and consequently, after
fracture, the shape of the reduced area is not rectangular (Fig. 17). Although a number of expressions have been
used in an attempt to describe the way to determine the reduced area, none has received general agreement.
Thus, if a test specification requires the measurement of the reduction of area of a test piece that is not circular,
the method of determining the reduced area should be agreed to prior to performing the test.
Fig. 17 Sketch of end view of rectangular test piece after fracture showing constraint at
corners indicating the difficulty of determining reduced area
References cited in this section
5. P.M. Mumford, Test Methodology and Data Analysis, Tensile Testing, P. Han, Ed., ASM International,
1992, p 55
6. “Standard Test Method for Young's Modulus, Tangent Modulus, and Chord Modulus,” E 111, ASTM
7. Making, Shaping, and Treating of Steel, 10th ed., U.S. Steel, 1985, Fig. 50-12 and 50-13
8. “Standard Test Methods and Definitions for Mechanical Testing of Steel Products,” A 370, Annex 6,
Annual Book of ASTM Standards, ASTM, Vol 1.03
9. “Conversion of Elongation Values, Part 1: Carbon and Low-Alloy Steels,” 2566/1, International
Organization for Standardization, revised 1984
Uniaxial Tension Testing
John M. (Tim) Holt, Alpha Consultants and Engineering
General Procedures
Numerous groups have developed standard methods for conducting the tension test. In the United States,
standards published by ASTM are commonly used to define tension-test procedures and parameters. Of the
various ASTM standards related to tension tests (for example, those listed in “Selected References" at the end
of this article), the most common method for tension testing of metallic materials is ASTM E 8 “Standard Test
Methods for Tension Testing of Metallic Materials” (or the version using metric units, ASTM E 8M). Standard
methods for conducting the tension test are also available from other standards organizations, such as the
Japanese Industrial Standards (JIS), the Deutsche Institut für Normung (DIN), and the International
Organization for Standardization (ISO). Other domestic technical groups in the United States have developed
standards, but in general, these are based on ASTM E 8.
With the increasing internationalization of trade, methods developed by other national standards organizations
(such as JIS, DIN, or ISO standards) are increasingly being used in the United States. Although most tension-
test standards address the same concerns, they differ in the values assigned to variables. Thus, a tension test
performed in accordance with ASTM E 8 will not necessarily have been conducted in accordance with ISO
6892 or JIS Z2241, and so on, and vice versa. Therefore, it is necessary to specify the applicable testing
standard for any test results or mechanical property data.
Unless specifically indicated otherwise, the values of all variables discussed hereafter are those related to
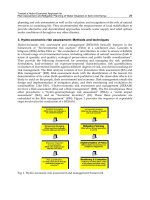
ASTM E 8 “Standard Test Methods for Tension Testing of Metallic Materials.” A flow diagram of the steps
involved when a tension test is conducted in accordance with ASTM E 8 is shown in Fig. 18. The test consists
of three distinct parts:
• Test-piece preparation, geometry, and material condition
• Test setup and equipment
• Test
Fig. 18 General flow chart of the tension test per procedures in ASTM E 8. Relevant
paragraph numbers from ASTM E 8 are shown in parentheses.
Uniaxial Tension Testing
John M. (Tim) Holt, Alpha Consultants and Engineering
The Test Piece
The test piece is one of two basic types. Either it is a full cross section of the product form, or it is a small
portion that has been machined to specific dimensions. Full-section test pieces consist of a part of the test unit
as it is fabricated. Examples of full-section test pieces include bars, wires, and hot-rolled or extruded angles cut
to a suitable length and then gripped at the ends and tested. In contrast, a machined test piece is a representative
sample, such as one of the following:
• Test piece machined from a rough specimen taken from a coil or plate
• Test piece machined from a bar with dimensions that preclude testing a full-section test piece because a
full-section test piece exceeds the capacity of the grips or the force capacity of the available testing
machine or both
• Test piece machined from material of great monetary or technical value
In these cases, representative samples of the material must be obtained for testing. The descriptions of the
tension test in this article proceed from the point that a rough specimen (Fig. 19) has been obtained. That is, the
rough specimen has been selected based on some criteria, usually a material specification or a test order issued
for a specific reason.
Fig. 19 Illustration of ISO terminology used to differentiate between sample, specimen,
and test piece (see text for definitions of test unit, sample product, sample, rough
specimen, and test piece). As an example, a test unit may be a 250-ton heat of steel that
has been rolled into a single thickness of plate. The sample product is thus one plate from
which a single test piece is obtained.
In this article, the term test piece is used for what is often called a specimen. This terminology is based on the
convention established by ISO Technical Committee 17, Steel in ISO 377-1, “Selection and Preparation of
Samples and Test Pieces of Wrought Steel,” where terms for a test unit, a sample product, sample, rough
specimen, and test piece are defined as follows:
• Test unit: The quantity specified in an order that requires testing (for example, 10 tons of in. bars in
random lengths)
• Sample product: Item (in the previous example, a single bar) selected from a test unit for the purpose of
obtaining the test pieces
• Sample: A sufficient quantity of material taken from the sample product for the purpose of producing
one or more test pieces. In some cases, the sample may be the sample product itself (i.e., a 2 ft length of
the sample product.
• Rough specimen: Part of the sample having undergone mechanical treatment, followed by heat treatment
where appropriate, for the purpose of producing test pieces; in the example, the sample is the rough
specimen.
• Test piece: Part of the sample or rough specimen, with specified dimensions, machined or unmachined,
brought to the required condition for submission to a given test. If a testing machine with sufficient
force capacity is available, the test piece may be the rough specimen; if sufficient capacity is not
available, or for another reason, the test piece may be machined from the rough specimen to dimensions
specified by a standard.
These terms are shown graphically in Fig. 19. As can be seen, the test piece, or what is commonly called a
specimen, is a very small part of the entire test unit.
Description of Test Material
Test-Piece Orientation . Orientation and location of a test material from a product can influence measured
tensile properties. Although modern metal-working practices, such as cross rolling, have tended to reduce the
magnitude of the variations in the tensile properties, it must not be neglected when locating the test piece within
the specimen or the sample.
Because most materials are not isotropic, test-piece orientation is defined with respect to a set of axes as shown
in Fig. 20. These terms for the orientation of the test-piece axes in Fig. 20 are based on the convention used by
ASTM E 8 “Fatigue and Fracture.” This scheme is identical to that used by the ISO Technical Committee 164
“Mechanical Testing,” although the L, T, and S axes are referred to as the X, Y, and Z axes, respectively, in the
ISO documents.
Fig. 20 System for identifying the axes of test-piece orientation in various product forms.
(a) Flat-rolled products. (b) Cylindrical sections. (c) Tubular products
When a test is being performed to determine conformance to a product standard, the product standard must state
the proper orientation of the test piece with regard to the axis of prior working, (e.g., the rolling direction of a
flat product). Because alloy systems behave differently, no general rule of thumb can be stated on how prior
working may affect the directionality of properties. As can be seen in Table 1, the longitudinal strengths of steel
are generally somewhat less than the transverse strength. However, for aluminum alloys, the opposite is
generally true.
Table 1 Effect of test-piece orientation on tensile properties
Orientation Yield strength, ksi Tensile strength, ksi Elongation in
50 mm (2 in.), %
Reduction of area, %
ASTM A 572, Grade 50 (¾in. thick plate, low sulfur level)
Longitudinal
58.8 84.0 27.0 70.2
Transverse
59.8 85.2 28.0 69.0
ASTM A 656, Grade 80 (¾in. thick plate, low sulfur level + controlled rolled)
Longitudinal
81.0 102.3 25.8 71.2
Transverse
86.9 107.9 24.5 67.1
ASTM A 5414 (¾in. thick plate, low sulfur level)
Longitudinal
114.6 121.1 19.8 70.6
Transverse
116.3 122.2 19.5 69.9
Source: Courtesy of Francis J. Marsh
Many standards, such as ASTM A 370, E 8, and B 557, provide guidance in the selection of test-piece
orientation relative to the rolling direction of the plate or the major forming axes of other types of products and
in the selection of specimen and test-piece location relative to the surface of the product. Orientation is also
important when characterizing the directionality of properties that often develops in the microstructure of
materials during processing. For example, some causes of directionality include the fibering of inclusions in
steels, the formation of crystallographic textures in most metals and alloys, and the alignment of molecular
chains in polymers.
The location from which a test material is taken from the initial product form is important because the manner
in which a material is processed influences the uniformity of microstructure along the length of the product as
well as through its thickness properties. For example, the properties of metal cut from castings are influenced
by the rate of cooling and by shrinkage stresses at changes in section. Generally, test pieces taken from near the
surface of iron castings are stronger. To standardize test results relative to location, ASTM A 370 recommends
that tension test pieces be taken from midway between the surface and the center of round, square, hexagon, or
octagonal bars. ASTM E 8 recommends that test pieces be taken from the thickest part of a forging from which
a test coupon can be obtained, from a prolongation of the forging, or in some cases, from separately forged
coupons representative of the forging.
Test-Piece Geometry
As previously noted, the item being tested may be either the full cross section of the item or a portion of the
item that has been machined to specific dimensions. This article focuses on tension testing with test pieces that
are machined from rough samples. Component testing is discussed in more detail in the article “Mechanical
Testing of Fiber Reinforced Composites” in this Volume.
Test-piece geometry is often influenced by product form. For example, only test pieces with rectangular cross
sections can be obtained from sheet products. Test pieces taken from thick plate may have either flat (plate-
type) or round cross sections. Most tension-test specifications show machined test pieces with either circular
cross sections or rectangular cross sections. Nomenclature for the various sections of a machined test piece are
shown in Fig. 21. Most tension-test specifications present a set of dimensions, for each cross-section type, that
are standard, as well as additional sets of dimensions for alternative test pieces. In general, the standard
dimensions published by ASTM, ISO, JIS, and DIN are similar, but they are not identical.
Fig. 21 Nomenclature for a typical tension test piece
Gage lengths and standard dimensions for machined test pieces specified in ASTM E 8 are shown in Fig. 22 for
rectangular and round test pieces. From this figure, it can be seen that the gage length is proportionally four
times (4 to 1) the diameter (or width) of the test piece for the standard machined round test pieces and the sheet-
type, rectangular test pieces. The length of the reduced section is also a minimum of 4 times the diameter (or
width) of these test-piece types. These relationships do not apply to plate-type rectangular test pieces.
Standard specimens, in.
Plate type, 1½ in.
wide
Sheet type, ½in.
wide
Subsize
specimen,
¼in. wide, in.
G, gage length
(a)(b)
8.00 ± 0.01 2.00 ± 0.005 1.000 ± 0.003
W, width
(c)(d)
1½ + ⅛–¼
0.500 ± 0.010 0.250 ± 0.005
T, thickness
(e)
<
0.005 ≤ T ≤ ¾ 0.005 ≤ T ≤ ¼
R, radius of fillet, min
(f)
1 ½ ¼
L, overall length, min
(b)(g)
18 8 4
A, length of reduced section, min
9 2¼ 1¼
B, length of grip section, min
(h)
3 2 1¼
C, width of grip section,
approximate
(d)(i)
2 ¾
⅜
Note:
(a) For the 1½ in. wide specimen, punch marks for measuring elongation after fracture shall be made on the flat
or on the edge of the specimen and within the reduced section. Either a set of nine or more punch marks 1 in.
apart or one or more pairs of punch marks 8 in. apart may be used.
(b) When elongation measurements of 1½ in. wide specimens are not required, a minimum length of reduced
section (A) of 2¼ in. may be used with all other dimensions similar to those of the plate-type specimen.
(c) For the three sizes of specimens, the ends of the reduced section shall not differ in width by more than
0.004, 0.002, or 0.001 in., respectively. Also, there may be a gradual decrease in width from the ends to the
center, but the width at each end shall not be more than 0.015, 0.005, or 0.003 in., respectively, larger than the
width at the center.
(d) For each of the three sizes of specimens, narrower widths (W and C) may be used when necessary. In such
cases the width of the reduced section should be as large as the width of the material being tested permits;
however, unless stated specifically, the requirements for elongation in a product specification shall not apply
when these narrower specimens are used.
(e) The dimension T is the thickness of the test specimen as provided for in the applicable material
specifications. Minimum thickness of 1½ in. wide specimens shall be in. Maximum thickness of ½in. and
¼in. wide specimens shall be ¾in. and ¼in., respectively.
(f) For the 1½ in. wide specimen, a ½in. minimum radius at the ends of the reduced section is permitted for
steel specimens under 100,000 psi in tensile strength when a profile cutter is used to machine the reduced
section.
(g) To aid in obtaining axial force application during testing of ¼in. wide specimens, the overall length should
be as large as the material will permit, up to 8.00 in.
(h) It is desirable, if possible, to make the length of the grip section large enough to allow the specimen to
extend into the grips a distance equal to two-thirds or more of the length of the grips. If the thickness of ½in.
wide specimens is over ⅜in., longer grips and correspondingly longer grip sections of the specimen may be
necessary to prevent failure in the grip section.
(i) For the three sizes of specimens, the ends of the specimen shall be symmetrical in width with the enter line
of the reduced section within 0.10, 0.05, and 0.005 in., respectively. However, for referee testing and when
required by product specifications, the ends of the ½in. wide specimen shall be symmetrical within 0.01 in.
Fig. 22 Examples of tension test pieces per ASTM E 8. (a) Rectangular (flat) test pieces.
(b) Round test-piece
Standard specimen, in.,
at nominal diameter:
Small-size specimens proportional to
standard, in., at nominal diameter:
0.500 0.350 0.250 0.160 0.113
G, gage length
2.000 ±
0.005
1.400 ±
0.005
1.000 ±
0.005
0.640 ±
0.005
0.450 ±
0.005
D, diameter
(a)
0.500 ±
0.010
0.350 ±
0.007
0.250 ±
0.005
0.160 ±
0.003
0.113 ±
0.002
R, radius of fillet, min
⅜
¼
A, length of reduced section,
min
(b)
2¼ 1¾ 1¼ ¾
Note:
(a) The reduced section may have a gradual taper from the ends toward the center, with the ends not more than
1% larger in diameter than the center (controlling dimension).
(b) If desired, the length of the reduced section may be increased to accommodate an extensometer of any
convenient gage length. Reference marks for the measurement of elongation should, nevertheless, be spaced at
the indicated gage length.
Fig. 22
Many specifications outside the United States require that the gage length of a test piece be a fixed ratio of the
square root of the cross-sectional area, that is:
Gage length = constant x (cross-sectional area)
1/2
The value of this constant is often specified as 5.65 or 11.3 and applies to both round and rectangular test
pieces. For machined round test pieces, a value of 5.65 results in a 5-to-1 relationship between the gage length
and the diameter.
Many tension-test specifications permit a slight taper toward the center of the reduced section of machined test
pieces so that the minimum cross section occurs at the center of the gage length and thereby tends to cause
fracture to occur at the middle of the gage length. ASTM E 8-99 specifies that this taper cannot exceed 1% and
requires that the taper is the same on both sides of the midlength.
When test pieces are machined, it is important that the longitudinal centerline of the reduced section be
coincident with the longitudinal centerlines of the grip ends. In addition, for the rectangular test pieces, it is
essential that the centers of the transition radii at each end of the reduced section are on common lines that are
perpendicular to the longitudinal centerline. If any of these requirements is violated, bending will occur, which
may affect test results.
The transition radii between the reduced section and the grip ends can be critical for test pieces from materials
with very high strength or with very little ductility or both. This is discussed more fully in the section “Effect of
Strain Concentrations” in this article.
Measurement of Initial Test-Piece Dimensions. Machined test pieces are expected to meet size specifications,
but to ensure dimensional accuracy, each test piece should be measured prior to testing. Gage length, fillet
radius, and cross-sectional dimensions are measured easily. Cylindrical test pieces should be measured for
concentricity. Maintaining acceptable concentricity is extremely important in minimizing unintended bending
stresses on materials in a brittle state.
Measurement of Cross-Sectional Dimensions. The test pieces must be measured to determine whether they
meet the requirements of the test method. Test-piece measurements must also determine the initial cross-
sectional area when it is compared against the final cross section after testing as a measure of ductility.
The precision with which these measurements are made is based on the requirements of the test method, or if
none are given, on good engineering judgment. Specified requirements of ASTM E 8 are summarized as
follows:
• For referee testing of test pieces under in. in their least dimension, the dimensions should be
measured where the least cross-sectional area is found.
• For cross sectional dimensions of 0.200 in. or more, cross-sectional dimensions should be measured and
recorded to the nearest 0.001 in.
• For cross sectional dimensions from 0.100 in. but less than 0.200 in., cross-sectional dimensions should
be measured and recorded to the nearest 0.0005 in.
• For cross sectional dimensions from 0.020 in. but less than 0.100 in., cross-sectional dimensions should
be measured and recorded to the nearest 0.0001 in.
• When practical, for cross-sectional dimensions less than 0.020 in., cross-sectional dimensions should be
measured to the nearest 1%, but in all cases, to at least the nearest 0.0001 in.
ASTM E 8 goes on to state how to determine the cross-sectional area of a test piece that has a nonsymmetrical
cross section using the weight and density. When measuring dimensions of the test piece, ASTM E 8 makes no
distinction between the shape of the cross section for standard test pieces.
Measurement of the Initial Gage Length. ASTM E 8 assumes that the initial gage length is within specified
tolerance; therefore, it is necessary only to verify that the gage length of the test piece is within the tolerance.
Marking Gage Length. As shown in the flow diagram in Fig. 18, measurement of elongation requires marking
the gage length of the test piece. The gage marks should be placed on the test piece in a manner so that when
fracture occurs, the fracture will be located within the center one-third of the gage length (or within the center
one-third of one of several sets of gage-length marks). For a test piece machined with a reduced-section length
that is the minimum specified by ASTM E 8 and with a gage length equal to the maximum allowed for that
geometry, a single set of marks is usually sufficient. However, multiple sets of gage lengths must be applied to
the test piece to ensure that one set spans the fracture under any of the following conditions:
• Testing full-section test pieces
• Testing pieces with reduced sections significantly longer than the minimum
• Test requirements specify a gage length that is significantly shorter than the reduced section
For example, some product specifications require that the elongation be measured over a 2 in. gage length using
the machined plate-type test piece with a 9 in. reduced section (Fig. 22a). In this case, it is recommended that a
staggered series of marks (either in increments of 1 in. when testing to ASTM E 8 or in increments of 25.0 mm
when testing to ASTM E 8M) be placed on the test piece such that, after fracture, the elongation can be
measured using the set that best meets the center-third criteria. Many tension-test methods permit a retest when
the elongation is less than the minimum specified by a product specification if the fracture occurred outside the
center third of the gage length. When testing full-section test pieces and determining elongation, it is important
that the distance between the grips be greater than the specified gage length unless otherwise specified. As a
rule of thumb, the distance between grips should be equal to at least the gage length plus twice the minimum
dimension of the cross section.
The gage marks may be marks made with a center punch, or may be lines scribed using a sharp, pointed tool,
such as a machinist's scribe (or any other means that will establish the gage length within the tolerance
permitted by the test method). If scribed lines are used, a broad line or band may first be drawn along the length
of the test piece using machinist's layout ink (or a similar substance), and the gage marks are made on this line.
This practice is especially helpful to improve visibility of scribed gage marks after fracture. If punched marks
are used, a circle around each mark or other indication made by ink may help improve visibility after fracture.
Care must be taken to ensure that the gage marks, especially those made using a punch, are not deep enough to
become stress raisers, which could cause the fracture to occur through them. This precaution is especially
important when testing materials with high strength and low ductility.
Notched Test Pieces. Tension test pieces are sometimes intentionally notched in the center of the gage length
(Fig. 23). ASTM E 338 and E 602 describe procedures for testing notched test pieces. Results obtained using
notched test pieces are useful for evaluating the response of a material to a localized stress concentration.
Detailed information on the notch tensile test and a discussion of the related material characteristics (notch
sensitivity and notch strength) can be found in the article “Mechanical Behavior Under Tensile and
Compressive Loads” in this Volume. The effect of stress (or strain) concentrations is also discussed in the
section “Effect of Strain Concentrations” in this article.
Fig. 23 Example of notched tension-test test piece per ASTM E 338 “Standard Test
Method of Sharp-Notch Tension Testing of High-Strength Sheet Materials”
Surface Finish and Condition. The finish of machined surfaces usually is not specified in generic test methods
(that is, a method that is not written for a specific item or material) because the effect of finish differs for
different materials. For example, test pieces from materials that are not high strength or that are ductile are
usually insensitive to surface finish effects. However, if surface finish in the gage length of a tensile test piece
is extremely poor (with machine tool marks deep enough to act as stress-concentrating notches, for example),
test results may exhibit a tendency toward decreased and variable strength and ductility.
It is good practice to examine the test piece surface for deep scratches, gouges, edge tears, or shear burrs. These
discontinuities may sometimes be minimized or removed by polishing or, if necessary, by further machining;
however, dimensional requirements often may no longer be met after additional machining or polishing. In all
cases, the reduced sections of machined test pieces must be free of detrimental characteristics, such as cold
work, chatter marks, grooves, gouges, burrs, and so on. Unless one or more of these characteristics is typical of
the product being tested, an unmachined test piece must also be free of these characteristics in the portion of the
test piece that is between the gripping devices. When rectangular test pieces are prepared from thin-gage sheet
material by shearing (punching) using a die the shape of the test piece, ASTM E 8 states that the sides of the
reduced section may need to be further machined to remove the cold work and shear burrs that occur when the
test piece is sheared from the rough specimen. This method is impractical for material less than 0.38 mm (0.015
in.) thick. Burrs on test pieces can be virtually eliminated if punch-to-die clearances are minimized.
Uniaxial Tension Testing
John M. (Tim) Holt, Alpha Consultants and Engineering
Test Setup
The setup of a tensile test involves the installation of a test piece in the load frame of a suitable test machine.
Force capacity is the most important factor of a test machine. Other test machine factors, such as calibration and
load-frame rigidity, are discussed in more detail in the article “Testing Machines and Strain Sensors” in this
Volume. The other aspects of the test setup include proper gripping and alignment of the test piece, and the