Báo cáo y học: " There has been a lack of investigation into the spatial distribution and clustering of suicide in Australia, where the population density is lower than " pot
Bạn đang xem bản rút gọn của tài liệu. Xem và tải ngay bản đầy đủ của tài liệu tại đây (1.47 MB, 10 trang )
RESEARC H ARTIC LE Open Access
Spatial distribution of suicide in Queensland,
Australia
Xin Qi
1
, Shilu Tong
1*
, Wenbiao Hu
2
Abstract
Background: There has been a lack of investigation into the spatial distribution and clustering of suicide in
Australia, where the population density is lower than many countries and varies dramatically among urban, rural
and remote areas. This study aims to examine the spatial distribution of suicide at a Local Governmental Area
(LGA) level and identify the LGAs with a high relative risk of suicide in Queensland, Australia, using geographical
information system (GIS) techniques.
Methods: Data on suicide and demographic variables in each LGA between 1999 and 2003 were acquired from
the Australian Bureau of Statistics. An age standardised mortality (ASM) rate for suicide was calculated at the LGA
level. GIS techniques were used to exa mine the geographical difference of suicide across different areas.
Results: Far north and north-eastern Queensland (i.e., Cook and Mornington Shires) had the highest suicide
incidence in both genders, while the south-western areas (i.e., Barcoo and Bauhinia Shires) had the lowest
incidence in both genders. In different age groups (≤24 years, 25 to 44 years, 45 to 64 years, and ≥65 years), ASM
rates of suicide varied with gender at the LGA level. Mornington and six other LGAs with low socioeconomic
status in the upper Southeast had significant spatial clusters of high suicide risk.
Conclusions: There was a notable difference in ASM rates of suicide at the LGA level in Queensland. Some LGAs
had significant spatial clusters of high suicide risk. The determinants of the geographical differe nce of suicide
should be addressed in future research.
Background
Suicide is a major cause of death around the world with
about 877,000 suicide deaths each year globally [1]. The
World Health Organization has predicted that the suicide
rate will steadily increase into the future [2].
In Australia, the trend of suicide has fluctuated over
the 20th Century and early 21
st
Century [ 3,4]. In recent
years, there have been over 2000 suicide cases recorded
annually in Australia (ABS 2003, 2004) [4], with males
accounting for the majority of these suicides. A number
of studies have explored the distribution of suicide in dif-
ferent states in Australia [5-9].
Some Australian and international studies have
applied spatial analysis to assess the geographical differ-
ence in suicide incidence [10-15]. Our previous study
analysed the spatiotemporal association between socio-
environmental factors (climate, socioeconomic and
demographic factors) and suicide in Queensland,
Australia [13]. Some other studies also explored the spa-
tial variation of suicide in Queensland (14-15). At an
international level, several studies have explored the
geographic distribution of di seases using spatial cluster
analysis [12,16-18], identifying clustering in several dis-
eases, including suicide [12]. Spatial cluster analysis is a
vital tool because it helps to find the clusters of any dis-
ease with high or low r elative risk. Each cluster consists
of several geographic units linked together, and has a
small proportion of the p opula tion (e.g., less than 25%)
of that in the whole study area. All these studies on spa-
tial cluster analysis were implemented in countries
(regions) with much higher population density than th at
of Australia, which varied among urban, rural and
remote areas. The patterns of suicide may differ between
Australia and other countries. Thus it is important to
examine the spatial clusters of suicide in Australia, to
* Correspondence:
1
School of Public Health, and Institute of Health and Biomedical Innovation,
Queensland University of Technology, Kelvin Grove, Queensland 4059,
Australia
Full list of author information is available at the end of the article
Qi et al. BMC Psychiatry 2010, 10:106
/>© 2010 Qi et al; licensee BioMed Central Ltd. This is an Open Acces s article distributed under the terms of the Creative Commons
Attribution License ( which permits unrestricted use, distributio n, and reproduction in
any medium, provided the original work is properly cited.
improve current suicide control and prevention
strategies.
This study aimed to examine the spatial distribution
of suicide at a LGA level and identify t he LGAs with a
high relative risk of suicide in Queensland, Australia,
using geographical information system (GIS) techniques.
Queensland is the second largest state in Australia, in
termsofareasandliesinthenortheastofthecountry
with an area about 1.73 million km
2
and a total popula-
tion of 4.41 million in June 2009. Southeast Queensland
(SEQ) covers less than 1.3% of the total a rea, but had
65.4% of total population while other places have much
lower levels of popul ation density than that of the SEQ.
The economy in Queensland has increased more rapidly
than that of other areas in Australia since 1992, except
for the financial year 1995-1996 [19]. Mining, financial
services and tourism are the major industries in
Queensland.
Methods
Data sources
Suicidedatawereobtainedfrom Australian Bureau of
Statistics (ABS), including gender, age, year a nd month
of suicide (January 1999 to December 2003), country of
birth and code of Statistical Local Area. The year 2003
is the cut-off in this study because this dataset was
obtained a few years ago. Currently ABS does not accept
any application for accessing the detailed mortality data
as it is reviewing its services process. This study
involved 2,445 suicide deaths from 1999 to 2003, with
1957 males a nd 488 females (male/female ratio: 4.01).
As it is time-consuming and computation intensive to
calculate the age-standardised mortality (ASM) rates at
a Statistical Local Area (SLA) level, we used the aggre-
gated data to examine the feasibility of linking different
sources of data in this study. The ethical application for
this study was approved by University Human Research
Ethics Committee, Queensland University of Technology
(Approval Number: 1000000220).
According to ABS, there were 452 SLAs in Queens-
land in 2001. In Queensland, there were 489 suicides on
average each year from 1999 to 2003 and each SLA had
only about 1 suicide every year on average (range: 0
to14) so it is difficult to detect the spatial pattern of sui-
cide at a SLA level . Previous research on suicide in Eng-
land and Wales discussed a similar problem [10]. Due
to the low total suicide rates within each SLA, the larger
geographic boundary area, Local Governmental Area
(LGA), was used to detect areas of suicide relative risk
or clustering. Urban LGAs contain two or more SLAs
(e.g., Brisbane City had 163 SLAs in 2001), and in rural
and remote areas that make up the majority of Queens-
land territory, each LGA is also an SLA. The LGA infor-
mation, including name, code and area (km
2
), was
collected from Census Data (CDATA) 2001, a database
developed by ABS which provides information of 2001
Australian Census of Population and Housing, digital
statistical boundaries and base maps. There were 125
LGAs in Queensland in 2001. All suicide data were then
compiled and linked at the LGA level. The Australian
Standard Geograph ical Classification ASGC (1999-2003)
was applied as a reference to combine the SLAs into
LGAs. MapInfo 9.0 was used as a platform to perform
the data linkage, transfer and spatial display.
Population data in total, by gender and age groups
(i.e., ≤24-years for youth and adolescents, 25 to 44-years
for young adults, 45 to 64-years for middle-aged adults,
and ≥65-years for elderly) at a LGA level, were also col-
lected from CDATA.
Data analysis
A series of GIS and s tatistical methods were used to
analyse these data. MapInfo (including Vertical Mapper)
was used to explore spatial patterns of suicide by gen-
der, age and LGA. SaTSCAN was applied to analyse the
spatial clusters of suicide across LGAs.
In order to examine t he spatial patterns of suicide,
ASM rates by gender for each LGA were calculated by a
direct method. The data on the population structure by
age and gender at a LGA level in Queensland were
obtained from ABS. The equation for calculating ASM
is as follows:
ASM
Np
N
ii
=
∑
,
where N
i
is the standard population size in each LGA
by age and gender, p
i
represents the death rate of each
LGA by age and gender, and N is the total population
of Queensland. Four steps we re used to calcul ate the
ASM for each LGA in this study:
1. Obtain the total number of suicides in the LGA by
age and gender.
2. Calculate the gen der age-specific ra tes of suicide
deaths per 100,000 for each LGA.
3. Calculate the expected number of deaths (N
i
p
i
)by
age and gender for each LGA.
4. Sum the expected number of deaths and divide by
the total population of Queensland to get ASM per
100,000 for each LGA.
Statistical analyses, including both descriptive and spa-
tial analysis approaches, were performed to examine the
spatial distribution of suicide by LGA and gender.
Descriptive analysis was used to explore the characteris-
tics of each variable. Spatial analysis was performed to
view the spatial distribution of suicide ASM rates by
gender and age, using GIS and mapping approaches.
Qi et al. BMC Psychiatry 2010, 10:106
/>Page 2 of 10
The MapInfo Professional (version 8.5) and Statistical
Package for the Social Sciences (SPSS, version 16.0)
were used for data management and analysis [20,21].
Spatial cluster analysis was implemented to detect
whether the suicide cases were randomly distributed
and to explore the spatial clusters of suicide. In the spa-
tial cluster analysis, the suicide re lative risk (RR ) of each
LGA was calculated using a Poisson model, and the
mean RR of each cluster (including one or more LGAs )
was also computed with the SaTSCAN (version 8.0)
[22]. The annua l average mortality (total and by gender)
of the whole state (1999-2003) was defined as the refer-
ence for the RR in each LGA. To identify whether selec-
tion of population size influences the size of clusters,
the spatial clusters were defined to cover less than 50%,
25% and 10% of total population respectively, including
both most likely cluster(s) and secondary likely cluster
(s). The longitude and latitude of the centroids in each
LGA wer e used in the analysis. The most likely and sec-
ondary likely clusters were indicated through the likeli-
hood ratio test and indicated as circular windows, to
test the hypothesis that these areas had an elevated risk
compared to other areas.
Results
Table 1 indicates the distribution of suicides by age and
gender. Most of the suicide cases were aged b etween 25
and 64 years, with male suicides accounting for approxi-
mately 80% of all deaths.
Table 2 re veals that suicide morta lity rates, particu-
larlymaleASM,variedsubstantially across LGAs. For
example, Brisbane City had an area of 1,327 km
2
with a
population of 888,499 (2001 census data) and 565 sui-
cide cases recorded. The Diamantina Shire covers
94,832 km
2
; it had a population of only 448 persons
(2001 census data) and no suicides were recorded
between 1999 an d 2003. Therefore, population density
was not regarded as an indicator of suicide rates.
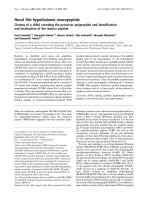
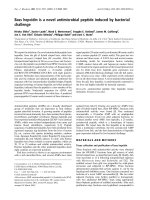
Figure 1A sh ows the map o faveragemale suicide
ASM rates at the LGA level in Queensland. It indicates
that central Queensland, far north (part of Peninsula of
Cape York), north-western areas (coastal areas of Gulf
of Carpentaria), part of western, part of southern, south-
eastern coastal and eastern areas had higher suicide
ASM rates, while northern-central, south-western,
southern and south-eastern inland areas had lower rates.
Figure 1B shows female suicide ASM rates at the LGA
level. Part of central, eastern a nd southern coastal areas
had higher female suicide ASM rates compared with other
areas. However, almost half of 125 LGAs in Queensland
had no suicides recorded during 1999 and 2003.
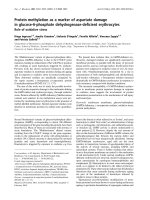
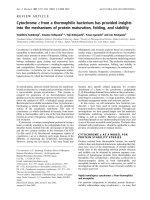
Figure 2A show the spatial distribution of male suicide
ASM rates in different age groups. Figure 2A indicates
that among youths and adolescents, the far north, north-
western, part of central and north, central coast and
southeastern areas had higher suicide ASM rates, while
central inland, northern coast, south and southwest
areas had lower rates during the study period. Among
young adults, part of far north, northwestern, part of
central and southern areas had higher suicide ASM
rates, while part of north, southwestern and central
south areas had low suicide rates (Figure 2B). Figure 2C
shows that among middle-aged adults, part of the far
north, west, central south and southeast areas had
higher suicide ASM rates, while north, northwest, cen-
tral inland and southwestern areas had l ower rates.
Among the elde rly, the part of northwest, west, north,
part of the south, central and part of the southeastern
areas had higher suicide ASM rates, while the far north,
central inland, southwest, and part of the south areas
had lower rates during the study period (Figure 2D).
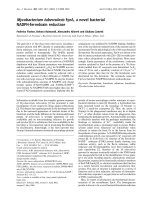
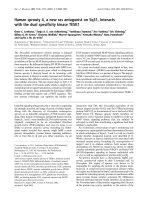
Figure 3A - D revealed the spatial distribution of female
suicide ASM rates in different age groups. Among youths
and adolescents, the far north, part of the north coast
and northwest, part of the central inland and southeast
areas had higher suicide ASM rates, while over 76% of
all LGAs had no suicides recorded during 1999 to 2003
(Figure 3A). Figure 3B shows that among young adults,
there were higher suicide ASM rates in the far north,
part of the northwest, north coast, part of inland and
southeast areas, while lower suicide rates (or no suicides
rec orded) were observed in most of north, central, south
and southwest areas. For middle aged adults, the far
north and part of the south east areas had higher suicide
ASM rates, while 75% of all t he LGAs had no suicides
recorded (Figure 3C). Among the elderly, far north, part of
north and central coast, part of central south inland and
southeast areas had higher suicide ASM rates, while over
82% of all LGAs had no suicides recorded (Figure 3D).
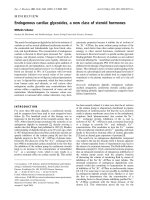
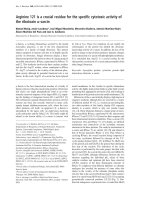
In the spatial cluster analysis, suicide was not ran-
domly distributed. Figure 4 indicates the cluster areas of
high suicide risk (both total and male) in the whole
state. Mornington Shine in the northwest was the
mostly likely cluster, but the neighbouring LGAs (e.g.,
Burke and Carpentaria Shires) did not demonstrate clus-
tering, although these areas had high suicide ASM. The
secondary likely cluster contains six LGAs in upper
Southeast Queensland (SEQ).
Table 1 Suicide by gender and age in Queensland
(1999-2003)
Age Males Females Total
24 & below 321 74 395
25-44 917 237 1154
45-64 482 126 608
65 & over 237 51 288
Total 1957 488 2445
Qi et al. BMC Psychiatry 2010, 10:106
/>Page 3 of 10
These clusters contained 1.77 per cent of the total
population in the who le study area with 3.8 per cent of
total suicides. Table 3 shows the details of clusters for
total and male suicides. Different cluster sizes (e.g.,
radius of 200 km and 400 km) and population (less than
10%, 25% and 50% of total) were tested and no apparent
difference in the results wa s foundfromvariousselec-
tions. The clusters of low risk areas for male suicide
were also tested but no cluster was discovered. For
female suicide, no cluster area of h igh and low suicide
risk was identified during the study period.
Discussion
This study examined the spatial distribution of suicide
in Queensland by gender and age. Male suicides
accounted for 80% of total suicide cases and 47% of
total suicides were young adults. In general, the maps of
this study show that part of far north and north, north-
west, some of west, central and east areas had higher
male suicide ASM rates, while southwest and some of
central areas had no male suicides recorded. Far north
Queensland, part of the northwest, coastal a nd central
areas had higher female suicide ASM rates, but almost
half of the LGAs had no female suicide cases recorded.
Suicide mortality also varied betwe en LGAs among both
genders in different age groups.
SEQ covers less tha n 1.3% of total area of the stat e,
but accounts for 65.4% of the total population and
62.4% of total suicides in Queensla nd [23]. I n SEQ, the
suicide ASM rates were relatively similar across LGAs,
except for female yo uths and adolescents. Thus it is dif-
ficult to find the cluster of high risk suicides in SEQ.
Table 2 Suicide mortality rates by gender (N = 125)
Percentiles
Mean Std. Deviation Minimum 25
th
50
th
75
th
Maximum
Mortality (per 100,000) 17.12 27.876 0.00 8.40 13.03 19.08 296.30
Male ASM (per 100,000)* 28.11 46.873 0.00 14.11 20.72 30.65 492.81
Female ASM (per 100,000)* 5.50 11.023 0.00 0.00 1.75 6.70 87.34
*ASM: age standardised mortality rate
Figure 1 Suicide age standardised mortality rates (A: male; B: female) in Queensland (1999-2003).
Qi et al. BMC Psychiatry 2010, 10:106
/>Page 4 of 10
The number of LGAs w ith female elderly suicides was
the least compared for numbers of LGAs with suicides
inotherageandgendergroups.InLGAswithalow
population (i.e , less th an 2000), the ASM rates were
often higher than other LGAs if suicides occurred. For
example, Mornington Shire in north west Queensland
had a population of 945 in 2001, but it had 14 suicide
cases in the 5-year study period.
The spatial cluster analysis discovered significant clus-
ters of Mornington Shire in the northwest and six other
Figure 2 Male suicide age standardised mortality rates in Queensland (A: 24 years and younger; B: 25-44 years age; C: 45-64 years
age; D: 65 years age and above).
Qi et al. BMC Psychiatry 2010, 10:106
/>Page 5 of 10
LGAs in upper SEQ. S even LGAs in the far north (Aur-
ukun, Burke, Carpentaria, Cook, Herberton, Mareeba
and McKinlay Shires) are linked together with RRs,
between 1.5 and 5.8 (to tal and male) in each but not in
anycluster(Figure5).TheseLGAscover19.6percent
of the whole study area but had only 1.15 per cent of
the total pop ulation and 2.45 per cent of total suicides,
which means a very low population density but higher
suicide rates compared with the average suicide rate in
the whole state. This may be due to social isolation and
Figure 3 Female suicide age standardised mortality rates in Queensland (A: 24 years and younger; B: 25-44 years age; C: 45-64 years
age; D: 65 years age and above).
Qi et al. BMC Psychiatry 2010, 10:106
/>Page 6 of 10
the lack of mental health services available in these areas
[17,24]. The SaTScan has the maximum limit in control-
ling the radius and population of clusters; therefore
LGAs in the far north m entioned above, covering a
large proportion of the whole study area, could not be
selected as clusters by SaTScan. This may explain the
discrepancy between LGAs with a high relative risk of
suicide and LGAs with clustering.
Most of the LGAs with higher suicide ASM rates were
shires whose populations were predominately composed
of Aboriginal and Torres Strait Islander. Some studies
in Queensland have indicated that Indigenous areas
have higher suicide mortality than other area s [13,25].
Most of the Indigenous areas have low socioeconomic
status as well as fewer opportunities to seek mental
health care. The Indige nous communities have also
been influenced by the rapid social change in Australia.
The prevalen ce of unhealthy behaviours (e. g., excessive
alcohol use) and family violence has increased in recent
years [26], factors that may have contributed to higher
suicidal activities and deaths in Indigenous communities
[26]. Other studies in Australia also support these opi-
nions [27-29]. The ABS published the Socio-economic
Indexes for Area (SEIFA) at the Statistical Division (SD)
and LGA levels, including four indexes: the Index of
Relative Socio-economic Advantage and Disadvantage
(IRSAD), the Index of Relative Socio-economic Disad-
vantage (IRSD), the Index of Econo mic Resources (IER)
and the Index of Education and Occupation (IEO) [30].
The higher each variable indicates higher socioeconomic
status (SES) in each SD/LGA. Our previous study in
Queensla nd has indicated that LGAs with higher SEIFA
usually have lower suicide mortality [13]. In this study,
the SD of Wide Bay-Burnett (contains all the LGAs of
the cluster in the upper Southeast) had the lowest
IRSAD, IER and IEO and second lowest (higher than
the Northwest) IRSD among all the 11 SDs in Queens-
land. At the LGA level, Mornington Shire ranked
between the lowest 2
nd
and 14
th
among all 125 LGAs in
each index of SEIFA. This may contrib ute to the cluster
of high risk of suicide in the whole state. Other studies
also show similar results, especially in a long study per-
iod (e.g., over 30 years) when suicide prevention strate-
gies were implemented and their effects emerged over
such a period [31,32]. A recent study by Large and
Nielssen indicated that in Australia, suicide mortality
was lower in the decade 1998 to 2007 than that in the
decade 1988 to 1997 as the availability of lethal methods
of suicide decrea sed and there was also a sustai ned per-
iod of economic prosperity for most sections of society
[33].
Figure 4 Clusters of high suicide (total and male) risk area with
significance in Queensland (cluster enlarged).
Table 3 Spatial clusters of suicide in Queensland
Mostly likely cluster Secondary likely cluster
LGA names Mornington (S) Biggenden (S), Isis (S), Hervey Bay (C), Kilkivan (S), Tiaro (S), Woocoo (S)
Cluster radius (km) 0 57.01
Area (km
2
) 1231.25 12830.13
Population 945 (T), 487 (M) 64,054 (T), 31,839 (M)
Number of cases 14 (T), 12 (M) 79 (T), 64 (M)
Expected cases 0.63 (T), 0.53 (M) 42.87 (T), 34.49 (M)
Relative risk 22.26 (T), 22.88 (M) 1.87 (T), 1.88 (M)
P value 0.001 (T & M) 0.001 (T), 0.005 (M)
*S: Shire; C: City; T: Total; M: Male.
Qi et al. BMC Psychiatry 2010, 10:106
/>Page 7 of 10
Strengths and limitations
This study has three key strengths. Firstly, it is the first
study to examine the spatial distribution of suicide in
Queensland at a LGA level using a spatial cluster analy-
sis approach. The spatial cluster analysis can identify
clustered a reas with high risk of suicide, and this helps
researchers to both explore the factors associated with
clusters of high risk, and to address the public health
implications of these clusters in suicide control and pre-
vention. Secondly, this study explored the spatial pattern
of suicide in di fferent gender and age groups, using GIS
techniques. Finally, the results of this study may assist
in identifying high risk areas of suicide and developing
more effective suicide control and prevention strategies.
This study has several limitations. Firstly, the period of
collection of data related to suicide is relatively short, so
it is difficult to examine long term trends of suicide at
the LGA level. Secondly, the demographic data at the
LGA level were only based on the 2001 Population Cen-
sus, so they cannot reflect any changes in demographic
features during the whole study period. Thirdly, the
information of home address of suicides was not avail-
able due to ethical issues. There is a potential for mis-
classifying some suicide cases into different LGAs if
their houses were on boundaries areas, particularly
when boundaries changed. The difficulties in accurate
suicide data collection and reporting existed due to less
specific classification of suicide causes from deaths by
ICD Code [34]. Finally, it is difficult to determine
whether the spatial clusters were related to events that
took place s oon within a short space of time, or w ere
evenly spaced over time and location within high risk
communities. This issue should be addressed using a
spatiotemporal approach.
Future research and policy recommendations
A few recommendations can be drawn from this study.
Firstly, most suicide cases occurred in Brisbane and
other cities in SEQ, while the Wide Bay-Burnett had a
cluster o f high risk areas for suicide. Thus suicide con-
trol and prevention programmes should focus on these
areas, especially at the high risk clusters and the far
north areas. Secondly, further research s hould be con-
ducted focusing on the areas with high clustering or
high relative risks. Factors such as mental health and
community issues (e.g. alcohol abuse, domestic violence
and social disadvantage) in these areas and their associa-
tions with suicid e should be studied. Thirdly, socio-
environmental factors (e. g., meteorological factors like
temperature and rainfall [13,35,36], and socioeconomic
Figure 5 Suicide relative risk (A: total; B: male) in Queensland.
Qi et al. BMC Psychiatry 2010, 10:106
/>Page 8 of 10
factors like income [37] and unemployment [13,38] may
have significant impacts on suicide. Agriculture types
[39] and natural disasters [40,41] have a socioeconomic
impact on rural areas, which may lead to mental health
problems and even suicide behaviours. The association
between these factors and suicide at a LGA or other
geographical areas need to be explored. A spatiotem-
poral analysis should be implemented in future research
to examine how suicide incidence changes over time
and space. Finally, the results in current and future
research may provide epidemiological evidence for an
improvement of the current suicide control and preven-
tion programs.
Conclusions
In this study, we discovered that suicid e ASM varied
between LGAs by gender and age. Far north and north-
eastern Queensland had the highest suicide i ncidence
for both genders, while the south-western areas had the
lowest incidence for both genders. Mornington and
other six LGAs with low socioeconomic status in the
upper Southeast had significant spatial clusters of high
suicide risk. It suggests that public health interventions
for suicide should target these high risk areas. These
findings may h ave implications for implementing and
improving population-based suicide interventions in
Queensland, Australia. This sp atial analysis method may
also have a wide application in mental health research
and practices.
Abbreviations
ABS: (Australian Bureau of Statistics); ASM: (age-adjusted standardized
mortality); GIS: (geographical information system); LGA: (Local Governmental
area); RR: (relative risk); SEIFA: (Socioeconomic Indexes for Areas); SD:
(Statistical Division); SLA: (statistical local area).
Acknowledgements
We thank Dr. Andrew Page of the University of Queensland Dr. Lyle Turner
of the Queensland University of Technology for their input into this study.
Author details
1
School of Public Health, and Institute of Health and Biomedical Innovation,
Queensland University of Technology, Kelvin Grove, Queensland 4059,
Australia.
2
School of Population Health, University of Queensland, Herston,
Queensland 4006, Australia.
Authors’ contributions
XQ designed the study, implemented all statistical analyses and drafted the
manuscript. ST conceptualised the idea and revised the study protocol,
especially the research design and data analysis. WH contributed to
statistical analyses and interpretation of the results. All the authors
contributed to the preparation of the final manuscript and approved the
submission.
Competing interests
The authors declare that they have no competing interests.
Received: 2 August 2010 Accepted: 7 December 2010
Published: 7 December 2010
References
1. World Health Organization: The world health report: shaping the future.
WHO Press, Geneva, Switzerland; 2003.
2. World Health Organization: Figures and facts about suicide. WHO Press,
Geneva, Switzerland; 1999.
3. Australian Bureau of Statistics: 3309.0 Suicides, Australia, 1921 to 1998.
Canberra; 2000.
4. Australian Bureau of Statistics: 3309.0.55.001 Suicide: recent trends,
Australia, 1993-2003. Canberra; 2004.
5. NSW Health: Suicide in New South Wales. We need to know more - The
NSW Suicide Data Report. Sydney; 2004.
6. Measey MA, Li SQ, Parker R, Wang Z: Suicide in the Northern Territory,
1981-2002. Med J Aust 2006, 185:315-319.
7. Lawrence D, Almeida OP, Hulse GK, Jablensky AV, Holman CD: Suicide and
attempted suicide among older adults in Western Australia. Psychol Med
2000, 30:813-821.
8. De Leo D, Evans R: Suicide in Queensland, 1996-1998: mortality rates and
related data. Brisbane: Australian Institute for Suicide Research and
Prevention; 2002.
9. De Leo D, Heller TS: Suicide in Queensland, 1999-2001: mortality rates
and related data. Brisbane: Australian Institute for Suicide Research and
Prevention; 2004.
10. Middleton N, Sterne J, Gunnell DJ: An atlas of suicide mortality: England
and Wales, 1988-1994. Health & Place 2008, 14:492-506.
11. Saunderson TR, Langford IH: A study of the geographical distribution of
suicide rates in England and Wales 1989-92 using empirical Bayes
estimates. Soc Sci Med 1996, 43:489-502.
12. Bastos Mde J, Pereira Jdos A, Smarzaro DC, Costa EF, Bossanel RC,
Oliosa DM, Pereira JG, Feitosa HN, Costa MF, Oliveira FJ, Fávero JL,
Maciel EL: Ecological analysis of accidents and lethal violence in Vitória,
Southeastern Brazil. Rev Saude Publica 2009, 43:123-132.
13. Qi X, Tong S, Hu W: Preliminary spatiotemporal analysis of the
association between socio-environmental factors and suicide. Environ
Health 2009, 8:46.
14. Cantor CH, Coory M: Is there a rural suicide problem? Aust J of Public
Health 1993, 17:382-384.
15. Cantor CH, Slater PJ: A regional profile of suicide in Queensland. Aust and
N Z J of Public Health 1997, 21:181-186.
16. Fang L, Yan L, Liang S, de Vlas SJ, Feng D, Han X, Zhao W, Xu B, Bian L,
Yang H, Gong P, Richardus JH, Cao W: Spatial analysis of hemorrhagic
fever with renal syndrome in China. BMC Infect Dis 2006, 6:77.
17. Kulldorff M: A spatial scan statistic. Communications in Statistics: Theory and
Methods 1997, 26:1481-1496.
18. Zhang W, Wang L, Fang L, Ma J, Xu Y, Jiang J, Hui F, Wang J, Liang S,
Yang H, Cao W: Spatial analysis of malaria in Anhui province, China.
Malar J 2008, 7:206.
19. Queensland Government Treasury: 2007-08 Annual Economic Report on
the Queensland economy - year ended 30 June 2008. Brisbane, Australia;
2008.
20. MapInfo Corporation: MapInfo Professional Version 8.5 User Guide
(Unabridged). New York, United States of America; 2006.
21. Norusis M: SPSS 16.0 guide to data analysis. Upper Saddle River NJ,
United States of America: Prentice Hall; 2008.
22. Kulldorff M: SaTScan User Guide for version 8.0. 20 09 [].
23. Australian Bureau of Statistics: 3218.0 Regional Population Growth,
Australia and New Zealand, 1991 to 2001. Canberra; 2002.
24. Glaz J, Balakrishnan N, editors: Scan Statistics and Applications. Birkhäuser:
Boston; 1999.
25. Andreasyan K, Hoy WE, Kondalsamy-Chennakesavan S: Indigenous
mortality in remote Queensland, Australia. Aust N Z J Public Health 2007,
31:422-427.
26. Hunter E, Milroy H: Aboriginal and Torres Strait islander suicide in
context. Arch Suicide Res 2006, 10:141-157.
27. Pridmore S, Fujiyama H: Suicide in the Northern Territory, 2001-2006. Aust
N Z J Psychiatry 2009, 43:1126-1130.
28. Hunter E: Demographic factors contributing to patterns of violence in
Aboriginal communities. Australas Psychiatry 1993, 1:152-153.
29. Tatz C: Aboriginal suicide is different – Aboriginal youth suicide in New
South Wales, the Australian Capital Territory and New Zealand: Towards
a model of explanation and alleviation. A report to the Criminology
Qi et al. BMC Psychiatry 2010, 10:106
/>Page 9 of 10
Research Council. Sydney: Centre for Comparative Genocide Studies,
Macquarie University; 1999.
30. Australian Bureau of Statistics: 2039.0 Census of Population and Housing,
Socio-Economic Indexes for Areas, Australia. Canberra; 2001.
31. Page A, Morrell S, Taylor R, Carter G Dudley M: Divergent trends in suicide
by socio-economic status in Australia. Soc Psychiatry Psychiatr Epidemiol
2006, 41:911-917.
32. Taylor R, Page A, Morrell S, Harrison J, Carter G: Social and psychiatric
influences on urban-rural differentials in Australian suicide. Suicide Life
Threat Behav 2005, 35:277-290.
33. Large MM, Nielssen OB: Suicide in Australia: meta-analysis of rates and
methods of suicide between 1988 and 2007. Med J Aust 2010, 19:432-437.
34. Australian Bureau of Statistics: 3303.0 Causes of Death, Australia, 2007.
Canberra; 2009.
35. Lambert G, Reid C, Kaye D, Jennings G, Esler M: Increased suicide rate in
the middle-aged and its association with hours of sunlight. Am J
Psychiatry 2003, 160:793-795.
36. Nicholls N, Butler CD, Hanigan I: Inter-annual rainfall variations and
suicide in New South Wales, Australia, 1964-2001. Int J Biometeorol 2006,
50:139-143.
37. Huisman M, Oldehinkel AJ: Income inequality, social capital and self-
inflicted injury and violence-related mortality. J Epidemiol Community
Health 2009, 63:31-37.
38. Chan WS, Yip PS, Wong PW, Chen EY: Suicide and unemployment: what
are the missing links? Arch Suicide Res 2007, 11:327-335.
39. Fragar LJ, Gray EJ, Franklin RJ, Petrauskas V: A picture of health: a
preliminary report of the health of country Australians. The Australian
Agricultural Health Unit; 1997, P.O. Box 256, Moree, NSW 2400.
40. Sartore G: Drought and its effect on mental health–how GPs can help.
Aust Fam Physician 2007, 36:990-993.
41. Fuller J, Kelly B, Sartore G, Fragar L, Tonna A, Pollard G, Hazell T: Use of
social network analysis to describe service links for farmers’ mental
health. Aust J Rural Health 2007, 15:99-106.
Pre-publication history
The pre-publication history for this paper can be accessed here:
/>doi:10.1186/1471-244X-10-106
Cite this article as: Qi et al.: Spatial distribution of suicide in
Queensland, Australia. BMC Psychiatry 2010 10:106.
Submit your next manuscript to BioMed Central
and take full advantage of:
• Convenient online submission
• Thorough peer review
• No space constraints or color figure charges
• Immediate publication on acceptance
• Inclusion in PubMed, CAS, Scopus and Google Scholar
• Research which is freely available for redistribution
Submit your manuscript at
www.biomedcentral.com/submit
Qi et al. BMC Psychiatry 2010, 10:106
/>Page 10 of 10