Principles of Air Quality Management - Chapter 7 docx
Bạn đang xem bản rút gọn của tài liệu. Xem và tải ngay bản đầy đủ của tài liệu tại đây (1.27 MB, 29 trang )
179
7
Mobile Sources and
Control Approaches
While the sulfurous fogs crept across London in early December 1952, the townspeople
were not fully aware of what was happening. But many townspeople were pleased that
the conversion of the city’s trolleys from electricity to diesel powered buses was now
complete.
London, December 1952
Probably the most important change in sources of U.S. air contaminant emissions
from the early 20th to the early 21st century was the shift from stationary sources
to predominantly mobile sources. Technologies and approaches to reducing mobile
source emissions lagged behind approaches applied to stationary sources because
of the lag in recognition of the mobile sources’ contribution to the problem.
Motor vehicles make up the largest number of sources of air contaminant emis-
sions in the United States. These vehicles include passenger vehicles, light-duty
trucks/SUVs (LDTs), and medium- to heavy-duty trucks (M/HDTs). As seen in
Table 7.1, passenger and light-duty trucks form the majority (over 95%) of the motor
vehicles on the road.
The significance of these mobile sources is that they are powered primarily by
gasoline-burning combustion systems. Gasoline-powered vehicles are responsible
for 78% and 92%, respectively, of the gallons of fuel consumed and miles driven.
Diesel fuel oil accounts for the balance. Individual emissions from each source are
small; however, because of the large number of sources involved, the aggregate
emissions are significant.
As a consequence, we need to understand how the major types of engines that
drive our mobile sources work, how they can be modified, and the most efficient
ways available of controlling the emissions that are ultimately released. Equally
important is the effect of the fuels they burn on their respective criteria and toxic/haz-
ardous air emissions. Finally, a word needs to be said about alternatives to traditional
engines and fuels and some new approaches.
ENGINES AND AIR POLLUTANT EMISSIONS
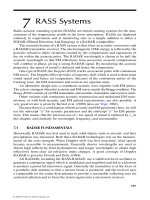
On a pollutant-specific basis,
mobile sources
account for varying percentages of air
contaminant emission. Figure 7.1 indicates that these percentages vary from 77%
of the total national CO emissions to less than 30% of the particulate matter emis-
sions. However, on a specific geographic basis, such as in California, mobile-source
emissions are significantly higher. The internal combustion engine (ICE) is the basic
power plant for these vehicles, whether spark ignited or compression ignited.
7099_C007.fm Page 179 Monday, July 24, 2006 2:54 PM
© 2007 by Taylor & Francis Group, LLC
180
Principles of Air Quality Management, Second Edition
There are also a large number of nonvehicular ICEs that may play a significant
part in air quality management strategies. It is estimated that between 7 and 8 million
outboard engines are in use in the United States at the present time, as well as 8–12
million engines in lawn mowers, leaf blowers, chain saws, and similar applications.
The emissions from these devices have been largely uncontrolled up to the 21st
century, and therefore their contribution, in addition to that from aircraft, may
represent a significant local effect on air quality. The principles involved in under-
standing air pollutant emissions from ICEs are the same as for mobile vehicular
sources.
Likewise, stationary-source ICEs have the same pollutant formation
patterns
;
however, they are not subject to the changes in
operating modes
typical of a mobile
ICE. While stationary gasoline- or diesel-powered
reciprocating ICEs have the same
emission patterns they are usually operated in a “cruise” mode rather than the cyclic
pattern of mobile sources. Mobile sources, for instance, change from idle to
TABLE 7.1
U.S. On-Road Motor Vehicles — 2003
Vehicle Type
Number,
millions
Gallons of Fuel,
billions
VMT,
billions
Passenger 136 75 1659
Light-duty trucks, SUVs 85 56 966
Medium-/heavy-duty trucks 8 38 214
Total 228 169 2839
VMT = vehicle miles traveled
FIGURE 7.1
Mobile source emissions. (US data from the 1999 EPA National Air Quality
and Emissions Trends. Southern California data from the 2004 California Air Resources Board
Emission Inventory.)
100
80
60
40
20
0
Percent mobile sources
CO NO
x
VOC/HC PM10
US
California
7099_C007.fm Page 180 Monday, July 24, 2006 2:54 PM
© 2007 by Taylor & Francis Group, LLC
Mobile Sources and Control Approaches
181
acceleration to cruise to deceleration to stop and back again. Thus, emissions attrib-
utable to changes of operating mode are not significant for stationary ICEs but are
important for mobile sources.
The most significant difference between mobile sources driven by piston engines
and those driven by combustion turbines (Figure 4.6 seen earlier) is that the latter
experience continuous combustion. The processes occurring in piston engines are
essentially a series of explosions internal to the cylinder so that there are tremendous
differences in temperature, pressure, gas composition, and volume occurring through-
out its cycle.
POLLUTANT FORMATION IN
SPARK-IGNITED ENGINES
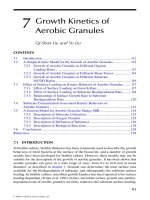
Formation of air pollutants in spark-ignited ICEs occurs in two regions: the bulk
gas region and the boundary layer, or surface region. Each region has unique
properties; therefore, the relative amounts of criteria pollutants and their formation
mechanisms differ in each region. These regions are illustrated in Figure 7.2.
B
ULK
G
AS
P
OLLUTANT
–F
ORMATION
R
EGION
The bulk gas reactions for a spark-ignited engine produce both fuel hydrocarbons
and CO and are generally formed by similar mechanisms. Oxides of nitrogen for-
mation occurs solely in the bulk gas reactions and is a function of many variables.
Particulate matter is a significant contaminant for diesel ICEs and is addressed
primarily through back-end controls.
Hydrocarbons and CO form through two mechanisms in the cylinder, depending
on whether they are in a fuel-rich or the fuel-lean region of the bulk gas at any point
in the thermodynamic cycle. In a fuel-rich region, hydrocarbon fuel fragments and
CO will be formed as a result of a deficiency of oxygen to support complete
combustion. Such fuel-rich regions occur during start-up, deceleration, and warm-
up operating modes. In the bulk gas in which the fuel/air mixture is in an extremely
FIGURE 7.2
Regions of ICE pollutant formation.
Spark plug
Cylinder wall
Bulk gas reactions
Flame front
Surface effects
Piston head
7099_C007.fm Page 181 Monday, July 24, 2006 2:54 PM
© 2007 by Taylor & Francis Group, LLC
182
Principles of Air Quality Management, Second Edition
fuel-lean (excess air) condition, oxidized carbon gases will be formed and remain
as a result of incomplete flame propagation. In these regions, carbon monoxide levels
are high.
Carbon monoxide, once formed, is fixed by the chemical kinetics of reactions
in the bulk gases. Carbon monoxide is difficult to oxidize without high temperatures;
therefore, its formation occurs as a result of thermal quenching
.
This effect is rapid
at high air-to-fuel ratio mixtures. Hydrocarbon levels depend on the amount of
oxygen present. The effect of thermal quenching for hydrocarbons is much more
severe for a given temperature gradient than it is for CO.
Oxides of nitrogen formation is a function of many variables, including the gas
temperature (for thermal NO
x
), the residence time at high temperature, and the
availability of excess oxygen. The latter is a function of the air-to-fuel ratio.
Most oxides of nitrogen are formed in the hot, turbulent gas regions of the flame.
The thermal NO
x
formation process is termed the Zeldovich mechanism. In these
high-temperature regions, molecular oxygen is dissociated into oxygen free radicals,
which react very quickly with nitrogen to yield one NO molecule plus a nitrogen
free radical. The nitrogen free radical then attacks an oxygen molecule to yield one
NO plus an oxygen free radical, and so on. Equations (7.1–7.3) illustrate these steps
in the formation of NO by the Zeldovich mechanism.
O
2
→
2O* (7.1)
O* + N
2
→
NO + N* (7.2)
N* + O
2
→
NO + O* (7.3)
Thus, for every oxygen molecule that is cleaved by high temperature, four NO
molecules will form while regenerating more oxygen free radicals. There is therefore
a near exponential increase of NO with temperature as the percentage of oxygen
molecules being cleaved increases.
S
URFACE
P
OLLUTANT
–F
ORMATION
R
EGION
The other major region of air pollutant formation is on the walls and surfaces of the
cylinder. Within the cylinder, a boundary layer of fuel and air will form along the
surface of the piston head and cylinder walls, which significantly influences emission
formation. The cylinder of a spark-ignited ICE also serves as a very large
heat sink
,
as well as providing high surface areas for physical or chemical reactions.
Thus, the walls and head of the cylinder and piston are a major source of
hydrocarbons, carbon monoxide, aldehydes, and other products of incomplete com-
bustion (PICs). These result from the quenching of combustion resulting from heat
sink temperature losses. It has been estimated that approximately 1% of the entire
fuel charge is not burned as a result of these wall effects.
Deposits, as well as cracks and crevices in and on the surfaces of the cylinder,
will enhance the trapping of fuel hydrocarbons in such deposits or crevices. Deposits
are formed in localized hot spots that cause metal corrosion. Localized cold spots
may condense out fuel fragments as tar. These carbonaceous deposits act like a fuel
7099_C007.fm Page 182 Monday, July 24, 2006 2:54 PM
© 2007 by Taylor & Francis Group, LLC
Mobile Sources and Control Approaches
183
vapor “sponge.” During the varying temperature regimes of the cycle, these sponges
act to adsorb and desorb fuel components and products of incomplete combustion.
As the piston moves up and down in the cylinder, a film of oil forms on the
walls, yielding a “wet” effect. This wetted wall serves as an additional location for
absorption or desorption of fuel fragments. These factors contribute to hydrocarbon
and PIC emissions during operation.
F
OUR
-S
TROKE
P
OLLUTANT
M
ECHANISMS
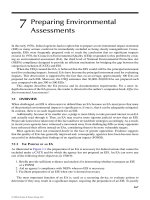
An illustration of one cylinder typical of a gasoline-powered ICE during the four
“strokes” of normal operation is seen in Figure 7.3.
During the compression stroke, when the fuel and air are in the chamber, oil
and deposit layers absorb hydrocarbons. Fuel and PICs (from the previous cycle)
are forced into cracks and crevices in the cylinder surfaces as the pressure increases.
During the combustion stroke, the pressure is still rising as the spark from the
spark plug ignites the entire mixture. As the flame front moves through the mixture,
NO forms in the high-temperature burning gas. CO, if the mixture is fuel rich, will
be present in the high-temperature gases. As a result of the increasing pressure at
this point in the cycle, unburned fuel will be further forced into crevices on the
surfaces of the piston head and exposed cylinder walls.
During the “power” expansion stroke, the piston is forced downward, and the
volume begins increasing in the chamber. The temperature begins dropping, and NO
formation is frozen as the burned gases cool. This is followed by a freezing of the
CO combustion chemistry. Along the walls and from crevices in the cylinder, an
outflow of hydrocarbon fuel fragments from those crevices begins. Some portions
of those hydrocarbons will form CO and products of incomplete combustion.
During the exhaust portion of the cycle, the pressure in the cylinder drops to
slightly above atmospheric, and wall effects begin to dominate. Deposits, cracks,
and crevices desorb additional hydrocarbons, fuel fragments, and PICs. Desorption
of fuel fragments from the oily layers along the walls of the cylinder occur at this
point. The cylinder head scrapes more fuel from the wall layers and desorbs those
into the exhaust gases before the closure of the exhaust valve.
From this we may understand some of the basics of air pollutant formation in
an ICE. These steps in the process are a function of the complex interactions of
pressure, temperature, volume, combustion kinetics, and mechanical effects in a
spark-ignited gasoline-powered engine.
L
ESSER
S
OURCES
OF
C
ARBON
G
AS
P
OLLUTANT
E
MISSIONS
The effects of wear and aging on engines may contribute significantly to hydrocarbon
and CO emissions. These are partly because of the formation of surface deposits or
corrosion building up over the course of time. Poorly seated valves and rings may
also cause leaks of fuel or fuel fragments into the exhaust. Likewise, poor or faulty
ignition generates pure hydrocarbon emissions during cranking, and scoring and
crevice formation on aging engine surfaces lead to high emissions.
7099_C007.fm Page 183 Monday, July 24, 2006 2:54 PM
© 2007 by Taylor & Francis Group, LLC
184
Principles of Air Quality Management, Second Edition
Blowby, which is the flow of fuel vapors past the cylinder walls into the crankcase,
may be a significant source of uncontrolled hydrocarbon emissions. In older, uncon-
trolled vehicles, these fuel vapors may account for 20%–25% of the total hydrocarbon
emissions. Newer vehicles recirculate crankcase gases through positive ventilation
systems back into the combustion air intake for reburning.
Scavenging losses occur when both intake and exhaust valves are open at the
same time. In a two-stroke engine, where both valves must be open for the engine
FIGURE 7.3
Combustion in an automobile engine (one cylinder of a typical automobile
engine shown).
Air
Carburetor
Fuel-air mixture
Fuel
Piston
Connecting rod
(1) Intake stroke
Crankshaft
Intake valve
Spark plug
Exhaust valve
Cylinder
(combustion
chamber)
(2) Compression stroke
(3) Power stroke (4) Exhaust stroke
Burnt
fuel
mixture
7099_C007.fm Page 184 Monday, July 24, 2006 2:54 PM
© 2007 by Taylor & Francis Group, LLC
Mobile Sources and Control Approaches
185
to operate, scavenging losses are a major source of hydrocarbons, as the seating of
the valves and the design of the combustion chamber require both to be open during
portions of the cycle. For a four-stroke engine, the scavenging losses occur when a
supercharged or turbocharged system is in operation. This causes portions of the
fuel–air mixture to pass directly from the intake to the exhaust.
F
UEL
C
OMPOSITION
AND
E
XHAUST
E
MISSIONS
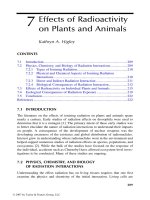
Figure 7.4 illustrates the variety of air pollutants (organic compounds and fuel
fragments) in the exhaust of a spark-ignited gasoline-powered four-stroke engine.
The four categories are the paraffins (saturated hydrocarbons), the aromatics or
unsaturated ring structures, the olefins or double-bonded carbon systems, and the
oxygenates or fuel fragments containing oxygen. These categories are charted by
species percentage for each carbon number represented. The actual number of
individual compounds in gasoline and its exhaust ranges into the hundreds of discrete
chemical species. This figure also illustrates the typical average gasoline composi-
tion, listed by species. Oxygenates are the partially burned fragments of fuel left in
the exhaust. Interestingly enough, the largest single oxygenate is the single-carbon
atom species formaldehyde. The highest two-carbon atom compound is acetaldehyde.
A comparison of the fuel composition with exhaust hydrocarbon composition
demonstrates the strong correlation between the exhaust species distribution and the
fuel species. For paraffins and olefins, there is also a “downshift” to lower carbon
numbers, representing fuel fragments. This indicates that, except for the oxygenates,
the exhaust hydrocarbon emissions are essentially components of the original gasoline.
DIESEL IGNITION EMISSION CHARACTERISTICS
The significant differences between a diesel-ignited system and a spark-ignited
system are that the diesel system operates at extremely high pressures (approximately
100 atmospheres) and high (lean) air-to-fuel ratios, producing high excess air in the
chamber. The bulk gas temperature range is about the same.
One of the more significant differences, though, between diesel- and spark-
ignited systems is that current diesel engines operate by injecting a measured amount
of oil into the cylinder at high compression. With oil injection, the mixing and
evaporation of fuel components into the gas phase is significantly different from a
carbureted system, which uses gasoline or other low–molecular weight fuels. The
significance of the liquid fuel spray cannot be overestimated, as it strongly affects
the pattern of air pollutants formed in the diesel system.
Another difference is the air-to-fuel ratio in the diesel combustion chamber. This
air-to-fuel ratio varies spatially throughout the combustion zone as a result of the
fuel spray. Air swirl will also influence the geometry of the flame pattern. Liquid fuel
spray, air-to-fuel ratio, and air swirl interact under the high-pressure regimes to
influence the combustion contaminants associated with diesel emissions. As the jet
of fuel is injected into the combustion chamber, the high temperature and air swirl
cause the formation of a fan-shaped pattern of evaporating fuel droplets and vapors.
7099_C007.fm Page 185 Monday, July 24, 2006 2:54 PM
© 2007 by Taylor & Francis Group, LLC
186
Principles of Air Quality Management, Second Edition
FIGURE 7.4
Exhaust gas distributions versus fuel composition.
20
10
15
5
0
Fuel
Fuel
10
8
6
4
2
0
C1
C1 C2 C3 C4 C5 C7 C8 C9 C10 C11
C1 C2 C3 C4 C5 C6 C7 C8 C9 C10 C11
C2 C3 C4 C5 C6 C7 C8 C9 C10 C11
Carbon number
Gasoline Exhaust
Carbon number
Gasoline Exhaust
Paraffin content, vol %
Gasoline vs. Exhaust
Olefin content, % vol
Gasoline vs. Exhaust
Aromatics content, % vol
Gasoline vs. Exhaust
Oxygenated content
exhaust %
3.5
3.0
2.5
2.0
1.5
1.0
0.5
0.0
C6
14
12
10
8
6
4
2
0
Exhaust Exhaust
Carbon number
Gasoline Exhaust
C1
C2 C3 C4 C5 C6 C7 C8 C9 C10 C11
Carbon number
Gasoline
Oxygenates
12
10
8
6
4
2
0
1.0
Fuel
14
12
10
8
6
4
2
0
Exhaust Exhaust
0.8
0.6
0.4
0.2
0.0
0.5
0.4
0.3
0.2
0.1
0.0
7099_C007.fm Page 186 Monday, July 24, 2006 2:54 PM
© 2007 by Taylor & Francis Group, LLC
Mobile Sources and Control Approaches
187
As a consequence, four major regions have been identified in the compression-
ignited system. Air contaminant generation varies significantly in each zone. These
regions are the fuel spray edge, the flame zone, the core, and the droplet or impinge-
ment zone. These four zones are illustrated in Figure 7.5.
At the edge of the spray, the air-to-fuel ratio is too lean for flame propagation
and good combustion because of the high excess air. This is a zone of formation for
carbon monoxide and other PICs, as well as gaseous hydrocarbon fuel fragments.
At low or idle conditions, this zone is relatively large, and therefore emissions of
hydrocarbons are greater. However, as the pressure and temperature increase with
increasing load, this zone decreases, and the overall emission of hydrocarbons, CO,
and PICs will decrease.
The flame zone is operating at near stoichiometric conditions at the highest flame
temperatures. Therefore, this area tends to form high quantities of oxides of nitrogen
but very little CO or hydrocarbons. Also, this zone is relatively long lasting, and
therefore more NO
x
is generated as a result of the relatively longer time that the
burning parcels exist at those high temperatures.
The spray core is that zone in which droplet evaporation is the predominant
mechanism. The combustion in this zone is limited because of the relatively slow
diffusion of combustible vapors from droplets into the available surrounding air
mass. As a result of the diffusion-controlled nature of this combustion, the amount
of swirl air interacting in this zone will significantly affect the pollutant mix.
At low loads, where a relatively smaller fuel is available, some oxides of nitrogen
will be formed here because of the amount of excess air available to the diffusion
flame. At higher loads, however, this zone will be responsible for CO, hydrocarbons,
and PICs, as well as
soot or carbonaceous particles. Diesel particulates, once formed,
are not easily oxidized and will therefore be emitted. Soot particulate is a significant
problem with diesel fuel and is listed in California as a toxic air contaminant.
The fourth zone is the location at which large fuel droplets are responsible for
most of the pollutant generation. This occurs in two different portions of the com-
bustor. The first portion is where the relatively larger droplets occur at the end of
the fuel injection, close to the injection port. These large drops form as a result of
reduced pressure at the end of the injection and the higher combustion chamber
pressure.
FIGURE 7.5
Diesel fuel liquid spray pattern.
Injector
3. Core
4. Impingement area
Piston
head
2. Flame zone
1. Edge
7099_C007.fm Page 187 Monday, July 24, 2006 2:54 PM
© 2007 by Taylor & Francis Group, LLC
188
Principles of Air Quality Management, Second Edition
These relatively large drops are also responsible for diffusion-controlled com-
bustion and, likewise, form soot particles on the evaporation of volatile components.
Hydrocarbon and PICs are also found in the emission. Finally, some of these large
drops may impinge on the cylinder head and are responsible for additional hydro-
carbon and PIC emissions as well as soot formation and carbonaceous deposits.
P
OLLUTANT
P
ATTERNS
A comparison of the pollutant patterns of gasoline (Otto cycle) engines and diesel
engines is shown in Table 7.2 for two operating modes. In this table, we see the
differences in emission patterns under idle conditions and under normal cruise
conditions for the two engine types.
For oxides of nitrogen under cruise conditions, a diesel cycle system produces
significantly higher overall NO
x
emissions than a spark-ignited or Otto cycle engine.
At idle conditions, as noted above, the NO
x
emissions are much lower than for the
spark-ignited systems.
With respect to hydrocarbons and carbon monoxide, spark-ignited emissions are
significantly higher — in some cases by an order of magnitude — than those from
diesels because of the excess air and compression conditions noted earlier for diesels.
Carbonaceous particulate formation for diesels is significantly greater than for spark-
ignited systems because of the higher molecular weight and oily nature of diesel fuels.
H
YDROCARBON
E
MISSIONS
FROM
T
RIP
C
YCLES
Quite apart from the comparisons of the two engine types is the influence of “cold
start” and “hot soak” hydrocarbon emissions as opposed to those from cruise or
TABLE 7.2
Typical Internal Combustion Engine
Cylinder Exhaust Concentrations
Contaminant Cruise Mode Idle Mode
NO
x
, ppm
Diesel 1400 50
Gasoline 500 100
HC, ppm
Diesel 100 200
Gasoline 6000 4,000
CO, ppm
Diesel 500 150
Gasoline 60,000 10,000
PM10
Diesel High High
Gasoline Low Low
7099_C007.fm Page 188 Monday, July 24, 2006 2:54 PM
© 2007 by Taylor & Francis Group, LLC
Mobile Sources and Control Approaches
189
running exhaust. In Table 7.3, the influence of trip length on uncontrolled hydrocar-
bon emissions is summarized. Cold start emissions are fairly constant at about 9 g
of fuel hydrocarbons per start. The end-of-trip period or hot soak generates roughly
2 g of hydrocarbons for the average car equipped with a catalyst. Cold start and hot
soak emissions are termed
standing emissions
. The cruise emissions are approxi-
mately 0.55 g per mile and are thus a function of the total miles traveled.
The significance of these differences in running versus standing emissions is in
the control approach taken. Implementing emission reductions in the first 2–3 min-
utes of operation, as well as during the hot soak or cool-down at the end of the trip,
would significantly lower overall air quality effects. Thus, air quality management
strategies will have to identify techniques for controlling evaporative hydrocarbon
emissions as a function of the number of individual trips.
These standing versus running emissions appear to explain some studies that
show greater frequencies of elevated ozone levels on weekends when, presumably,
there are a greater number of short trips but a lesser number of total miles traveled
in areas such as Los Angeles.
E
NGINE
T
HERMODYNAMIC
C
YCLES
The purpose of any mobile source of emissions is to provide useful work to drive
a vehicle, whether automobile, truck or airplane, to a different location. To accom-
plish this, useful work must be extracted from the engine.
Useful work from a system is described by its thermodynamic cycle. The three
cycles representing mobile sources are illustrated in Figures 7.6, 7.7, and 7.8 by their
respective pressure–volume diagrams. In piston engines, the cycles are represented
by what happens to the fuel, air, and combustion byproducts mixture in the cylinder.
The four steps of the cycle are compression, ignition, expansion or work-producing
(step), and exhaust. These four steps are the same whether it is a two-stroke or a
four-stroke engine. (The number of strokes refers to the number of times the piston
traverses the length of the cylinder for each power step
.
)
Figure 7.6 refers to the spark ignition cycle, commonly called the Otto cycle
after the German engineer who built the first successful operating spark-ignited
TABLE 7.3
Influence of Trip Cycles on HC Emissions*
Trip Length
Condition 5 Miles 10 Miles 20 Miles
Cold start 9 9 9
Hot soak 2 2 2
Cruise 3 6 12
Total HC, grams 14 17 23
* Grams total hydrocarbons.
Source:
California Air Resources Board.
7099_C007.fm Page 189 Monday, July 24, 2006 2:54 PM
© 2007 by Taylor & Francis Group, LLC
190
Principles of Air Quality Management, Second Edition
gasoline engine. This figure illustrates each of those steps on an arbitrary pres-
sure–volume diagram. Beginning in the lower right-hand corner, the fuel and air are
compressed to much smaller volume with a slight increase in pressure, at which
point ignition occurs. From that point, combustion begins, which dramatically
increases the pressure in the system with only slight variations in volume. As the
combustion proceeds, expansion of the hot combustion gases increases the volume
and decreases the pressure as useful work is accomplished. The last step of the cycle
is when the combustion gases are exhausted from the cylinder. This brings us to the
point of return at which the cylinder is ready for a fresh charge of fuel and air.
Figure 7.7 illustrates the diesel cycle in which much higher compression of the
air in the cylinder occurs. At a point near the maximum pressure, liquid fuel is
FIGURE 7.6
Otto cycle, compression ratio of 9:1.
FIGURE 7.7
Diesel cycle, compression ratio of 19:1.
50
40
30
20
10
0
Pressure – atmosp
h
eres
0 5 10
Ideal
Expansion
Actual
Ignition
Compression
Combustion
Exhaust
Volume – arbitrar
y
100
80
60
40
20
0
Pressure – atmospheres
01020
Volume – arbitrary
Compression
Expansion
Combustion
Exhaust
Injection
Ideal
Actual
7099_C007.fm Page 190 Monday, July 24, 2006 2:54 PM
© 2007 by Taylor & Francis Group, LLC
Mobile Sources and Control Approaches
191
injected (sprayed) into the cylinder near the final portion of the compression stroke,
after which gas combustion occurs by auto ignition. The hot gases provide work to
the drive shaft by expansion against the piston. This increases the volume and lowers
the pressure in the cylinder until the gases are exhausted.
The thermodynamic cycle for combustion turbines is seen in Figure 7.8. This is
the Brayton cycle and operates at significantly lower pressures. In this system,
compression is accomplished by compressor blades, and combustion occurs via a
standing flame at nearly a constant pressure. Exiting the combustor can, the hot
gases expand and drive turbine blades (which power the compressor shaft) and exit
the exhaust, providing thrust for the aircraft. Figure 4,7, seen earlier, is a schematic
of a combustion turbine.
A summary of the significant differences in ignition source, pressure, air-to-fuel
ratio, peak temperatures, and peak pressure is seen in Table 7.4. These are useful in
evaluating performance-based emission differences.
FIGURE 7.8
Brayton cycle, pressure ratio 4:1.
TABLE 7.4
ICE Operating Parameter Comparisons
Otto Cycle* Diesel Cycle* Brayton Cycle**
Ignition source Spark Compression Spark
Peak pressure, atm 35 100 4
Compression ratio 6 to 11:1 14 to 22:1 N.A.
Fuel delivery Aspirated or injected Injected Injected
Air-to-fuel ratio Near ideal Lean Very lean
Peak temperature (˚R) 4500–5000 4500–5000 2250–2600
* Reciprocating piston.
** Continuous, combustion gas turbine.
N.A. = Not applicable.
Combustion
Actual
Ideal
E
xpansion
Atmosphere
Compression
20 15 10 5 0
Volume – arbitrary
5
4
3
2
1
0
Pressure – atmosp
h
eres
7099_C007.fm Page 191 Monday, July 24, 2006 2:54 PM
© 2007 by Taylor & Francis Group, LLC
192
Principles of Air Quality Management, Second Edition
HYBRID INTERNAL COMBUSTION ENGINES
Research into hybrid ICEs has continued to find more efficient engines with lower
air-contaminant emissions resulting from operating fossil fuels.
In the last few years, a new syncretistic engine design has been developed called
the HCCI, or
homogeneous charge compression ignition
engine. Earlier names
included the active thermo-atmosphere combustion engine and the hot vapor injec-
tion engine.
The HCCI is a relatively new combustion technology. It is a hybrid of the
traditional spark ignition (Otto engine) and the compression ignition engine (diesel).
Unlike the spark-ignited or diesel engine, however, HCCI combustion takes place
spontaneously and homogeneously, without flame propagation. This alternative com-
bustion process uses lean mixtures ignited without a spark or flame front, which
eliminates heterogeneous air/fuel mixture regions. In addition, HCCI operates as a
fuel-lean combustion process. These conditions translate to a lower local flame
temperature, which lowers the amount of NO
x
produced in the process.
To achieve the homogeneous charge, fuel and air are well mixed throughout
every region of the cylinder before combustion. There is theoretically no localized
high-temperature flame front; instead, there are hundreds of evenly distributed points
of ignition, indicating spontaneous combustion of the gas volume in the cylinder.
High exhaust-gas dilution and lean mixtures greatly reduce peak temperatures and
heat-transfer losses, which further reduces NO
x
formation.
As a practical matter, HCCI works better in theory than in practice at this time.
Achieving sufficient thermal energy late in the compression stroke to trigger the
required auto-ignition consistently is an ongoing challenge. Using a compression
ratio beyond 12:1 causes severe knock during full-load operation. Other concerns
are excessive rates of pressure rise and the combustion-generated noise associated
with very high compression.
A more practical avenue being pursued by researchers is using high levels of
exhaust gas recirculation by various means to supply the desired thermal energy
needed for auto-ignition. One technique, called recompression, traps exhaust in the
cylinder by closing the exhaust valve early. Another approach (rebreathing) captures
exhaust after it has left the cylinder and draws it back into the chamber.
Unfortunately, power density is lower with HCCI combustion engines than with
gasoline engines running with stoichiometric air/fuel ratios. A greater problem,
however, is that HCCI operation is not yet possible during engine warm-up, at very
light loads, or at idle because exhaust energy is too low to trigger auto-ignition
during these conditions. Another concern is that peak combustion temperatures well
below the threshold of NO
x
formation result in incomplete oxidation of the fuel and
air. As a result, HC and CO emissions may be 50% higher than today’s normal
spark-ignited gasoline engines. A third dilemma is that the exhaust temperature is
too low for proper catalytic converter function.
While the HCCI approach may represent the next generation of practical com-
bustion engines, it is believed that it will take 5–10 more years of research before
HCCI systems become a practical reality.
7099_C007.fm Page 192 Monday, July 24, 2006 2:54 PM
© 2007 by Taylor & Francis Group, LLC
Mobile Sources and Control Approaches
193
ICE EMISSION-CONTROL OPTIONS
The two major approaches to minimizing emissions from ICEs are through changing
the operating conditions or through changing the design of the engine itself. These
options both function apart from changes in fuels composition.
The former approaches have received significant attention trying to minimize
emissions before back-end, or tailpipe, control technologies.
E
FFECTS
OF
O
PERATING
C
ONDITIONS
The single most important effect on combustion emissions is caused by the air-to-
fuel ratio. Figure 4.5, seen earlier, is an illustration of pollutant concentrations versus
air-to-fuel ratio for gasoline combustion. The
equivalence ratio
is the relationship
between the fuel-to-air ratio of the operating system and the fuel-to-air ratio at
stoichiometric, or ideal, conditions. An equivalence ratio less than 1.0 indicates lean
conditions (excess air). An equivalence ratio greater than 1.0 indicates fuel-rich
conditions.
In fuel-rich regions, hydrocarbon and CO emissions tend to predominate and
reach their minimum on the slightly lean side of the stoichiometric ratio. Oxides of
nitrogen tend to peak just on the lean (excess air) side of stoichiometric mixtures.
It should be noted that at very high air-to-fuel ratios, CO and hydrocarbons again
increase as a result of the temperature-quenching effect of excess air.
Thus, there is a “balancing act” performed between combustion controls for NO
x
and those for hydrocarbons/CO. The maximum combustion temperature curve is
similar to the NO
x
curve. Thermal NO
x
emissions are highly temperature dependent.
SPARK TIMING
For spark-ignited ICEs, the influences of changing the spark timing may be signif-
icant. If the spark timing is advanced, overall temperatures during the cycle tend to
go up, and NO
x
concentrations will therefore increase. Advancing the spark means
that the spark occurs earlier than normal during the compression cycle. Retarding
the spark tends to lower oxides of nitrogen but may only marginally reduce hydro-
carbon emissions. The effect of spark timing and equivalence ratio is seen in Figure
7.9 on oxides of nitrogen concentrations.
COMPRESSION RATIO
The effect of compression ratio will significantly increase both oxides of nitrogen
and hydrocarbons in direct proportion. Figure 7.10 shows the hydrocarbon concentra-
tions as a function of compression over a range of equivalence ratios. In Figure 7.11,
the influence of compression on oxides of nitrogen concentrations is apparent. The
effect is directly proportional to increasing compression ratios.
The major effect on NO
x
is in the excess air or lean regions. For hydrocarbons,
the effect is “across the board.” The hydrocarbon trend is reflective of the variation
in thickness of the quench zone or boundary layer in which fuel gases are contained.
7099_C007.fm Page 193 Monday, July 24, 2006 2:54 PM
© 2007 by Taylor & Francis Group, LLC
194 Principles of Air Quality Management, Second Edition
At higher compression ratios, a greater quantity of fuel would exist in the
boundary layer and would therefore be exhausted with the exhaust stroke. The effect
on oxides of nitrogen is clearly one of increased temperatures in the chamber with
increasing pressurization.
ENGINE SPEED
The effect of engine speed, or revolutions per minute, on emissions is variable. An
increase in engine speed tends to reduce hydrocarbon concentrations as a result of
an increase in turbulence in the combustion chamber. Thus, a greater percentage of
the hydrocarbon fuel fractions near engine surfaces become entrained in the bulk
gases and are burned. Likewise, exhaust gas temperatures are increased with speed,
which promotes further combustion and reductions of CO and hydrocarbons (if the
mixture is lean). This effect, however, causes chamber temperatures to increase, and
oxides of nitrogen concentrations therefore also increase with engine speed.
ENGINE POWER
The effect of engine power output is a direct function of the amount of fuel being
injected into the cylinder. Therefore, the effect of power changes the fuel-to-air ratio.
As power is increased, the fuel mass increases through the engine and the air-to-fuel
FIGURE 7.9 Effect of spark timing and mixture ratio on NO emissions.
0.6
0.5
0.4
0.3
0.2
0.1
Nitric oxide concentration – percent
0.8 0.9 1.0 1.1 1.2 1.3
Lean Rich
Equivalence ratio (mixture strength)
40° BTC
30°
20°
2500 RPM
V-8 engine
26" Hg. man.
10°
T.C
7099_C007.fm Page 194 Monday, July 24, 2006 2:54 PM
© 2007 by Taylor & Francis Group, LLC
Mobile Sources and Control Approaches 195
ratio decreases. This tends to increase both hydrocarbons and CO. Because of the
higher temperatures resulting from the increased amounts of fuel, NO
x
concentra-
tions increase with load until a rich condition occurs (as under high acceleration
demands). At that point, NO
x
begins to decrease.
ENGINE TEMPERATURES
Overall engine temperatures, as measured by the temperature of the cylinder surface
walls, also have an influence. Operating in hot ambient air or operating in conditions
that cause the engine coolant temperature to increase would increase oxides of
nitrogen and decrease hydrocarbons. In one experiment, an increase of the engine
surface temperature by 75˚F of generated a 73% increase in overall NO
x
emissions.
In another experiment, an increase in coolant temperature of 100˚F decreased hydro-
carbon emissions by one third.
ENGINE CLEANLINESS
As mentioned earlier, the effect of deposits will significantly affect carbon gas
emissions. Therefore, a cleaner or newer engine will have a positive effect by
lowering carbon gas emissions. Deposits serve as “sponges” for fuel fragments
(hydrocarbons), which are emitted later in the cycle. In contrast, cleaner engines are
responsible for higher temperatures and higher NO
x
emissions result.
FIGURE 7.10 Influence of compression ratio and mixture ratio on hydrocarbons.
600
500
400
300
200
100
0
Hydrocarbon, concentration–PPM (as C
6
H
14
)
0.8 1.0 1.2 1.4 1.6
Lean Rich
Equivalence ratio (mixture strength)
Comp.
Ratio
9 : 1
7 : 1
5 : 1
Manifold injection
spark 48° BTC
1800 RPM
7099_C007.fm Page 195 Monday, July 24, 2006 2:54 PM
© 2007 by Taylor & Francis Group, LLC
196 Principles of Air Quality Management, Second Edition
DESIGN INFLUENCES ON ICES
Engine design changes modify the combustion process, which has an effect on air
contaminant emissions. By lowering the surface-to-volume ratio of the combustion
chamber, more of the hydrocarbons will be in the bulk gas, and therefore, the
combustion will be more complete. Thus, designing the combustion chamber to
reduce this ratio to as low as possible (considering cost, design, feasibility, and
reliability) will improve combustion and lower emissions of hydrocarbons.
The influences of exhaust back pressure and valve overlap affect hydrocarbons
and NO
x
emissions by influencing the amount of exhaust gases remaining in the
cylinder following combustion. Increasing engine back pressure and overlapping the
valve timing will cause a greater quantity of the last stroke’s gases to be retained in
the cylinder. This causes the oxides of nitrogen to decrease as a result of lower
temperatures (a function of the greater quantity of residual noncombustibles) and a
lower air-to-fuel ratio. Hydrocarbon emissions tend to increase, however, as the air-
to-fuel ratio is reduced.
A similar approach, but one that is much less complex than using back pressure
and valve timing, is the inclusion of an exhaust gas recirculation system. The recircu-
lation of exhaust gas significantly lowers oxides of nitrogen emissions but causes only
minimal changes in CO and hydrocarbons. This is a result of the lower gas temperature
(from higher inert gas concentrations) and the lower oxygen content of the mixture.
FIGURE 7.11 Influence of compression ratio (C.R.) and mixture ratio on nitric oxide.
Lean Rich
0.6
0.5
0.4
0.3
0.2
0.1
Nitric oxide concentration–percent
0.8 0.9 1.0 1.1 1.2 1.3
Equivalence ratio (mixture strength)
12.0 C.R.
9.5
6.7
Man. press. 29" Hg.
spark 15° BTC
speed 1500 RPM
7099_C007.fm Page 196 Monday, July 24, 2006 2:54 PM
© 2007 by Taylor & Francis Group, LLC
Mobile Sources and Control Approaches 197
Exhaust gas is recirculated back into the combustion air intake manifold by a
control valve. It has been found that a 5% gas recirculation may reduce uncontrolled
NO
x
emissions by more than 50%, depending on other engine parameters. A 15%
recirculation may cause controlled NO
x
emission reductions of more than 75%.
Above this percent recirculation, CO and hydrocarbon emission tend to increase.
This approach is nominal in cost and complexity. At full-load conditions, or maxi-
mum acceleration, exhaust gas recirculation is bypassed because of the increased
power requirements and the lower air-to-fuel ratios caused by heavy acceleration.
Fuel injection lowers hydrocarbon emissions by allowing more precise fuel
control, particularly under cold start conditions and deceleration. This reduces the
need for fuel enrichment during start-up and load change as compared to carbureted
fuel systems.
Computerized engine controls (mandated in 1996 for all U.S. automobiles),
coupled with on-board diagnostic systems, provide for optimized operation of the
combustion process because of fuel-to-air control, spark timing, and enhanced con-
trol settings for engine control devices, such as exhaust gas recirculation valving.
This optimization minimizes hydrocarbon and CO emissions as well as oxides of
nitrogen.
TWO-STAGE COMBUSTION
Without totally redesigning the ICE, it is possible to take advantage of certain aspects
of the air-to-fuel emission curves such that low NO
x
emissions (characteristic of a
fuel-rich mixture) can be coupled with the low hydrocarbon and CO emissions in
the excess air regions of the fuel-to-air ratio. This has led to the redesign of the top
of the cylinder such that the combustion chamber consists of two parts. Figure 7.12
illustrates this two-stage combustion engine, also called a stratified charge.
FIGURE 7.12 Stratified charge engine.
Exhaust
valve
Rich mixture
intake
Precombustion
chamber
ird valve
Plug
Lean mixture
intake
Intake valve
Piston
7099_C007.fm Page 197 Monday, July 24, 2006 2:54 PM
© 2007 by Taylor & Francis Group, LLC
198 Principles of Air Quality Management, Second Edition
In this system, the combustion takes place in two phases. There is a fuel-rich
chamber on the top and a fuel-lean portion in the cylinder itself. In the fuel-rich
combustion chamber, from 40%–70% of the combustion air is supplied along with
the full charge of fuel. In this fuel-rich combustion, very low oxides of nitrogen are
formed; however, large quantities of carbon monoxide, PICs, and fuel fragments
occur. The rich, hot combustion gases then pass through a restricted opening into the
lean portion of the cylinder.
In the lean portion of the process, the balance of the required air is supplied,
which causes the overall combustion process to operate in the lean fuel-to-air regions
such that burnout is completed. The exhaust gases then drive the piston down,
providing power to the system. CO and hydrocarbons are consumed, and the oxides
of nitrogen are minimized as a result of operation at higher excess air.
EXTERNAL CONTROL APPROACHES
The original approach to automotive emissions control was to literally hang a control
device on the tailpipe or other source of fugitive emissions. This approach has given
way to a combination of options, including engine redesign, engine operations, and
fuel composition changes, along with control devices. As more research is performed
to accurately gauge emissions from tailpipes and fugitive sources, pollution control
devices will both remain and be enhanced in their effectiveness.
FUEL RECAPTURE SYSTEMS
Evaporative emission controls are fairly simple and inexpensive, as they consist of
an activated carbon adsorption unit with ducting from the sources of evaporative
emissions (fuel tank) to the adsorber.
Emissions of hydrocarbons during displacement by refueling have been addressed
by stage II vapor recovery systems at gasoline-dispensing facilities. These systems
include the “rubber boot” and the vapor-return line, which draws gasoline vapors
back into the storage tank. Spillage is minimized by an interlock system, which senses
a slug of liquid entering the vapor line and stops the flow of fuel into the tank.
Activated charcoal canisters to collect fuel transfer emissions, in addition to
vapor recovery, are mandated by the Clean Air Act. A “bottom fill pipe” on older
models serves to eliminate the splashing and frothing action during filling that
increased hydrocarbon emissions.
Blowby gases coming from the engine are typically recirculated back into the
combustion air intake and serve to return hydrocarbons to the combustion chamber.
CATALYST SYSTEMS
Thermal oxidizers were the first attempt to deal with hydrocarbon and CO emissions.
These devices were large, insulated chambers with baffles that, to operate, were
raised to temperatures between 800˚C and 900˚C. These units were effective provided
7099_C007.fm Page 198 Monday, July 24, 2006 2:54 PM
© 2007 by Taylor & Francis Group, LLC
Mobile Sources and Control Approaches 199
that an additional air flow of 20–30% of the stoichiometric air flow was provided
by an air pump. Exhaust gases that are operated at overall lean conditions showed
a much lower efficiency. The key benefit of thermal systems is that they are not
“poisoned” by lead, sulfur, or phosphorus contaminants in the exhaust.
Catalyst-based systems are currently tasked with the requirement of significantly
reducing hydrocarbon, CO, and NO
x
emissions under varying modes of operation.
These come in two types: the oxidizing system and the dual-stage system of catalysts.
The first attempt was the oxidative single-stage system, which dealt with hydro-
carbons and CO. These single-stage systems were typically high–surface area car-
tridges containing a noble metal catalyst. Being catalytic, they could operate at lower
temperatures than incinerators and still produce significant reductions in both CO
and hydrocarbons.
The function of the catalyst, using materials such as platinum and palladium, is
to lower the activation energy required to oxidize the fuel and CO to CO
2
. By
lowering the activation energy (Figure 4.4, seen earlier), a lower temperature is
required; however, the requirement for oxygen still remains.
An exhaust gas high in CO or hydrocarbons (such as from a cold start or high
acceleration) has poor conversion efficiency, as oxygen or air-injection systems are
required. In stoichiometric or lean conditions, the catalyst may work without an air
pump for CO and hydrocarbon control. Potential problems with oxidizing catalysts
are that they may be sensitive to poisoning by other trace elements in the fuel or
exhaust gases and, second, that all fuel elements will be fully oxidized. These may
form materials such as sulfur dioxide and sulfuric acid aerosol. Oxides of nitrogen
were not addressed in oxidizing or single-bed catalytic converters.
Two-stage or dual-bed catalytic systems attempt to get around the problem of
oxides of nitrogen emissions by providing a second stage. In these systems, the oxides
of nitrogen are eliminated first by operation of a catalyst under fuel-rich conditions
such that reducing gases, such as hydrogen, CO, and fuel fragments combine with
NO to produce molecular nitrogen (N
2
), plus some additional CO
2
. As the exhaust
gases pass over to the oxidation bed, additional air is injected to complete the
oxidation of CO and hydrocarbon fragments. As a result, the dual-bed systems are
larger, heavier, and more expensive than the single-bed systems. Other concerns
are for lowered fuel economy, as the engines must be run in a fuel-rich condition.
Problems with a dual-bed system include potential poisoning of the catalysts as
a result of the presence of other elements. Also, ammonia may be produced in the
first stage and will then be more easily oxidized to NO
x
in the second stage, should
the reducing conditions of the first stage be too efficient. Another problem is that
catalytic systems only heat up after several minutes of operation. Therefore, the bulk
of those emissions tends to be emitted initially without being affected, because the
catalyst is not up to temperature.
Table 7.5 lists the typical emissions from a three-way catalyst-equipped vehicle.
The three ways, of course, refer to the CO, NO
x
, and hydrocarbon emissions
addressed by these systems. The catalysts are still packaged in two-stage operating
units.
7099_C007.fm Page 199 Monday, July 24, 2006 2:54 PM
© 2007 by Taylor & Francis Group, LLC
200 Principles of Air Quality Management, Second Edition
DIESEL PARTICULATE CONTROLS
For diesel fueled systems, major concerns have existed about the carbonaceous soot
or particulate emissions commonly associated with such compression ignition sys-
tems. Therefore, attempts to provide better emissions control for diesel systems have
focused on the diesel particulate trap.
Soot particulates may be emitted at rates of 0.1%–0.5% of the total fuel input
mass by weight. Because of the low density and small size of carbonaceous soot,
regular filters are not appropriate, as they plug quickly. So, two different approaches
have been tried for the diesel particulate controls. These include oxidizing ceramic
packing filters, which attempt to burn off the carbonaceous soot during operations,
or change-out filters, which must be periodically regenerated. Research is continuing
on such diesel particulate filter systems.
Eventually, all catalyst systems may be heated before the start of the engine, as
engines under cold start conditions emit a high level of air contamination. Other
possibilities are to mount the catalyst very close to the engine such that radiative
cooling will be minimized. Regeneration of the catalysts with hydrogen is on the
horizon, and thus catalyst trade out or replacement will become another tool in
emissions reduction.
FUEL CHANGE EFFECTS
Because combustion in internal engines is kinetically driven, the composition of the
fuels will significantly affect the emissions. The major benefit of fuel changes is
that all vehicles on the road would be using lower-emission gasolines or diesel fuel;
therefore, emissions improvements would begin immediately rather than over a
5–10-year period for replacement by newer, lower-emitting engines.
TABLE 7.5
Typical Gasoline Exhaust Emissions
Pollutant Emissions (gm/km)*
Total hydrocarbons 0.14
Oxides of nitrogen, total 0.38
NO 0.35
N
2
O 0.031
NO
2
0.005
Carbon monoxide 1.8
Toxics, total 0.0094
Benzene 0.0069
1,3 butadiene 0.00052
Formaldehyde 0.0011
Acetaldehyde 0.00077
* Three-way catalyst vehicles.
7099_C007.fm Page 200 Monday, July 24, 2006 2:54 PM
© 2007 by Taylor & Francis Group, LLC
Mobile Sources and Control Approaches 201
In general, fuel changes have been required to lower the volatility and evapora-
tion rate of the fuel and to provide cleaner-burning gasolines that will lower engine
deposits. A more recent emphasis has been to lower air toxic emissions (such as
benzene) and to lower the percentages of those components of gasoline that are
photochemically reactive (those that promote greater ozone production per unit
mass). Figure 7.13 indicates the photochemical oxidation potentials for different
classes of organic compounds that contribute to such photochemical ozone production.
In recent research programs, the effects of changing the compositions of five
different fuel parameters (olefins, aromatics, 90% distillation temperature, percent-
age sulfur and oxygenates) were measured on the exhaust emission species. The
exhaust emission species were nonmethane hydrocarbons, carbon monoxide, NO
x
,
benzene, 1-3, butadiene (1,3 Bd), formaldehyde (HCHO), and acetaldehyde (C
2
H
4
O).
The effects of reducing olefin content from an average of approximately 20%
in the test gasoline to 5% resulted in the emissions changes noted in Figure 7.14.
In this study, no significant changes were found in CO, formaldehyde, acetaldehyde,
FIGURE 7.13 Hydrocarbon reactivity as indicated by the rate at which NO is oxidized.
Disub. internal olefins
Cyclopentenes
Monosub. internal olefins
Unsub. internal olefins
Cyclohexenes
Tri- & tetraalkylbenzenes
Diolefins
Dialkylbenzenes
Te rminal olefins
Class 6
Class 5
Class 4
Class 3
Class 2
Class 1
Mono-
alkyl-
benzenes
C
4
+
paraffins
Propane
2,2-dimethylpropane
Ethane
Methane
Benzene
100.0
50.0
10.0
5.0
1.0
0.5
0.1
Photooxidation (ppb/min)
7099_C007.fm Page 201 Monday, July 24, 2006 2:54 PM
© 2007 by Taylor & Francis Group, LLC
202 Principles of Air Quality Management, Second Edition
or benzene, but the 1,3 butadiene fractions were reduced by approximately one-
third. In addition, oxides of nitrogen had a slight reduction of about 6%. The overall
total mass of nonmethane hydrocarbons (primarily fuel fragments) increased by
approximately 7%. Thus, reducing overall olefin content of gasoline could provide
some decreases in ozone potential by virtue of the 1,3 butadiene emission decreases.
Reductions of the aromatic content from 45% to 20% led to dramatic decreases
in benzene (45% reduction), CO, and nonmethane hydrocarbons (at about 12% each),
with no significant increases in NO
x
. Although effective in reducing the above,
however, this fuel change resulted in emission increases of formaldehyde, acetalde-
hyde, and the ozone-forming 1,3 butadiene.
Reducing the “high boiling fractions” (T
90
= 90% distillation temperature) in
gasoline, as seen in Figure 7.15, produced significant reductions in all carbon species
except for CO, which showed no significant change. Oxides of nitrogen showed a
nominal increase of about 5%. This change was accomplished by reducing the
boiling point of the 90th percentile fractions of gasoline from 360˚F to 280˚F.
Probably the most significant emission reductions are a result of lowering the
average fuel sulfur content from 450 to 50 ppm, as seen in Figure 7.15. In this
experiment, all contaminant emissions were reduced significantly except for 1,3
butadiene, which showed no effect, and formaldehyde, which showed a 45% increase.
The purpose of adding oxygenated compounds (ethanol) to gasoline is to force
lower CO emissions. The addition of oxygenated fuel components to gasoline also
helps to provide better “anti-knock” characteristics to engine performance.
Figure 7.16 indicates the change in emissions by using a 15% oxygenated
gasoline. No significant changes were found in oxides of nitrogen, benzene, or
acetaldehyde. Reductions of CO and nonmethane hydrocarbons were found, as well
as reductions in 1,3 butadiene. Formaldehyde emissions, however, increased by
approximately 27%.
FIGURE 7.14 Fuel change effects, olefin and aromatic HC reductions.
20
CO
NO
x
Benzene 1,3Bd HCHO C
2
H
4
O
10
0
−10
−20
−30
−40
−50
% C
h
ange
Olefin and Aromatic HC Reductions
NMHC
Aromatics
Olefins
7099_C007.fm Page 202 Monday, July 24, 2006 2:54 PM
© 2007 by Taylor & Francis Group, LLC
Mobile Sources and Control Approaches 203
As a result of recent research, California has mandated the gasoline composition
requirements seen in Table 7.6 for 2006. Significant among these are changes in the
overall average composition of the fuel. Note that the fuel sulfur content must now
average 15 ppm. Should other states opt into the “California approach,” these fuel
requirements could become more widely spread.
FIGURE 7.15 Fuel change effects, T
90
and sulfur reductions.
FIGURE 7.16 Fuel change effects, 15% oxygenated compound addition.
0
10
20
30
40
50
NMHC CO NO
x
Benzene
HCHO
−10
−20
−30
−40
% C
h
ange
1,3Bd
C
2
H
4
O
T
90
and Sulfur Reductions
T
90
Sulfur
NMHC
CO
NO
x
1,3Bd
Oxygenates
−20
−10
0
10
20
30
% C
h
ange
15% Oxygenate
d
Compoun
d
A
dd
ition
Benzene
HCHO
C
2
H
4
O
7099_C007.fm Page 203 Monday, July 24, 2006 2:54 PM
© 2007 by Taylor & Francis Group, LLC