Image Processing for Remote Sensing - Chapter 1 ppsx
Bạn đang xem bản rút gọn của tài liệu. Xem và tải ngay bản đầy đủ của tài liệu tại đây (8.08 MB, 51 trang )
Image
Processing
forRemote
Sensing
C.H. Chen/Image Processing for Remote Sensing 66641_C000 Final Proof page i 12.9.2007 3:20pm Compositor Name: JGanesan
© 2008 by Taylor & Francis Group, LLC
Image
Processing
forRemote
Sensing
Editedby
C.H.Chen
CRC Press is an imprint of the
Taylor & Francis Group, an informa business
Boca Raton London New York
C.H. Chen/Image Processing for Remote Sensing 66641_C000 Final Proof page iii 12.9.2007 3:20pm Compositor Name: JGanesan
© 2008 by Taylor & Francis Group, LLC
The material was previously published in Signal and Image Processing for Remote Sensing © Taylor and Francis 2006.
CRC Press
Taylor & Francis Group
6000 Broken Sound Parkway NW, Suite 300
Boca Raton, FL 33487-2742
© 2008 by Taylor & Francis Group, LLC
CRC Press is an imprint of Taylor & Francis Group, an Informa business
No claim to original U.S. Government works
Printed in the United States of America on acid-free paper
10 9 8 7 6 5 4 3 2 1
International Standard Book Number-13: 978-1-4200-6664-7 (Hardcover)
This book contains information obtained from authentic and highly regarded sources. Reprinted material is quoted
with permission, and sources are indicated. A wide variety of references are listed. Reasonable efforts have been made to
publish reliable data and information, but the author and the publisher cannot assume responsibility for the validity of
all materials or for the consequences of their use.
Except as permitted under U.S. Copyright Law, no part of this book may be reprinted, reproduced, transmitted, or uti-
lized in any form by any electronic, mechanical, or other means, now known or hereafter invented, including photocopy-
ing, microfilming, and recording, or in any information storage or retrieval system, without written permission from the
publishers.
For permission to photocopy or use material electronically from this work, please access www.copyright.com (http://
www.copyright.com/) or contact the Copyright Clearance Center, Inc. (CCC) 222 Rosewood Drive, Danvers, MA 01923,
978-750-8400. CCC is a not-for-profit organization that provides licenses and registration for a variety of users. For orga-
nizations that have been granted a photocopy license by the CCC, a separate system of payment has been arranged.
Trademark Notice: Product or corporate names may be trademarks or registered trademarks, and are used only for
identification and explanation without intent to infringe.
Library of Congress Cataloging-in-Publication Data
Image processing for remote sensing / [edited by] C.H. Chen.
p. cm.
Includes bibliographical references and index.
ISBN-13: 978-1-4200-6664-7
ISBN-10: 1-4200-6664-1
1. Remote sensing Data processing. 2. Image processing. I. Chen, C.H. (Chi-hau), 1937- II. Title.
G70.4.I44 2008
621.36’78 dc22 2007030188
Visit the Taylor & Francis Web site at
and the CRC Press Web site at
C.H. Chen/Image Processing for Remote Sensing 66641_C000 Final Proof page iv 12.9.2007 3:20pm Compositor Name: JGanesan
© 2008 by Taylor & Francis Group, LLC
Preface
This volume is a spin-off edition derived from Signal and Image Processing for Remote
Sensing. It presents more advanced topics of image processing in remote sensing than
similar books in the area. The topics of image modeling, statistical image classifiers,
change detection, independent component analysis, vertex component analysis, image
fusion for better classification or segmentation, 2-D time series modeling, neural network
classifications, etc. are examined in this volume. Some unique topics like accuracy assess-
ment and information-theoretic measure of multiband images are presented. An em-
phasis is placed on the issues with synthetic aperture radar (SAR) images in many
chapters. Continued development on imaging sensors always presents new opportunities
and challenges on image processing for remote sensing. The hyperspectral imaging
sensor is a good example here. We believe this volume not only presents the most up-
to-date developments of image processing for remote sensing but also suggests to readers
the many challenging problems ahead for further study.
Original Preface from Signal and Image Processing for Remote Sensing
Both signal processing and image processing have been playing increasingly important
roles in remote sensing. While most data from satellites are in image forms and thus
image processing has been used most often, signal processing can contribute significantly
in extracting information from the remotely sensed waveforms or time series data. In
contrast to other books in this field which deal almost exclusively with the image
processing for remote sensing, this book provides a good balance between the roles of
signal processing and image processing in remote sensing. The book covers mainly
methodologies of signal processing and image processing in remote sensing. Emphasis
is thus placed on the mathematical techniques which we believe will be less changed as
compared to sensor, software and hardware technologies. Furthermore, the term ‘‘remote
sensing’’ is not limited to the problems with data from satellite sensors. Other sensors
which acquire data remotely are also considered. Thus another unique feature of the book
is the coverage of a broader scope of the remote sensing information processing problems
than any other book in the area.
The book is divided into two parts [now published as separate volumes under the
following titles]. Part I, Signal Processing for Remote Sensing, has 12 chapters and Part II
[comprising the present volume], Image Processing for Remote Sensing, has 16 chapters. The
chapters are written by leaders in the field. We are very fortunate, for example, to have
Dr. Norden Huang, inventor of the Huang–Hilbert transform, along with Dr. Steven
Long, to write a chapter on the application of the transform to remote sensing problem,
and Dr. Enders A. Robinson, who has made many major contributions to geophysical
signal processing for over half a century, to write a chapter on the basic problem of
constructing seismic images by ray tracing.
In Part I, following Chapter 1 by Drs. Long and Huang, and my short Chapter 2 on the
roles of statistical pattern recognition and statistical signal processing in remote sensing,
we start from a very low end of the electromagnetic spectrum. Chapter 3 considers the
classification of infrasound at a frequency range of 0.001 Hz to 10 Hz by using a parallel
bank neural network classifier and a 11-step feature selection process. The >90% correct
classification rate is impressive for this kind of remote sensing data. Chapter 4 through
C.H. Chen/Image Processing for Remote Sensing 66641_C000 Final Proof page v 12.9.2007 3:20pm Compositor Name: JGanesan
© 2008 by Taylor & Francis Group, LLC
Chapter 6 deal with seismic signal processing. Chapter 4 provides excellent physical
insights on the steps for construction of digital seismic images. Even though the seismic
image is an image, this chapter is placed in Part I as seismic signals start as waveforms.
Chapter 5 considers the singular value decomposition of a matrix data set from scalar-
sensors arrays, which is followed by independent component analysis (ICA) step to relax
the unjustified orthogonality constraint for the propagation vectors by imposing a
stronger constraint of fourth-order independence of the estimated waves. With an initial
focus of the use of ICA in seismic data and inspired by Dr. Robinson’s lecture on seismic
deconvolution at the 4th International Symposium, 2002, on Computer Aided Seismic
Analysis and Discrimination, Mr. Zhenhai Wang has examined approaches beyond ICA
for improving seismic images. Chapter 6 is an effort to show that factor analysis, as an
alternative to stacking, can play a useful role in removing some unwanted components in
the data and thereby enhancing the subsurface structure as shown in the seismic images.
Chapter 7 on Kalman filtering for improving detection of landmines using electromag-
netic signals, which experience severe interference, is another remote sensing problem of
higher interest in recent years. Chapter 8 is a representative time series analysis problem
on using meteorological and remote sensing indices to monitor vegetation moisture
dynamics. Chapter 9 actually deals with the image data for digital elevation model but
is placed in Part I mainly because the prediction error (PE) filter is originated from the
geophysical signal processing. The PE filter allows us to interpolate the missing parts of
an image. The only chapter that deals with the sonar data is Chapter 10, which shows that
a simple blind source separation algorithm based on the second-order statistics can be
very effective to remove reverberations in active sonar data. Chapter 11 and Chapter 12
are excellent examples of using neural networks for retrieval of physical parameters from
the remote sensing data. Chapter 12 further provides a link between signal and image
processing as the principal component analysis and image sharpening tools employed are
exactly what are needed in Part II.
With a focus on image processing of remote sensing images, Part II begins with Chapter
13 [Chapter 1 of the present volume] that is concerned with the physics and mathematical
algorithms for determining the ocean surface parameters from synthetic aperture radar
(SAR) images. Mathematically Markov random field (MRF) is one of the most useful
models for the rich contextual information in an image. Chapter 14 [now Chapter 2]
provides a comprehensive treatment of MRF-based remote sensing image classification.
Besides an overview of previous work, the chapter describes the methodological issues
involved and presents results of the application of the technique to the classification of
real (both single-date and multitemporal) remote sensing images. Although there are
many studies on using an ensemble of classifiers to improve the overall classification
performance, the random forest machine learning method for classification of hyperspec-
tral and multisource data as presented in Chapter 15 [now Chapter 3] is an excellent
example of using new statistical approaches for improved classification with the remote
sensing data. Chapter 16 [now Chapter 4] presents another machine learning method,
AdaBoost, to obtain robustness property in the classifier. The chapter further considers
the relations among the contextual classifier, MRF-based methods, and spatial boosting.
The following two chapters are concerned with different aspects of the change detection
problem. Change detection is a uniquely important problem in remote sensing as the
images acquired at different times over the same geographical area can be used in the
areas of environmental monitoring, damage management, and so on. After discussing
change detection methods for multitemporal SAR images, Chapter 17 [now Chapter 5]
examines an adaptive scale–driven technique for change detection in medium resolu-
tion SAR data. Chapter 18 [now Chapter 6] evaluates the Wiener filter-based method,
C.H. Chen/Image Processing for Remote Sensing 66641_C000 Final Proof page vi 12.9.2007 3:20pm Compositor Name: JGanesan
© 2008 by Taylor & Francis Group, LLC
Mahalanobis distance, and subspace projection methods of change detection, with the
change detection performance illustrated by receiver operating characteristics (ROC)
curves. In recent years, ICA and related approaches have presented many new potentials
in remote sensing information processing. A challenging task underlying many hyper-
spectral imagery applications is decomposing a mixed pixel into a collection of reflec-
tance spectra, called endmember signatures, and the corresponding abundance fractions.
Chapter 19 [now Chapter 7] presents a new method for unsupervised endmember
extraction called vertex component analysis (VCA). The VCA algorithms presented
have better or comparable performance as compared to two other techniques but require
less computational complexity. Other useful ICA applications in remote sensing include
feature extraction, and speckle reduction of SAR images. Chapter 20 [now Chapter 8]
presents two different methods of SAR image speckle reduction using ICA, both making
use of the FastICA algorithm. In two-dimensional time series modeling, Chapter 21 [now
Chapter 9] makes use of a fractionally integrated autoregressive moving average
(FARIMA) analysis to model the mean radial power spectral density of the sea SAR
imagery. Long-range dependence models are used in addition to the fractional sea surface
models for the simulation of the sea SAR image spectra at different sea states, with and
without oil slicks at low computational cost.
Returning to the image classification problem, Chapter 22 [now Chapter 10] deals with
the topics of pixel classification using Bayes classifier, region segmentation guided by
morphology and split-and-merge algorithm, region feature extraction, and region classi-
fication.
Chapter 23 [now Chapter 11] provides a tutorial presentation of different issues of data
fusion for remote sensing applications. Data fusion can improve classification and for the
decision level fusion strategies, four multisensor classifiers are presented. Beyond the
currently popular transform techniques, Chapter 24 [now Chapter 12] demonstrates that
Hermite transform can be very useful for noise reduction and image fusion in remote
sensing. The Hermite transform is an image representation model that mimics some of the
important properties of human visual perception, namely local orientation analysis and
the Gaussian derivative model of early vision. Chapter 25 [now Chapter 13] is another
chapter that demonstrates the importance of image fusion to improving sea ice classifi-
cation performance, using backpropagation trained neural network and linear discrimin-
ation analysis and texture features. Chapter 26 [now Chapter 14] is on the issue of
accuracy assessment for which the Bradley–Terry model is adopted. Chapter 27 [now
Chapter 15] is on land map classification using support vector machine, which has been
increasingly popular as an effective classifier. The land map classification classifies the
surface of the Earth into categories such as water area, forests, factories or cities. Finally,
with lossless data compression in mind, Chapter 28 [now Chapter 16] focuses on infor-
mation-theoretic measure of the quality of multi-band remotely sensed digital images.
The procedure relies on the estimation of parameters of the noise model. Results on image
sequences acquired by AVIRIS and ASTER imaging sensors offer an estimation of the
information contents of each spectral band.
With rapid technological advances in both sensor and processing technologies, a book
of this nature can only capture certain amount of current progress and results. However,
if past experience offers any indication, the numerous mathematical techniques presented
will give this volume a long lasting value.
The sister volumes of this book are the other two books edited by myself. One is
Information Processing for Remote Sensing and the other is Frontiers of Remote Sensing
Information Processing, both published by World Scientific in 1999 and 2003, respectively.
I am grateful to all contributors of this volume for their important contribution and,
C.H. Chen/Image Processing for Remote Sensing 66641_C000 Final Proof page vii 12.9.2007 3:20pm Compositor Name: JGanesan
© 2008 by Taylor & Francis Group, LLC
in particular, to Dr. J.S. Lee, S. Serpico, L. Bruzzone and S. Omatu for chapter contribu-
tions to all three volumes. Readers are advised to go over all three volumes for a more
complete information on signal and image processing for remote sensing.
C. H. Chen
C.H. Chen/Image Processing for Remote Sensing 66641_C000 Final Proof page viii 12.9.2007 3:20pm Compositor Name: JGanesan
© 2008 by Taylor & Francis Group, LLC
Editor
Chi Hau Chen was born on December 22nd, 1937. He received his Ph.D. in electrical
engineering from Purdue University in 1965, M.S.E.E. degree from the University of
Tennessee, Knoxville, in 1962, and B.S.E.E. degree from the National Taiwan University
in 1959.
He is currently chancellor professor of electrical and computer engineering at the
University of Massachusetts, Dartmouth, where he has taught since 1968. His research
areas are in statistical pattern recognition and signal/image processing with applications
to remote sensing, geophysical, underwater acoustics, and nondestructive testing prob-
lems, as well as computer vision for video surveillance, time series analysis, and neural
networks.
Dr. Chen has published 25 books in his area of research. He is the editor of Digital
Waveform Processing and Recognition (CRC Press, 1982) and Signal Processing Handbook
(Marcel Dekker, 1988). He is the chief editor of Handbook of Pattern Recognition and
Computer Vision, volumes 1, 2, and 3 (World Scientific Publishing, 1993, 1999, and 2005,
respectively). He is the editor of Fuzzy Logic and Neural Network Handbook (McGraw-Hill,
1966). In the area of remote sensing, he is the editor of Information Processing for Remote
Sensing and Frontiers of Remote Sensing Information Processing (World Scientific Publishing,
1999 and 2003, respectively).
He served as the associate editor of the IEEE Transactions on Acoustics Speech and Signal
Processing for 4 years, IEEE Transactions on Geoscience and Remote Sensing for 15 years, and
since 1986 he has been the associate editor of the International Journal of Pattern Recognition
and Artificial Intelligence.
Dr. Chen has been a fellow of the Institutue of Electrical and Electronic Engineers
(IEEE) since 1988, a life fellow of the IEEE since 2003, and a fellow of the International
Association of Pattern Recognition (IAPR) since 1996.
C.H. Chen/Image Processing for Remote Sensing 66641_C000 Final Proof page ix 12.9.2007 3:20pm Compositor Name: JGanesan
© 2008 by Taylor & Francis Group, LLC
Contributors
Bruno Aiazzi Institute of Applied Physics, National Research Council, Florence, Italy
Selim Aksoy Bilkent University, Ankara, Turkey
V.Yu. Alexandrov Nansen International Environmental and Remote Sensing
Center, St. Petersburg, Russia
Luciano Alparone Department of Electronics and Telecommunications, University
of Florence, Florence, Italy
Stefano Baronti Institute of Applied Physics, National Research Council, Florence,
Italy
Jon Atli Benediktsson Department of Electrical and Computer Engineering,
University of Iceland, Reykjavik, Iceland
Fabrizio Berizzi Department of Information Engineering, University of Pisa, Pisa, Italy
Massimo Bertacca ISL-ALTRAN, Analysis and Simulation Group—Radar Systems
Analysis and Signal Processing, Pisa, Italy
L.P. Bobylev Nansen International Environmental and Remote Sensing Center,
St. Petersburg, Russia
A.V. Bogdanov Institute for Neuroinformatich, Bochum, Germany
Francesca Bovolo Department of Information and Communication Technology,
University of Trento, Trento, Italy
Lorenzo Bruzzone Department of Information and Communication Technology,
University of Trento, Trento, Italy
Chi Hau Chen Department of Electrical and Computer Engineering, University of
Massachusetts Dartmouth, North Dartmouth, Massachusetts
Salim Chitroub Signal and Image Processing Laboratory, Department of Telecom-
munication, Algiers, Algeria
Jose
´
M.B. Dias Department of Electrical and Computer Engineering, Instituto
Superior Te
´
cnico, Av. Rovisco Pais, Lisbon, Portugal
Shinto Eguchi Institute of Statistical Mathematics, Tokyo, Japan
C.H. Chen/Image Processing for Remote Sensing 66641_C000 Final Proof page xi 12.9.2007 3:20pm Compositor Name: JGanesan
© 2008 by Taylor & Francis Group, LLC
Boris Escalante-Ramı
´
rez School of Engineering, National Autonomous University
of Mexico, Mexico City, Mexico
Toru Fujinaka Osaka Prefecture University, Osaka, Japan
Gerrit Gort Department of Biometris, Wageningen University, The Netherlands
Sveinn R. Joelsson Department of Electrical and Computer Engineering, University
of Iceland, Reykjavik, Iceland
O.M. Johannessen Nansen Environmental and Remote Sensing Center, Bergen,
Norway
Dayalan Kasilingam Department of Electrical and Computer Engineering, Univer-
sity of Massachusetts Dartmouth, North Dartmouth, Massachusetts
Heesung Kwon U.S. Army Research Laboratory, Adelphi, Maryland
Jong-Sen Lee Remote Sensing Division, Naval Research Laboratory, Washington, D.C.
Alejandra A. Lo
´
pez-Caloca Center for Geography and Geomatics Research, Mexico
City, Mexico
Arko Lucieer Centre for Spatial Information Science (CenSIS), University of Tas-
mania, Australia
Enzo Dalle Mese Department of Information Engineering, University of Pisa, Pisa,
Italy
Gabriele Moser Department of Biophysical and Electronic Engineering, University
of Genoa, Genoa, Italy
Jose
´
M.P. Nascimento Instituto Superior, de Eugenharia de Lisbon, Lisbon, Portugal
Nasser Nasrabadi U.S. Army Research Laboratory, Adelphi, Maryland
Ryuei Nishii Faculty of Mathematics, Kyusyu University, Fukuoka, Japan
Sigeru Omatu Osaka Prefecture University, Osaka, Japan
S. Sandven Nansen Environmental and Remote Sensing Center, Bergen, Norway
Dale L. Schuler Remote Sensing Division, Naval Research Laboratory, Washington,
D.C.
Massimo Selva Institute of Applied Physics, National Research Council, Florence,
Italy
C.H. Chen/Image Processing for Remote Sensing 66641_C000 Final Proof page xii 12.9.2007 3:20pm Compositor Name: JGanesan
© 2008 by Taylor & Francis Group, LLC
Sebastiano B. Serpico Department of Biophysical and Electronic Engineering,
University of Genoa, Genoa, Italy
Anne H.S. Solberg Department of Informatics, University of Oslo and Norwegian
Computing Center, Oslo, Norway
Alfred Stein International Institute for Geo-Information Science and Earth Obser-
vation, Enschede, The Netherlands
Johannes R. Sveinsson Department of Electrical and Computer Engineering,
University of Iceland, Reykjavik, Iceland
Maria Tates U.S. Army Research Laboratory, Adelphi, Maryland, and Morgan State
University, Baltimore, Maryland
Xianju Wang Department of Electrical and Computer Engineering, University of
Massachusetts Dartmouth, North Dartmouth, Massachusetts
Carl White Morgan State University, Baltimore, Maryland
Michifumi Yoshioka Osaka Prefecture University, Osaka, Japan
C.H. Chen/Image Processing for Remote Sensing 66641_C000 Final Proof page xiii 12.9.2007 3:20pm Compositor Name: JGanesan
© 2008 by Taylor & Francis Group, LLC
Contents
1. Polarimetric SAR Techniques for Remote Sensing of the Ocean Surface 1
Dale L. Schuler, Jong-Sen Lee, and Dayalan Kasilingam
2. MRF-Based Remote-Sensing Image Classification with
Automatic Model Parameter Estimation 39
Sebastiano B. Serpico and Gabriele Moser
3. Random Forest Classification of Remote Sensing Data 61
Sveinn R. Joelsson, Jon Atli Benediktsson, and Johannes R. Sveinsson
4. Supervised Image Classification of Multi-Spectral Images
Based on Statistical Machine Learning 79
Ryuei Nishii and Shinto Eguchi
5. Unsupervised Change Detection in Multi-Temporal SAR Images 107
Lorenzo Bruzzone and Francesca Bovolo
6. Change-Detection Methods for Location of Mines in SAR Imagery 135
Maria Tates, Nasser Nasrabadi, Heesung Kwon, and Carl White
7. Vertex Component Analysis: A Geometric-Based
Approach to Unmix Hyperspectral Data 149
Jose
´
M.B. Dias and Jose
´
M.P. Nascimento
8. Two ICA Approaches for SAR Image Enhancement 175
Chi Hau Chen, Xianju Wang, and Salim Chitroub
9. Long-Range Dependence Models for the Analysis and
Discrimination of Sea-Surface Anomalies in Sea SAR Imagery 189
Massimo Bertacca, Fabrizio Berizzi, and Enzo Dalle Mese
10. Spatial Techniques for Image Classification 225
Selim Aksoy
11. Data Fusion for Remote-Sensing Applications 249
Anne H.S. Solberg
12. The Hermite Transform: An Efficient Tool for Noise Reduction
and Image Fusion in Remote-Sensing 273
Boris Escalante-Ramı
´
rez and Alejandra A. Lo
´
pez-Caloca
13. Multi-Sensor Approach to Automated Classification of Sea Ice Image Data 293
A.V. Bogdanov, S. Sandven, O.M. Johannessen, V.Yu. Alexandrov, and L.P. Bobylev
C.H. Chen/Image Processing for Remote Sensing 66641_C000 Final Proof page xv 12.9.2007 3:20pm Compositor Name: JGanesan
© 2008 by Taylor & Francis Group, LLC
14. Use of the Bradley–Terry Model to Assess Uncertainty in an
Error Matrix from a Hierarchical Segmentation of an ASTER Image 325
Alfred Stein, Gerrit Gort, and Arko Lucieer
15. SAR Image Classification by Support Vector Machine 341
Michifumi Yoshioka, Toru Fujinaka, and Sigeru Omatu
16. Quality Assessment of Remote-Sensing Multi-Band Optical Images 355
Bruno Aiazzi, Luciano Alparone, Stefano Baronti, and Massimo Selva
C.H. Chen/Image Processing for Remote Sensing 66641_C000 Final Proof page xvi 12.9.2007 3:20pm Compositor Name: JGanesan
© 2008 by Taylor & Francis Group, LLC
1
Polarimetric SAR Techniques for Remote
Sensing of the Ocean Surface
Dale L. Schuler, Jong-Sen Lee, and Dayalan Kasilingam
CONTENTS
1.1 Introduction 2
1.2 Measurement of Directional Slopes and Wave Spectra 2
1.2.1 Single Polarization versus Fully Polarimetric SAR Techniques 2
1.2.2 Single-Polarization SAR Measurements of Ocean Surface Properties 3
1.2.3 Measurement of Ocean Wave Slopes Using Polarimetric SAR Data 5
1.2.3.1 Orientation Angle Measurement of Azimuth Slopes 5
1.2.3.2 Orientation Angle Measurement Using the Circular-Pol
Algorithm 5
1.2.4 Ocean Wave Spectra Measured Using Orientation Angles 6
1.2.5 Two-Scale Ocean-Scattering Model: Effect on the Orientation
Angle Measurement 9
1.2.6 Alpha Parameter Measurement of Range Slopes 11
1.2.6.1 Cloude–Pottier Decomposition Theorem and the Alpha
Parameter 11
1.2.6.2 Alpha Parameter Sensitivity to Range Traveling Waves 13
1.2.6.3 Alpha Parameter Measurement of Range Slopes and
Wave Spectra 14
1.2.7 Measured Wave Properties and Comparisons with Buoy Data 16
1.2.7.1 Coastal Wave Measurements: Gualala River Study Site 16
1.2.7.2 Open-Ocean Measurements: San Francisco Study Site 18
1.3 Polarimetric Measurement of Ocean Wave–Current Interactions 20
1.3.1 Introduction 20
1.3.2 Orientation Angle Changes Caused by Wave–Current Interactions 21
1.3.3 Orientation Angle Changes at Ocean Current Fronts 25
1.3.4 Modeling SAR Images of Wave–Current Interactions 25
1.4 Ocean Surface Feature Mapping Using Current-Driven Slick Patterns 27
1.4.1 Introduction 27
1.4.2 Classification Algorithm 31
1.4.2.1 Unsupervised Classification of Ocean Surface Features 31
1.4.2.2 Classification Using Alpha–Entropy Values and the
Wishart Classifier 31
1.4.2.3 Comparative Mapping of Slicks Using Other Classification
Algorithms 34
1.5 Conclusions 34
References 36
C.H. Chen/Image Processing for Remote Sensing 66641_C001 Final Proof page 1 3.9.2007 2:00pm Compositor Name: JGanesan
1
© 2008 by Taylor & Francis Group, LLC
1.1 Introduction
Selected methods that use synthetic aperture radar (SAR) image data to remotely sense
ocean surfaces are described in this chapter. Fully polarimetric SAR radars provide much
more usable information than conventional single-polarization radars. Algorithms, pre-
sented here, to measure directional wave spectra, wave slopes, wave–current interactions,
and current-driven surface features use this additional information.
Polarimetric techniques that measure directional wave slopes and spectra with data
collected from a single aircraft, or satellite, collection pass are described here. Conven-
tional single-polarization backscatter cross-section measurements require two orthogonal
passes and a complex SAR modulation transfer function (MTF) to determine vector slopes
and directional wave spectra.
The algorithm to measure wave spectra is described in Section 1.2. In the azimuth
(flight) direction, wave-induced perturbations of the polarimetric orientation angle are
used to sense the azimuth component of the wave slopes. In the orthogonal range
direction, a technique involving an alpha parameter from the well-known Cloude–Pottier
entropy/anisotropy/averaged alpha (H/A/
"
) polarimetric decomposition theorem is
used to measure the range slope component. Both measurement types are highly sensitive
to ocean wave slopes and are directional. Together, they form a means of using polari-
metric SAR image data to make complete directional measurements of ocean wave slopes
and wave slope spectra.
NASA Jet Propulsion Laboratory airborne SAR (AIRSAR) P-, L-, and C-band data
obtained during flights over the coastal areas of California are used as wave-field
examples. Wave parameters measured using the polarimetric methods are compared with
those obtained using in situ NOAA National Data Buoy Center (NDBC) buoy products.
In a second topic (Section 1.3), polarization orientation angles are used to remotely
sense ocean wave slope distribution changes caused by ocean wave–current interactions.
The wave–current features studied include surface manifestations of ocean internal
waves and wave interactions with current fronts.
A model [1], developed at the Naval Research Laboratory (NRL), is used to determine
the parametric dependencies of the orientation angle on internal wave current, wind-
wave direction, and wind-wave speed. An empirical relation is cited to relate orientation
angle perturbations to the underlying parametric dependencies [1].
A third topic (Section 1.4) deals with the detection and classification of biogenic slick
fields. Various techniques, using the Cloude–Pottier decomposition and Wishart clas-
sifier, are used to classify the slicks. An application utilizing current-driven ocean
features, marked by slick patterns, is used to map spiral eddies. Finally, a related
technique, using the polarimetric orientation angle, is used to segment slick fields from
ocean wave slopes.
1.2 Measurement of Directional Slopes and Wave Spectra
1.2.1 Single Polarization versus Fully Polarimetric SAR Techniques
SAR systems conventionally use backscatter intensity-based algorithms [2] to measure
physical ocean wave parameters. SAR instruments, operating at a single-polarization,
measure wave-induced backscatter cross section, or sigma-0, modulations that can be
C.H. Chen/Image Processing for Remote Sensing 66641_C001 Final Proof page 2 3.9.2007 2:00pm Compositor Name: JGanesan
2 Image Processing for Remote Sensing
© 2008 by Taylor & Francis Group, LLC
developed into estimates of surface wave slopes or wave spectra. These measurements,
however, require a parametrically complex MTF to relate the SAR backscatter meas-
urements to the physical ocean wave properties [3].
Section 1.2.3 through Section 1.2.6 outline a means of using fully polarimetric SAR
(POLSAR) data with algorithms [4] to measure ocean wave slopes. In the Fourier-trans-
form domain, this orthogonal slope information is used to estimate a complete directional
ocean wave slope spectrum. A parametrically simple measurement of the slope is made
by using POLSAR-based algorithms.
Modulations of the polarization orientation angle, u, are largely caused by waves
traveling in the azimuth direction. The modulations are, to a lesser extent, also affected
by range traveling waves. A method, originally used in topographic measurements [5],
has been applied to the ocean and used to measure wave slopes. The method measures
vector components of ocean wave slopes and wave spectra. Slopes smaller than 18 are
measurable for ocean surfaces using this method.
An eigenvector or eigenvalue decomposition average parameter
"
,describedinRef.
[6], is used to measure wave slopes in the orthogonal range direction. Waves in the
range direction cause modulation of the local incidence angle f, which, in turn, changes
the value of
"
. The alpha parameter is ‘‘roll-invariant.’’ This means that it is not affected
by slopes in the azimuth direction. Likewise, for ocean wave measurements, the orien-
tation angle u parameter is largely insensitive to slopes in the range direction. An
algorithm employing both (
"
, u) is, therefore, capable of measuring slopes in any
direction. The ability to measure a physical parameter in two orthogonal directions
within an individual resolution cell is rare. Microwave instruments, generally, must
have a two-dimensional (2D) imaging or scanning capability to obtain information in
two orthogonal directions.
Motion-induced nonlinear ‘‘velocity-bunching’’ effects still present difficulties for wave
measurements in the azimuth direction using POLSAR data. These difficulties are dealt
with by using the same proven algorithms [3,7] that reduce nonlinearities for single-
polarization SAR measurements.
1.2.2 Single-Polarization SAR Measurements of Ocean Surface Properties
SAR systems have previously been used for imaging ocean features such as surface
waves, shallow-water bathymetry, internal waves, current boundaries, slicks, and ship
wakes [8]. In all of these applications, the modulation of the SAR image intensity by the
ocean feature makes the feature visible in the image [9]. When imaging ocean surface
waves, the main modulation mechanisms have been identified as tilt modulation, hydro-
dynamic modulation, and velocity bunching [2]. Tilt modulation is due to changes in the
local incidence angle caused by the surface wave slopes [10]. Tilt modulation is strongest
for waves traveling in the range direction. Hydrodynamic modulation is due to the
hydrodynamic interactions between the long-scale surface waves and the short-scale
surface (Bragg) waves that contribute most of the backscatter at moderate incidence
angles [11]. Velocity bunching is a modulation process that is unique to SAR imaging
systems [12]. It is a result of the azimuth shifting of scatterers in the image plane, owing
to the motion of the scattering surface. Velocity bunching is the highest for azimuth
traveling waves.
In the past, considerable effort had gone into retrieving quantitative surface wave
information from SAR images of ocean surface waves [13]. Data from satellite SAR
missions, such as ERS 1 and 2 and RADARSAT 1 and 2, had been used to estimate
surface wave spectra from SAR image information. Generally, wave height and wave
C.H. Chen/Image Processing for Remote Sensing 66641_C001 Final Proof page 3 3.9.2007 2:00pm Compositor Name: JGanesan
Polarimetric SAR Techniques for Remote Sensing of the Ocean Surface 3
© 2008 by Taylor & Francis Group, LLC
slope spectra are used as quantitative overall descriptors of the ocean surface wave
properties [14]. Over the years, several different techniques have been developed for
retrieving wave spectra from SAR image spectra [7,15,16]. Linear techniques, such as
those having a linear MTF, are used to relate the wave spectrum to the image
spectrum. Individual MTFs are derived for the three primary modulation mechanisms.
A transformation based on the MTF is used to retrieve the wave spectrum from the
SAR image spectrum. Since the technique is linear, it does not account for any non-
linear processes in the modulation mechanisms. It has been shown that SAR image
modulation is nonlinear under certain ocean surface conditions. As the sea state
increases, the degree of nonlinear behavior generally increases. Under these conditions,
the linear methods do not provide accurate quantitative estimates of the wave spectra
[15]. Thus, the linear transfer function method has limited utility and can be used as a
qualitative indicator. More accurate estimates of wave spectra require the use of non-
linear inversion techniques [15].
Several nonlinear inversion techniques have been developed for retrieving wave
spectra from SAR image spectra. Most of these techniques are based on a technique
developed in Ref. [7]. The original method used an iterative technique to estimate the
wave spectrum from the image spectrum. Initial estimates are obtained using a linear
transfer function similar to the one used in Ref. [15]. These estimates are used as inputs
in the forward SAR imaging model, and the revised image spectrum is used to
iteratively correct the previous estimate of the wave spectra. The accuracy of this
technique is dependent on the specific SAR imaging model. Improvements to this
technique [17] have incorporated closed-form descriptions of the nonlinear transfer
function, which relates the wave spectrum to the SAR image spectrum. However,
this transfer function also has to be evaluated iteratively. Further improvements to
this method have been suggested in Refs. [3,18]. In this method, a cross-spectrum is
generated between different looks of the same ocean wave scene. The primary advan-
tage of this method is that it resolves the 1808 ambiguity [3,18] of the wave direction.
This method also reduces the effects of speckle in the SAR spectrum. Methods that
incorporate additional a posteriori information about the wave field, which improves
the accuracy of these nonlinear methods, have also been developed in recent years [19].
In all of the slope-retrieval methods, the one nonlinear mechanism that may completely
destroy wave structure is velocity bunching [3,7]. Velocity bunching is a result of moving
scatterers on the ocean surface either bunching or dilating in the SAR image domain. The
shifting of the scatterers in the azimuth direction may, in extreme conditions, result in the
destruction of the wave structure in the SAR image.
SAR imaging simulations were performed at different range-to-velocity (R/V) ratios to
study the effect of velocity bunching on the slope-retrieval algorithms. When the (R/V)
ratio is artificially increased to large values, the effects of velocity bunching are expected
to destroy the wave structure in the slope estimates. Simulations of the imaging process
for a wide range of radar-viewing conditions indicate that the slope structure is preserved
in the presence of moderate velocity-bunching modulation. It can be argued that for
velocity bunching to affect the slope estimates, the (R/V) ratio has to be significantly
larger than 100 s. The two data sets discussed here are designated ‘‘Gualala River’’ and
‘‘San Francisco.’’ The Gualala river data set has the longest waves and it also produces the
best results. The R/V ratio for the AIRSAR missions was 59 s (Gualala) and 55 s (San
Francisco). These values suggest that the effects of velocity bunching are present, but are
not sufficiently strong to significantly affect the slope-retrieval process. However, for
spaceborne SAR imaging applications, where the (R/V) ratio may be greater than 100 s,
the effects of velocity bunching may limit the utility of all methods, especially in high
sea states.
C.H. Chen/Image Processing for Remote Sensing 66641_C001 Final Proof page 4 3.9.2007 2:00pm Compositor Name: JGanesan
4 Image Processing for Remote Sensing
© 2008 by Taylor & Francis Group, LLC
1.2.3 Measurement of Ocean Wave Slopes Using Polarimetric SAR Data
In this section, the techniques that were developed for the measurement of ocean surface
slopes and wave spectra using the capabilities of fully polarimetric radars are discussed.
Wave-induced perturbations of the polarization orientation angle are used to directly
measure slopes for azimuth traveling waves. This technique is accurate for scattering
from surface resolution cells where the sea return can be represented as a two-scale
Bragg-scattering process.
1.2.3.1 Orientation Angle Measurement of Azimuth Slopes
It has been shown [5] that by measuring the orientation angle shift in the polarization
signature, one can determine the effects of the azimuth surface tilts. In particular, the shift in
the orientation angle is related to the azimuth surface tilt, the local incidence angle, and, to a
lesser degree, the range tilt. This relationship is derived [20] and independently verified [6] as
tan u ¼
tan v
sin f À tan g cos f
(1:1)
where u, tan v, tan g, and f are the shifts in the orientation angle, the azimuth slope, the
ground range slope, and the radar look angle, respectively. According to Equation 1.1, the
azimuth tilts may be estimated from the shift in the orientation angle, if the look angle and
range tilt are known.
The orthogonal range slope tan g can be estimated using the value of the local incidence
angle associated with the alpha parameter for each pixel. The azimuth slope tan v and the
range slope tan g provide complete slope information for each image pixel.
For the ocean surface at scales of the size of the AIRSAR resolution cell (6.6 m  8.2 m),
the averaged tilt angles are small and the denominator in Equation 1.1 may be approxi-
mated by sin f for a wide range of look angles, cos f, and ground range slope, tan g,
values. Under this approximation, the ocean azimuth slope, tan v, is written as
tan v ffi ( sin f) Átan u (1:2)
The above equation is important because it provides a direct link between polarimetric SAR
measurable parameters andphysical slopes onthe ocean surface. This estimation ofocean slopes
relies only on (1) the knowledge of the radar look angle (generally known from the SAR viewing
geometry) and (2) the measurement of the wave-perturbed orientation angle. In ocean areas
where the average scattering mechanism is predominantly tilted-Bragg scatter, the orientation
angle can be measured accurately for angular changes <18, as demonstrated in Ref. [20].
POLSAR data can be represented by the scattering matrix for single-look complex data
and by the Stokes matrix, the covariance matrix, or the coherency matrix for multi-look
data. An orientation angle shift causes rotation of all these matrices about the line of sight.
Several methods have been developed to estimate the azimuth slope–induced orientation
angles for terrain and ocean applications. The ‘‘polarization signature maximum’’ method
and the ‘‘circular polarization’’ method have proven to be the two most effective methods.
Complete details of these methods and the relation of the orientation angle to orthogonal
slopes and radar parameters are given [21,22].
1.2.3.2 Orientation Angle Measurement Using the Circular-Pol Algorithm
Image processing was done with both the polarization signature maximum and the
circular polarization algorithms. The results indicate that for ocean images a sign-
ificant improvement in wave visibility is achieved when a circular polarization algor-
ithm is chosen. In addition to this improvement, the circular polarization algorithm is
C.H. Chen/Image Processing for Remote Sensing 66641_C001 Final Proof page 5 3.9.2007 2:00pm Compositor Name: JGanesan
Polarimetric SAR Techniques for Remote Sensing of the Ocean Surface 5
© 2008 by Taylor & Francis Group, LLC
computationally more efficient. Therefore, the circular polarization algorithm method
was chosen to estimate orientation angles. The most sensitive circular polarization esti-
mator [21], which involves RR (right-hand transmit, right-hand receive) and LL (left-hand
transmit, left-hand receive) terms, is
u ¼ [Arg(hS
RR
S
*
LL
i) þp]=4(1:3)
A linear-pol basis has a similar transmit-and-receive convention, but the terms (HH, VV,
HV, VH) involve horizontal (H) and vertical (V) transmitted, or received, components.
The known relations between a circular-pol basis and a linear-pol basis are
S
RR
¼ (S
HH
À S
VV
þ i2S
HV
)=2
S
LL
¼ (S
VV
À S
HH
þ i2S
HV
)=2
(1:4)
Using the above equation, the Arg term of Equation 1.3 can be written as
u ¼ Arg(hS
RR
S
*
LL
i) ¼ tan
À1
À4Re h(S
HH
À S
VV
)S
*
HV
i
ÀhjS
HH
À S
VV
j
2
iþ4hjS
HV
j
2
i
0
@
1
A
(1:5)
The above equation gives the orientation angle, u, in terms of three of the terms of the
linear-pol coherency matrix. This algorithm has been proven to be successful in Ref. [21].
An example of the accuracy is cited from related earlier studies involving wave–current
interactions [1]. In these studies, it has been shown that small wave slope asymmetries
could be accurately detected as changes in the orientation angle. These small asymmetries
had been predicted by theory [1] and their detection indicates the sensitivity of the
circular-pol orientation angle measurement.
1.2.4 Ocean Wave Spectra Measured Using Orientation Angles
NASA/JPL/AIRSAR data were taken (1994) at L-band imaging a northern California
coastal area near the town of Gualala (Mendocino County) and the Gualala River. This
data set was used to determine if the azimuth component of an ocean wave spectrum
could be measured using orientation angle modulation. The radar resolution cell had
dimensions of 6.6 m (range direction) and 8.2 m (azimuth direction), and 3 Â 3 boxcar
averaging was done to the data inputted into the orientation angle algorithms.
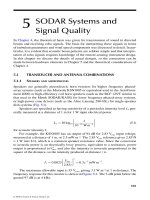
Figure 1.1 is an L-band, VV-pol, pseudo color-coded image of a northern California
coastal area and the selected measurement study site. A wave system with an estimated
dominant wavelength of 157 m is propagating through the site with a wind-wave
direction of 3068 (estimates from wave spectra, Figure 1.4). The scattering geometry for
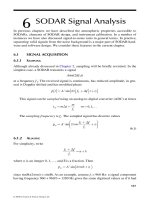
a single average tilt radar resolution cell is shown in Figure 1.2. Modulations in the
polarization orientation angle induced by azimuth traveling ocean waves in the study
area are shown in Figure 1.3a and a histogram of the orientation angles is given in Figure
1.3b. An orientation angle spectrum versus wave number for azimuth direction waves
propagating in the study area is given in Figure 1.4. The white rings correspond to ocean
wavelengths of 50, 100, 150, and 200 m. The dominant 157-m wave is propagating at a
heading of 3068. Figure 1.5a and Figure 1.5b give plots of spectral intensity versus wave
number (a) for wave-induced orientation angle modulations and (b) for single-polariza-
tion (VV-pol)-intensity modulations. The plots are of wave spectra taken in the direction
that maximizes the dominant wave peak. The orientation angle–dominant wave peak
C.H. Chen/Image Processing for Remote Sensing 66641_C001 Final Proof page 6 3.9.2007 2:00pm Compositor Name: JGanesan
6 Image Processing for Remote Sensing
© 2008 by Taylor & Francis Group, LLC
(Figure 1.5a) has a significantly higher signal and background ratio than the conventional
intensity-based VV-pol-dominant wave peak (Figure 1.5b).
Finally, the orientation angles measured within the study sites were converted into
azimuth direction slopes using an average incidence angle and Equation 1.2. From the
estimates of these values, the ocean rms azimuth slopes were computed. These values are
given in Table 1.1.
Range
Flight direction (azimuth)
Study−site box
(512 ϫ 512)
Wave direction
(306؇)
Pacific
Ocean
Northern
California
N
Gualala
River
FIGURE 1.1 (See color insert following page 240.)
An L-band, VV-pol, AIRSAR image, of northern California coastal waters (Gualala River dataset), showing ocean
waves propagating through a study-site box.
C.H. Chen/Image Processing for Remote Sensing 66641_C001 Final Proof page 7 3.9.2007 2:00pm Compositor Name: JGanesan
Polarimetric SAR Techniques for Remote Sensing of the Ocean Surface 7
© 2008 by Taylor & Francis Group, LLC
Incidence plane
H
V
Radar
(Azimuth)
Tilted ocean
resolution cell
(Ground range)
(Surface normal)
y
z
N
I
1
I
2
x ,
f
FIGURE 1.2
Geometry of scattering from a single, tilted, resolution cell. In the Gualala River dataset, the resolution cell has
dimensions 6.6 m (range direction) and 8.2 m (azimuth direction).
Study area: orientation angles
(a)
FIGURE 1.3
(a) Image of modulations in the orientation angle, u, in the study site and (b) a histogram of the distribution of
study-site u values.
(continued)
C.H. Chen/Image Processing for Remote Sensing 66641_C001 Final Proof page 8 3.9.2007 2:00pm Compositor Name: JGanesan
8 Image Processing for Remote Sensing
© 2008 by Taylor & Francis Group, LLC
1.2.5 Two-Scale Ocean-Scattering Model: Effect on the Orientation Angle Measurement
In Section 1.2.3.2, Equation 1.5 is given for the orientation angle. This equation gives the
orientation angle u as a function of three terms from the polarimetric coherency matrix T.
Scattering has only been considered as occurring from a slightly rough, tilted surface
equal to or greater than the size of the radar resolution cell (see Figure 1.2). The surface is
planar and has a single tilt u
s
. This section examines the effects of having a distribution of
azimuth tilts, p (w), within the resolution cell, rather than a single averaged tilt.
For single-look or multi-look processed data, the coherency matrix is defined as
T ¼hkk*
T
i¼
1
2
S
HH
þS
VV
jj
2
DE
(S
HH
þS
VV
)(S
HH
ÀS
VV
)*
hi
2(S
HH
þS
VV
)S*
HV
(S
HH
ÀS
VV
)(S
HH
þS
VV
)*
hi
S
HH
ÀS
VV
jj
2
DE
2(S
HH
ÀS
VV
)S*
HV
2 S
HV
(S
HH
þS
VV
)*
hi
2 S
HV
(S
HH
ÀS
VV
)*
hi
4 S
HV
jj
2
DE
2
6
6
6
4
3
7
7
7
5
(1:6)
with k ¼
1
ffiffiffi
2
p
S
HH
þ S
VV
S
HH
À S
VV
2S
HV
2
4
3
5
We now follow the approach of Cloude and Pottier [23]. The composite surface consists of
flat, slightly rough ‘‘facets,’’ which are tilted in the azimuth direction with a distribution of tilts,
p(w):
p(w) ¼
1
2b
w À s
jj
b
0 otherwise
(1:7)
where s is the average surface azimuth tilt of the entire radar resolution cell.
The effect on T of having both (1) a mean bias azimuthal tilt u
s
and (2) a distribution
of azimuthal tilts b has been calculated in Ref. [22] as
T ¼
ABsin c(2b) cos2u
s
ÀB sinc(2b) sin2u
s
B* sinc(2b) cos2u
s
2C( sin
2
2u
s
þsin c(4b) cos4u
s
) C(1 À2 sinc(4b)) sin4u
s
ÀB* sinc(2b) sin2u
s
C(1 À2 sinc(4b)) sin4u
s
2C(cos
2
2u
s
Àsin c(4b) cos4u
s
)
2
4
3
5
(1:8)
1.2 x 10
4
1.0 x 10
4
8.0 x 10
3
6.0 x 10
3
4.0 x 10
3
2.0 x 10
3
0
–6 –4
(b)
–2 0 2 4 6
Orientation angle (deg)
Occurence number
FIGURE 1.3 (continued)
C.H. Chen/Image Processing for Remote Sensing 66641_C001 Final Proof page 9 3.9.2007 2:00pm Compositor Name: JGanesan
Polarimetric SAR Techniques for Remote Sensing of the Ocean Surface 9
© 2008 by Taylor & Francis Group, LLC
where sin c(x)is ¼ sin(x)/x and
A ¼ S
HH
þ S
VV
jj
2
, B ¼ (S
HH
þ S
VV
)(S*
HH
À S*
VV
), C ¼ 0:5 S
HH
À S
VV
jj
2
Equation 1.8 reveals the changes due to the tilt distribution (b) and bias (u
s
) that occur in
all terms, except in the term A ¼jS
HH
þ S
VV
j
2
, which is roll-invariant. In the correspond-
ing expression for the orientation angle, all of the other terms, except the denominator
term hjS
HH
À S
VV
j
2
i, are modified
u ¼ Arg(hS
RR
S*
LL
i) ¼ tan
À1
À4Re h(S
HH
À S
VV
)S*
HV
i
ÀhjS
HH
À S
VV
j
2
iþ4hjS
HV
j
2
i
!
(1:9)
From Equation 1.8 and Equation 1.9, it can be determined that the exact estimation of the
orientation angle u becomes more difficult as the distribution of ocean tilts b becomes
stronger and wider because the ocean surface becomes progressively rougher.
50 m
100 m
150 m
200 m
Wave direction
306؇
Dominant
wave: 157 m
FIGURE 1.4 (See color insert following page 240.)
Orientation angle spectra versus wave number for azimuth direction waves propagating through the study site.
The white rings correspond to 50, 100, 150, and 200 m. The dominant wave, of wavelength 157 m, is propagating
at a heading of 3068.
C.H. Chen/Image Processing for Remote Sensing 66641_C001 Final Proof page 10 3.9.2007 2:00pm Compositor Name: JGanesan
10 Image Processing for Remote Sensing
© 2008 by Taylor & Francis Group, LLC
1.2.6 Alpha Parameter Measurement of Range Slopes
A second measurement technique is needed to remotely sense waves that have significant
propagation direction components in the range direction. The technique must be more
sensitive than current intensity-based techniques that depend on tilt and hydrodynamic
modulations. Physically based POLSAR measurements of ocean slopes in the range
direction are achieved using a technique involving the ‘‘alpha’’ parameter of the
Cloude–Pottier polarimetric decomposition theorem [23].
1.2.6.1 Cloude–Pottier Decomposition Theorem and the Alpha Parameter
The Cloude–Pottier entropy, anisotropy, and the alpha polarization decomposition the-
orem [23] introduce a new parameterization of the eigenvectors of the 3 Â 3 averaged
coherency matrix hjTji in the form
L-band orientation angle wave spectra
0.50
0.40
0.30
0.20
0.10
0.00
(a)
0.02 0.04
Azimuthal wave number
Spectral intensity
0.06 0.08
L-band, VV-intensity wave spectra
0.50
0.40
0.30
0.20
0.10
0.00
0.00
(b)
0.02 0.04
Azimuthal wave number
Spectral intensity
0.06 0.08 0.10
FIGURE 1.5
Plots of spectral intensity versus wave number (a) for wave-induced orientation angle modulations
and (b) for VV-pol intensity modulations. The plots are taken in the propagation direction of the dominant
wave (3068).
C.H. Chen/Image Processing for Remote Sensing 66641_C001 Final Proof page 11 3.9.2007 2:00pm Compositor Name: JGanesan
Polarimetric SAR Techniques for Remote Sensing of the Ocean Surface 11
© 2008 by Taylor & Francis Group, LLC
hjTji ¼ [U
3
] Á
l
1
00
0 l
2
0
00l
3
2
4
3
5
Á [U
3
]*
T
(1:10)
where
[U
3
] ¼ e
jf
cos a
1
cos a
2
e
jf
2
cos a
3
e
jf
3
sin a
1
cos b
1
e
jd
1
sin a
2
cos b
2
e
jd
2
sin a
3
cos b
3
e
jd
3
sin a
1
sin b
1
e
jg
1
sin a
2
sin b
2
e
jg
2
sin a
3
sin b
3
e
jg
3
2
4
3
5
(1:11)
The average estimate of the alpha parameter is
"aa ¼ P
1
a
1
þ P
2
a
2
þ P
3
a
3
(1:12)
where
P
i
¼
l
i
P
j¼3
j¼1
l
j
: (1:13)
The individual alphas are for the three eigenvectors and the Ps are the probabilities
defined with respect to the eigenvalues. In this method, the average alpha is used and is,
for simplicity, defined as
"
a. For the ocean backscatter, the contributions to the
average alpha are dominated, however, by the first eigenvalue or eigenvector term.
The alpha parameter, developed from the Cloude–Pottier polarimetric scattering
decomposition theorem [23], has desirable directional measurement properties. It is
(1) roll-invariant in the azimuth direction and (2) in the range direction, it is highly
sensitive to wave-induced modulations of f inthelocalincidenceanglef.Thus,the
TABLE 1.1
Northern California: Gualala Coastal Results
In Situ Measurement Instrument
Parameter
Bodega Bay, CA 3-m
Discus Buoy 46013
Point Arena, CA
Wind Station
Orientation Angle
Method
Alpha Angle
Method
Dominant wave
period (s)
10.0 N/A 10.03 From dominant
wave number
10.2 From dominant
wave number
Dominant
wavelength (m)
156 From period,
depth
N/A 157 From wave
spectra
162 From wave
spectra
Dominant wave
direction (8)
320 Est. from
wind direction
284 Est. from
wind direction
306 From wave
spectra
306 From wave
spectra
rms slopes azimuth
direction (8)
N/A N/A 1.58 N/A
rms slopes range
direction (8)
N/A N/A N/A 1.36
Estimate of wave
height (m)
2.4 Significant
wave height
N/A 2.16 Est. from rms
slope, wave number
1.92 Est. from rms
slope, wave number
Date: 7/15/94; data start time (UTC): 20:04:44 (BB, PA), 20:02:98 (AIRSAR); wind speed: 1.0 m/s (BB), 2.9 m/s
(PA) Mean ¼ 1.95 m/s; wind direction: 3208 (BB), 2848 (PA), mean ¼ 3028; Buoy: ‘‘Bodega Bay’’ (46013) ¼ BB;
location: 38.23 N 123.33 W; water depth: 122.5 m; wind station: ‘‘Point Arena’’ (PTAC – 1) ¼ PA; location: 38.968
N, 123.74 W; study-site location: 38839.6
0
N, 123835.8
0
W.
C.H. Chen/Image Processing for Remote Sensing 66641_C001 Final Proof page 12 3.9.2007 2:00pm Compositor Name: JGanesan
12 Image Processing for Remote Sensing
© 2008 by Taylor & Francis Group, LLC