PC Upgrade and Repair Bible Desktop Edition phần 3 pps
Bạn đang xem bản rút gọn của tài liệu. Xem và tải ngay bản đầy đủ của tài liệu tại đây (1.68 MB, 51 trang )
Video
✦✦✦✦
In This Part
Chapter 6
Video
Chapter 7
Monitors and
Flat Panels
✦✦✦✦
III
III
PART6
6
CHAPTER
Video
Y
our monitor and video display board work
together as a pair, much like a disk and its con-
troller. The capabilities of the monitor must match the
needs of the display modes requested by your software
and output by your video card. To understand how the
monitor and video board work together and contribute
to the performance of your computer, we’ll start at the
monitor and work inward through the functions of the
video board.
A Computer Monitor Is Not
the Same as a Television
Although much of what a computer monitor does
appears similar to what a television does, the require-
ments on a computer monitor are much more stringent.
A television that meets the North American standard,
for example, displays roughly 525×700 pixels, with a
viewable area smaller than those numbers. The
European Phase Alternating Line (PAL) standard is a lit-
tle different at 625×833 pixels, but close to the same
size. The most basic computer monitor meeting the
Video Graphics Array (VGA) standard, however, dis-
plays no fewer than 640×480 pixels — all viewable —
with very high-end monitors capable of resolutions of
2,048×1,536 pixels and more. It is for this reason that
products that display television in a window on the
computer screen are fairly inexpensive and work well,
but products that display computer images on televi-
sions are limited to basic VGA resolutions — 640×480 is
common, although some products output up to
1,024×768 — and often smear the images.
If you look closely at the screen on a conventional moni-
tor or liquid crystal display (LCD) panel, you’ll see a
pattern of tiny colored dots that, when each is lit up at
the right brightness, forms the picture you see (moni-
tors using the Sony Trinitron tubes have vertical lines of
color instead). These dots are called pixels (picture ele-
ments). The chain of electronics that delivers this image
to you runs from the face of the monitor’s cathode ray
✦✦✦✦
In This Chapter
Behind the screen
Getting images from
dots and numbers
Examining video
accelerators
Considering video
compression
✦✦✦✦
tube (CRT) or the LCD back through the display electronics to the video card,
and from there into the rest of the computer.
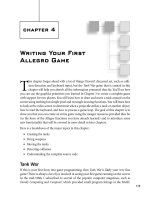
Figure 6-1 shows in more detail the process of drawing a picture by sweeping
the dots on the screen. One complete traverse of the screen starts at position
1 and moves to the right. At the end of the line (2) the beam turns off and rap-
idly moves down and to the left to 3 and the start of the next line. The sweep
of the second line takes the beam to the right, ending at 4. This process con-
tinues with the beam moving downward until the pattern finishes at 5. The
beam then turns off and moves back to 1 to repeat the process.
Figure 6-1: The picture on your screen is a swept array of red, green,
and blue dots.
The changes in brightness the beam delivers while sweeping over the dots
determines the picture you see. For example, a completely blue screen results
if the beam is off for the red and green dots but on for the blue ones. The
brightness of the blue dots is controlled by the brightness of the beam when
it’s over blue dots. More complex pictures are simply combinations of red,
green, and blue dots at the right brightness. Your eye sees not the individual
dots but the composition of them into a complete image.
Because the timing of changes in brightness must be critically synchronized to
the position of the beam on the screen, the video board timing controls the
scan frequencies of the monitor as well as the operation of the board. All the
signal timing is ultimately related to the dot clock, which is a signal within the
video board that pulses once every time the beam on the screen passes a tri-
angle of red, green, and blue dots (one pixel). For example, if the display is set
to 640×480 resolution, the dot clock pulses 640 times as the beam traverses
once from left to right on the screen over the visible part of the image. The dot
clock continues to pulse as the beam makes its fast retrace from right to left
and then repeats the cycle for the next line. Ignoring overscan and retrace, the
dot clock frequency is the resolution of the screen times the number of frames
per second. For a display at 1,280×1,024 at 75 Hz, the dot clock runs at slightly
over 98 MHz.
There’s more on monitors in Chapter 7.
B R G R GB RB
R G B R G R
B R G R GB RB
GB
R G B R G RGB
B R G R GB RB
R G B R G R
B R G R GB RB
GB
R G B R G RGB
The beam moves from
point 1 to point 2 to
point 3 and so on.
1
2
3
4
5
80 Part III ✦ Video
The Video data path
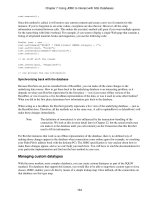
A digital-to-analog (D/A) converter is a device that outputs a signal correspon-
ding to the number fed to the converter. If the converter receives a zero value,
it outputs a zero signal. If it receives a large number, it outputs a large signal.
A video board has three D/A converters, one each for the red, green, and blue
signals sent to the monitor (Figure 6-2). The dot clock sets the timing of pixel
data from the display memory at the D/A converters, sending a new pixel value
for each clock pulse. At 1,600×1,200 resolution, there are (1,600 × 1,200) =
1,920,000 dots on the screen; if you configure the display for an 85 Hz refresh
rate, the dot clock runs at 1,920,000 × 85 = over 163 megahertz. In 32-bit color
mode, the display memory delivers over 622 megabytes per second in that
example, fetching 4 bytes per dot clock.
Figure 6-2: A video board lives or dies by how fast it moves data around.
The video bus delivers the data from video memory to the D/A converters.
Achieving a constant, high-speed flow of data to the D/A converters across the
video bus led designers to many of the same techniques used in processor
front side and memory buses, including making the bus wider to get more out
of each bus cycle and using optimized bus cycles to speed access. It’s not mar-
keting hype that drove video cards to a 256-bit internal bus — making the bus
wider reduces the bus cycle rate.
Sixteen million is a whole lot of colors
There are three common Windows color settings. One-byte pixels can specify
256 colors. Two-byte pixels — called High Color — can specify 65,536 colors.
Four-byte pixels — called True Color — can specify 16,777,216 colors plus a
brightness channel in the fourth byte. (A 3-byte, 24-bit format is also available.)
Video
accelerator
Timing
and
control
Display
memory
Bus interface
Internal video display card bus
Color
palette
Blue D/A
converter
Green D/A
converter
Red D/A
converter
Red
Green
Blue
Chapter 6 ✦ Video 81
“When you’re using 24 bits of color, most people can’t see the dif-
ference between two adjacent colors. It also becomes hard to name
them.” — Microsoft Beta Tester T-Shirt
Each of the three D/A converters (one each for red, green, and blue) accepts
1 byte at a time, so some work is needed to be able to feed all three pixel for-
mats to the converters. Figure 6-3 shows the options. In 24- and 32-bit display
modes, 1 byte in a pixel goes to each of the three converters. In 16-bit modes,
the 16-bit value is split into fields (usually 5 bits for red, 6 for green, and 5 for
blue). The fields are extracted from the value and sent to the corresponding
D/A converter. The only difference between the two modes is the number of
bits used to store the color values.
Figure 6-3: Windows supports three primary pixel formats.
The 256-color mode is different from the other two, using 8 bits to store each
pixel. If the video card divided that 1 byte into fields as with High Color — say
with 3, 3, and 2 bits per color — the card could not provide good rendition.
Instead, the 8-bit value gets used as an index into a color palette with 256
entries, each holding a wider value that can be sent to the D/A converters.
Every pixel is therefore one byte, and as bytes are read from the display mem-
ory, they go through the color palette shown in Figure 6-3. Each of the 256 pos-
sible values in the byte corresponds to one entry in the palette. Each entry in
the palette contains a value for red, green, and blue, each of which are fed to
the corresponding D/A converter. The overall structure permits programs
to choose a set of 256 possible onscreen colors from a much wider range of
Red
value
Green
value
Blue
value
24 bits
18 bits
8 bits
8 bits
True
Color
pixel
8 bits
Pixel
Palette
256 entries
Palette-Based OperationDirect Operation
8 bits
Red
value
Blue
value
16 bits
6 bits
High
Color
pixel
5 bits 5 bits
Color
value
Green
value
Red
value
Blue
value
Green
value
82 Part III ✦ Video
colors, but creates problems when switching from one program to the next.
The 256-color mode is a compromise for slow, limited capability computers,
but isn’t required any longer.
Video Buses
The enormous data rates between processor and video card required for high-
resolution, high-performance graphics exceed what’s possible with the
Peripheral Component Interface (PCI) bus. That problem led designers to cre-
ate the Accelerated Graphics Port (AGP), which started as a modified version
of PCI, to provide greater data rates between system and video memory.
Successive generations of the AGP specification — 1X, 2X, 4X, and now 8X —
increased transfer rates to 2.1 gigabytes per second.
The 8x AGP technology will be the last revision. Succeeding generations will be
based on the PCI Express serial graphics specification and should show up in
PCs some time in 2004 or later.
For conventional 2D displays, the data rates AGP makes possible are enough to
support several independent displays. ATI, nVidia, and Matrox all make video
cards supporting multiple independent monitors from the same card, and if
you’re willing to add PCI cards alongside the AGP card, Windows supports up
to nine monitors. Your desktop extends over all the monitors you have, creat-
ing a larger surface on which you can keep open applications.
What a 3D Video Accelerator Does
Three dimensional games, visualization, and virtual reality systems put you in
a simulated first- or third-person world where you can move around in a highly
detailed environment. These programs work by maintaining a “wire-frame”
structure giving shape to the objects in the world (walls, floors, and ceilings),
and by painting the surfaces of the objects with colored patterns called tex-
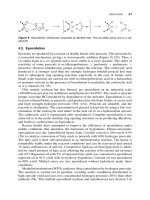
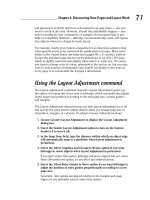
tures, a process called texture mapping. Figure 6-4 is a three dimensional view
of a room; Figure 6-5 is the wire-frame view of the textured representation in
Figure 6-4. Everything you see in Figure 6-4 is the result of textures painted on
the floors, walls, and ceilings defined by the wire frame.
A lot of work is required to create a 3D image. Overall, the sequence is what’s
shown in Figure 6-6, with each step moving the program’s model of what exists
in an imaginary world further from that model and closer to dots on your
screen. As the computations progress from left to right, there become more
objects to do computations for — objects transition to polygons which then
transition to texels — increasing the amount of work to be done in each block.
Chapter 6 ✦ Video 83
Figure 6-4: Textures rendered on a wire frame create a realistic image.
Figure 6-5: The wire-frame structures define the surfaces.
84 Part III ✦ Video
Figure 6-6: The 3D viewing and rendering pipeline transforms a program’s model
of what exists into the image you see.
The details of each step in Figure 6-6 are:
1. Compute vertices — The processor computes the position of each
vertex of each object in the overall coordinate system.
2. Clip edges — Objects may extend past the edges of the visible area.
The overhang has to be eliminated, so the processor clips the edges
of objects against the drawing region boundaries, one polygon of an
object at a time.
3. Eliminate hidden surfaces — You want the final display to omit hid-
den surfaces. The processor has to identify visible surfaces and elim-
inate back-facing surfaces.
4. Compute projections — The display is only 2D, as if a glass surface
is interposed between your eye and a 3D scene. Simulating this in the
computer requires computing 3D to 2D projections of the vertices of
each polygon.
5. Paint surfaces — Once you have a set of 2D polygons, you can paint
the surface of each one with a shaded, perspective-scaled texture map.
Compare position
of each vertex of
each object in the
overall coordinate
system
Clip objects
against
boundaries
of the space, one
polygon at a time
Identify visible
surfaces and
eliminate back-
facing surfaces
Compute 3D to 2D
projections of
vertices
Paint polygon
surfaces with
shaded texture
maps
This is geometry processing in
”world“ coordinates, and is
often done in the processor.
This is the
transition and
rendering, often
done in hardware.
Chapter 6 ✦ Video 85
A 3D hardware accelerator takes over operations on the right side of the
pipeline, freeing the processor for the work on the left. Simple accelerators do
only the polygon rendering and texture mapping; more capable accelerators
scoop up functions in prior blocks of the figure, such as by permitting the
“Compute Vertices” block to pass floating-point coordinates into the next
stage. All these hardware optimizations reduce the workload on the processor.
The most sophisticated accelerators move processing at the vertices, such as
lighting effects, into the accelerator by allowing the program to download sim-
ple programs into the accelerator that run for each vertex.
Texture mapping is more complicated than simply copying a patterned bitmap
to the screen because it requires dealing with the perspective effects in the
wire frame and with visibility of objects due to solid surfaces being in front of
one another. A rectangular pattern bitmap has to be distorted to fit perspec-
tive changes. You can see this in Figure 6-4 on the walls that are not perpendi-
cular to your point of view. Surfaces like that have to recede along perspective
lines toward a vanishing point, requiring that the texture map be distorted to
be shorter and shorter as your eye moves back towards the vanishing point.
The calculations to do texture mapping and to decide which parts of what sur-
faces are visible are computationally expensive — they require a lot of work by
the processor. That’s the basic reason why real-time 3D rendering requires a
fast processor for good performance. Higher resolution screen formats require
significantly more computation — 640×400 resolution takes 4 times the
computation of 320×200, while 1280×1024 resolution takes over 16 times the
computation of 320×200. That increased computational load is why the higher
resolutions became common only with the more recent high-speed processors
and high-performance 3D accelerators.
Another key 3D rendering operation is polygon drawing, which is the most
common technique to represent moving objects. Textures drawn on the poly-
gons give the object a realistic look while retaining the advantages of fast 3D
views. Polygon drawing is similar to the process of covering arbitrary wire
frames with texture maps, but is restricted to flat convex shapes to improve
performance. A mesh of triangles can be used to approximate any 3D surface,
which reduces the complexity of rendering the object onto the screen and
makes the operation faster. Because you can make objects arbitrarily detailed
by making the triangles smaller, there’s no necessary loss of visual quality.
Because the two most important operations for high-speed 3D graphics are
texture mapping and polygon rendering, you usually measure 3D software and
hardware performance in textured pixels (texels) per second and filled poly-
gons per second. Some of the most highly tuned 3D software is in games, so
those that report rendering performance measures sometimes make excellent
3D video benchmarks.
86 Part III ✦ Video
Video Compression
The data rates for digital motion video can become high enough to stress your
computer’s performance and take up a significant amount of storage, as shown
in Table 6-1, which shows how many minutes of video you can store on a
650MB CD-ROM. MPEG 1 video is equivalent to the quality you get from a VCR,
which makes the most interesting point about the data in Table 6-1 — the fact
that it’s possible to compress video at a ratio of over 100:1 and still get useful
images on playback.
Table 6-1
Digital Video Requires Compression
to Be Useful in a PC Environment
Content Mbps Minutes per one CD-ROM
Uncompressed video (CCIT-601 184.32 0.47
standard digital video is a little
slower, at 167 megabits per second)
MPEG 1 compressed video 1.50 57.29
MPEG 2 compressed video 4.00 21.48
(MPEG 2 supports variable data rates) 8.00 10.74
A variety of video compression technologies are used in personal computers
today, but all are related to the framework established by the Motion Picture
Experts Group (MPEG). The MPEG 1 and MPEG 2 standards define most MPEG
applications, but MPEG 4 is becoming widespread because of its ability to store
a full-length movie on a CD-ROM, albeit with quality less than that of a DVD.
The video you see on a television is really a high-speed succession of still
frames, each slightly different from the next. MPEG video compression exploits
the successive frame structure of video by using a combination of still image
compression plus algorithms to exploit the interframe redundancy.
The MPEG still image compression technology uses what’s called the Discrete
Cosine Transform, or DCT, the same approach used in JPEG image compres-
sion. The DCT is based on the idea that a time-varying signal — the sequence
of pixels in a line, for instance — can be represented by the sum of a number
of signals at different frequencies. Figure 6-7 sketches that idea. The upper
graph is a time-varying signal we made by adding two single-frequency signals
Chapter 6 ✦ Video 87
together. We did a frequency analysis on the composite signal, which produced
the lower graph. The two blips in the lower graph occur at the points corre-
sponding to the two signals we added together, and show that one of the two
signals was significantly stronger than the other.
Because you can reconstruct the time-varying signal (the image) from the
decomposed frequencies, the frequencies (and their amplitudes) are equiva-
lent to the image itself. You lose some still image quality if you omit the high-
est frequencies when you reconstruct the image, but omitting the
highest-frequency information (as JPEG compression does) drastically reduces
the size of the stored image, compressing it on disk or over a network.
Figure 6-7: Decomposition of a signal into signals of different frequencies
Figure 6-8 shows the intraframe compression process implementing those
ideas. The DCT algorithm compresses blocks in the image (rather than the
entire image at once) to simplify the computations. After conversion of the
image to DCT coefficients, quantization limits the number of bits, exploiting
the fact that the eye is more sensitive to the effect of the low-frequency coeffi-
cients than the high-frequency ones.
I made up the waveform above to represent
a time-varying signal, such as we might see
in an image. Although there’s a certain
regularity, it’s not clear what that regularity is.
The frequency analysis at the right
reveals that the time-domain signal is
really made up of two specific
frequencies (the blips in the graph),
with one much stronger than the other.
88 Part III ✦ Video
Figure 6-8: MPEG compression discards high-frequency image information.
Manipulating the quantization process allows greater or lesser quality in the
compressed image, and in the process requires more or fewer bits in the out-
put data stream.
MPEG compression adds to the JPEG DCT compression by finding and storing
just the differences between successive frames. Figure 6-9 shows what happens.
The point of the frame structure shown in the figure is to allow the movement
of blocks (the same ones that were DCT encoded by intraframe coding) to be
specified. I-frames are completely intraframe coded. P-frames specify motion of
blocks from the preceding I- or P-frame. B-frames specify motion of blocks from
preceding or succeeding B-, P-, or I-frames.
It’s possible that a block in a frame can’t be found in a preceding or succeed-
ing frame. If so, the block is individually DCT-coded and transmitted in the out-
put sequence.
Break the
image into
blocks
Run the
DCT on
each block
to get
frequency
coefficients
Quantize
the DCT
coefficients
Discard
excess
coefficients
and
compress
the result
Digital
Video
Compressed
Video
Chapter 6 ✦ Video 89
Figure 6-9: The frame structure in an MPEG file defines how motion
estimation relates successive video frames.
Television in a Window
We have to admit that when we first saw a board that would let us turn part of
a computer screen into a television, we didn’t believe it. Fun’s fun, but we fig-
ured we were better off working without television programs in the corner of
the screen. In the same way that we didn’t see the need to turn a computer
into a several-thousand-dollar boom box that plays CDs, we didn’t see any
point in turning it into an expensive television. In both cases, we were wrong.
We didn’t anticipate the value of an MP3 library holding literally thousands or
tens of thousands of songs, and didn’t realize how useful replacing the tape in
a VCR with the disk in your computer could be. Adding a TV tuner to your PC
lets you create the equivalent of a TiVo personal video recorder, which is the
best thing that happened to television since cable and satellite.
A TV tuner decodes the television signal to a video image, then overlays it
onscreen in a window. The first TV tuner cards did this by overlaying the
I-frames –
intraframes – are
compressed as self-
contained images
using DCT
techniques.
B-frames – bi-directional frames – code the differences from preceding or
succeeding frames. The differences are presented as motion of a coded
block from the referenced frame. These arrows show the possible B-frame
dependencies. The precise I-/B-/P- frame sequence is determined by the
encoder, and need not be the IBBPBBPBBP sequence shown here.
I BBP BBP BBP
P-frames – interframes – code the differences from the previous frame, so they
depend on the preceding frames. The differences are presented as motion of a
coded block from the preceding I-frame or P-frame, so the motion coding
process requires finding the best match block in the prior frame and describing
how it has moved in the x and y directions. The arrows show the successive
relations from I-frame to successive P-frames.
90 Part III ✦ Video
analog video signal from the television image on top of the computer display
signal, but the products now on the market do the overlay work digitally, send-
ing the television signal out to the video board as a digital pixel stream. The
video board updates the video memory with the pixels from the television
board. The usual output and digital-to-analog conversion circuits on the video
board create the combined signal sent to the monitor. Compressing and writ-
ing the digital video to disk implements the video recorder function.
Choosing a Video Card
Choosing a video board is dependent on what you want from your computer
and on which manufacturers you have confidence in. Even though video drivers
come with Windows, you may still be dependent on the board manufacturer.
(For example, we’ve seen a video board capable of 1600×1200 resolution that
was supported only in 1280×1024 resolution by the standard Windows drivers.
The manufacturer’s enhanced drivers were required to realize the full capabil-
ity of the board.)
Chapter 6 ✦ Video 91
Matching Video Hardware and Software
Many 3D video games use the Microsoft DirectX technology to work with the
hardware on the video card. As of early 2004, the current version of DirectX was
9.0b, which was a significant advance over earlier versions. Most significant of
the features in DirectX 9 is the ability for developers to create small programs
that the video hardware executes for each vertex in the polygon model.
Not all video cards include the hardware and software drivers to support DirectX
9, but the most demanding PC video games (including Microsoft’s Halo and
Valve’s Half-Life 2) require it for the best appearance and performance. Use a
video card supporting only a lesser DirectX revision and you should expect poor
graphics and slower display rates.
That said, don’t forget that the PC video card market is intensely competitive,
with both ATI and nVidia doing everything they can to be the leader. Not all those
efforts work in your best interest. Manufacturers have been caught tuning their
drivers for improved benchmark performance, which has no benefit for game
play. Eidos and Ion Storm have explicitly tuned Deus Ex: Invisible War for the
nVidia hardware, stupidly buying into an nVidia marketing program, and deliv-
ered a game that runs badly on ATI hardware. Worse, in the process, they failed
to test their copy protection adequately, and as of patch level 1.1, Eidos admits
they have bugs that cause the game to fail to run on the system that you see
how to build in Chapter 25.
Keep anti-consumer practices like that in mind when you buy hardware and
software.
Video Drivers
Most problems with video cards arise from incompatibilities between the driv-
ers and your software. Although we strongly recommend not updating drivers
unless you have a good need to, video drivers are among the most updated
software there is.
The most direct way to get updated video drivers for Windows is on the Internet
from the card manufacturer’s Web site. There are many video card suppliers,
but often they just manufacture standard designs by ATI or nVidia. If you have
a card based on an ATI or nVidia design, you’re probably better off getting
drivers directly (
www.ati.com and www.nvidia.com, respectively) than from
the actual manufacturer.
Manufacturers often don’t provide drivers for UNIX systems; contact your
UNIX vendor or, if you use a UNIX system with the XFree86 X Window system,
look at
www.xfree86.org.
Because many video cards use their own specialized drivers, the first thing to
do when you’re upgrading a video card is to undo anything that’s tied to your
existing card. In Windows, that means you’ll want to change your video driver
to the Standard VGA driver, which should work with both your old and new
cards. We’ve also seen driver updates that failed if the prior ones weren’t unin-
stalled, so check that in the Add/Remove Programs applet in the Windows con-
trol panel.
Summary
✦ Video images are arrays of dots (pixels) output by the video board.
✦ Higher resolution — more pixels — means closer dot spacing on the
monitor, and more work for the video board.
✦ You get more possible colors by using more bytes per pixel, which
takes more memory and creates more work for the video board.
✦ Hardware accelerators that take over the work of software can
improve video performance.
✦ Realistic 3D displays on your screen require enormous numbers of
computations, leading to other opportunities for accelerators to
improve performance.
92 Part III ✦ Video
7
7
CHAPTER
Monitors and
Flat Panels
I
t’s easy to say what you want in a monitor. You want
it to be sharp, with bright, clear color. You want what
you see to fill the screen, free of geometric distortions.
You want it to deliver all the capabilities of your
video card.
Getting what you want is more complex. The technical
characteristics of your monitor determine the limits of
the display modes you can get on the screen. Dot pitch
and the horizontal and vertical frequencies or resolu-
tion are readily evident, but sharpness, color balance,
distortion measurements, and the rest of the character-
istics are harder to specify or measure. Some require
specialized test equipment or software to put up test
displays. Often you can find information on those tech-
nical characteristics in product reviews and sometimes
in manufacturer data.
In a dramatic change from the past, there are now two
viable technologies for desktop PC monitors. Cathode
ray tube (CRT) monitors have been the technology of
choice for decades, but are now rapidly being displaced
by the same liquid crystal display (LCD) technology
found in laptop computers. The significance of the
change in the market is so great that many companies
have completely abandoned manufacturing CRT moni-
tors, which are now commodity products, in favor of
LCDs. In this chapter, we look first at the newer flat
panel technology, then cover the characteristics of the
older CRT monitors.
✦✦✦✦
In This Chapter
Understanding flat
panel displays
Examining CRT
specifications
Working with Display
Data Channel
✦✦✦✦
Flat Panel Displays
A flat panel display is the desktop version of the display you find in laptop
computers. The advantages of a flat panel are as follows:
✦ Requires less space and less power than a CRT
✦ Has no geometric distortion
✦ May deliver a sharper image
You can build a flat panel display in several ways, of which the most common
are plasma panels and liquid crystal displays (LCDs). Plasma panels are used
in the relatively large flat televisions now available, while LCDs dominate com-
puter applications.
LCDs and active matrix technology
Most LCD panels use the active matrix technology, with three transistors at
each pixel to control colors and a backlight to illuminate the entire array.
Figure 7-1 shows how the technology works. When the active matrix transis-
tors are off, the liquid crystal material blocks the transmission of the incident
light at the back of the cell (upper drawing). Each transistor in the cell (one
per color) can be turned on independently. When a transistor is turned on, it
reorients the liquid crystal material and allows white light to pass. A colored
filter in front of the transistor blocks all but one color, creating the usual red-
green-blue triad making up one pixel (lower drawing).
The LCD panel itself requires very little power, but the backlight requires
enough power to be a significant drain in laptop applications. The LCD
requires a backlight for operation, and the mean time between failures (MTBF)
of the backlight is around 20,000 hours. Backlights are not generally replace-
able by users. If you use a flat panel display for long periods, it’s quite likely
you’ll have to have the light replaced.
Changing the image on the display requires physical changes in the cells con-
trolled by the active matrix transistors, changes that slow down and ultimately
stop if the panel gets too cold.
Keeping the LCD image sharp
Most desktop LCD panels come with a standard VGA port to interface to
standard video display cards. The signals at the VGA port are analog, how-
ever, with their per-pixel timing implicit in the dot clock operating in the
video card. That approach works relatively well for CRTs because mistiming
simply spills the beam over into the next pixel, but can cause fuzziness on a
LCD, which has to reconstruct the digital signal to switch the active matrix
transistors.
94 Part III ✦ Video
Figure 7-1: An active matrix LCD
Recognizing this limitation, Intel, Compaq (now HP), Fujitsu, Hewlett-Packard,
IBM, NEC, and Silicon Image formed the Digital Display Working Group (DDWG)
to standardize a digital interface between PCs, consumer electronic devices,
and digital displays. The result of that work is the Digital Visual Interface (DVI)
specification. DVI includes the Plug and Play features of the Display Data
Channel (DDC) interface for analog monitors (see the section “Display Data
Channel,” later in this chapter) and can support flat panel resolutions up to
1920×1080 with the basic interface cable defined in the specification.
In a CRT, low-resolution formats simply extend the timing of each dot, allowing
the beam to cover multiple pixels. In an LCD, however, the dots are in fixed
positions, and digital processing is required to display an image of lower reso-
lution than the panel’s native size display. The two ways to do this are:
✦ Use part of the panel — You can display the smaller image using just
part of the panel, centering the image with an unused border. Each
dot occupies just one pixel on the panel, so the image is as sharp as
possible, but many pixels remain unused.
✦ Scale the image to fit the panel — Alternatively, you can resample the
image to create more pixels, interpolating between dots to generate
the intervening pixel data. The resampling approach uses all the pixels
on the display, but leaves the edges in the image somewhat fuzzy.
Active matrix transistors
(turned off)
Incident light
from backlight
Color
filters
Active matrix transistors
(turned on)
Incident light
from backlight
Red
Red
Blue
Blue
Green
Green
Chapter 7 ✦ Monitors and Flat Panels 95
Either way, the image won’t be as large and as sharp as an image displayed
at the panel’s native resolution. It’s for that reason that some laptops warn
you about a loss of sharpness when you change the display resolution
down from its maximum setting. If you’re reducing the resolution to make
the text on the display larger, try using Windows’ large fonts setting instead
(Control Panel ➪ Display ➪ Settings ➪ Advanced ➪ General; it’s the Font
Size drop-down list).
DVI-enabled flat panels and video cards have connectors like that shown in
Figure 7-2. If you have a choice between DVI and standard VGA, use the DVI
connection.
Figure 7-2: DVI connector
©2004 Barry Press & Marcia Press
LCD monitors are typically specified in terms of viewable diagonal, interfaces,
brightness, contrast, and viewing angle. Buying an LCD panel is much like buy-
ing a monitor — see the unit in operation and (assuming they’re all optimally
adjusted) look for the ones that are sharp and bright, with good color and con-
trast. Software such as DisplayMate (
www.displaymate.com) can help you
evaluate LCDs (and CRTs) before you buy and help you tune your system for
peak video quality.
The Samsung line of desktop LCDs illustrates what you can get as of late 2003.
You can get LCD panels with both analog (VGA) and digital (DVI) inputs from
15 inches viewable diagonal measurement to 24 inches, and resolutions from
1024×768 to 1920×1200, respectively; and if you’re not on a limited budget,
they have a giant 40-inch model, too. LCD pricing is driven by the number of
pixels in the glass more than the size of the panel; in late 2003, the sweet spot
was the 17-, 18-, and 19-inch displays with 1280×1024 resolution. Street prices
for those models at that time were from $580 to $610, which isn’t much of a dif-
ference. Those prices will move down further, and as production methods and
96 Part III ✦ Video
volumes improve, prices for even larger, higher resolution LCDs will come
down, too.
CRT Specifications and Measurements
Although less expensive, CRT monitors are more complex than LCDs. The tech-
nical characteristics that define your monitor’s performance are focus and con-
vergence; color balance, tracking, purity, and saturation; ghosting; and
geometry.
Focus and convergence
A CRT monitor uses triangles of three-color dots filling the screen (or lines
grouped in tri-color sets in the case of monitors using the Sony Trinitron tube).
How the beams inside the picture tube illuminate those dots determines how
well the monitor can generate crisp edges on what it draws, rather than blobs
with colored halos at the edges. Figure 7-3 shows how this works. The phos-
phors on the cathode ray tube (CRT) surface — the red, green, and blue
dots — are in groups of three called triads. Each triad has one corresponding
hole in the shadow mask. The hole keeps the beam from an electron gun from
illuminating the wrong color phosphors.
Figure 7-3: The shadow mask
Three separate electron beams exist: one for red, one for green, and one for
blue. All three go through the same hole in the shadow mask for the same
triad; but, because the electron guns are offset in a triangle around the center-
line of the CRT, the pattern of the beams through the shadow mask — the
“shadow” — is itself a triangle. If the beams from the electron guns are pre-
cisely focused, they project dots onto the phosphor layer no bigger than the
dots themselves, and don’t overlap onto adjacent triads. Lining up the individ-
ual beams through the shadow mask is called convergence. If the aim of the
electron beams onto the phosphors, through the shadow mask, is precise,
each beam illuminates only its own color dot. Misconvergence shows up as
miscolored edges on lines and in areas.
One
phosphor
triad
Phosphor surface,
with other triads
Hole in shadow mask
Shadow mask,
with other holes
Chapter 7 ✦ Monitors and Flat Panels 97
You see poor focus on the screen as fuzziness because adjacent triads get
some illumination from the beam and light up. A poorly focused monitor can’t
form a one-pixel edge.
Misconvergence and poor focus most often show up at the corners and edges
of the screen, or in the center if the corners and edges are right. Figure 7-4
shows why this happens. The extensive bend required in the electron beam
to reach the sides and corners of the tube tends to distort the beam, which in
turn requires the electronics to adapt to correct the distortion. If the electron-
ics do this badly, they distort the beam in the center and force you to compro-
mise by setting the controls for a place between the center and the outside.
As a result, neither area ends up in focus or well converged on the monitor.
Figure 7-4: Shorter CRTs make the electronics design harder.
The flat-face CRTs now available further complicate the electronics because
the focal length from the electron gun varies as the beam sweeps both verti-
cally and horizontally, requiring additional controls to modulate the focus coils
correspondingly.
Another cause of poor image quality can be poor design of the shadow mask.
The electron beam carries a certain amount of power, some of which is
absorbed by the shadow mask. The shadow mask heats up as a result, which
can cause it to distort if it’s not well constructed. This means you’ll want to
look at a monitor’s performance after it’s been on for a while as well as when
it’s cold, and also when you have the brightness and contrast cranked up
(which increases the heat load on the shadow mask).
To reach dots at the outside and
corners of the screen, the electron
beam has to deflect at a relatively large
angle. Maintaining uniform focus and
convergence from low to high
deflection angles is difficult, and
requires careful design in the
monitor electronics.
Beam deflection angle
Electron
gun
To reach dots at the
center of the screen,
the electron beam
deflects little from the
centerline of the tube.
Phosphor
surface
98 Part III ✦ Video
The brightness and contrast your monitor delivers is the result of a balanc-
ing act with the sharpness of focus and accuracy of convergence. A brighter
image is the result of more power in the electron beam, which is harder for
the electronics to control. This means that you should check focus and con-
vergence with the brightness at its maximum useful setting. This doesn’t
mean all the way up; it means at the brightest point you’d actually set it to.
For many monitors, that’s the point just before the black areas start to turn
gray, with the contrast adjusted to its maximum useful point. That’s as dif-
ficult as it’s going to get for the monitor, so if it handles well at that adjust-
ment, it should be okay at lower levels as well.
Another important element to check on the monitor is its antiglare treatment
because different monitors have different antiglare treatments. Some use coat-
ings on the face of the CRT, some use lenses, and some roughen the face of the
CRT. Most antiglare approaches degrade the sharp focus a little, so you’ll want
to see how the manufacturer balanced these elements.
Color balance, tracking, purity, and saturation
Your eye is sensitive to color relationships. Skin tones that are off-color draw
your eye. A monitor needs to achieve good color balance to look right. It has
to maintain the correct intensity relationship between red, green, and blue.
The characteristics of the electronics in the monitor are such that the color
balance tends to vary with brightness. Having the monitor balance on a bright
image doesn’t mean that it will remain balanced on dark ones. The electronics
may not maintain good color tracking as the brightness varies. Check for bal-
ance both on bright areas and in dark grays because of this limitation. Your
video card may have adjustments for color balance, but overall you want the
monitor to get the balance and tracking right. Color balance on the video card
is most useful for adjustments to get screen and printer colors to correspond.
If the monitor is off-balance, you may not have the necessary range of adjust-
ments available.
Good color saturation means that colors are neither too strong, with similar
colors being indistinguishable, nor washed out and faded. The difference is the
same as when you run the color saturation control back and forth on a color
television. At one end, colors wash out to black and white, while at the other
end colors are sharply defined like those on a poster, with no intermediate
color tones.
Color purity means that the colors on the screen are uniform everywhere, with
no patches of odd color. The most common causes of purity problems are
unwanted magnetic fields deflecting the beams on their way to the shadow
mask, through the shadow mask, and to the phosphors. This can happen two
ways: a device outside the monitor can create a magnetic field that reaches
into the tube, or the shadow mask can become partially magnetized.
Chapter 7 ✦ Monitors and Flat Panels 99
Incident static magnetic fields
A surprising number of things can create static magnetic fields, including power
transformers, telephones, speakers, and (of course) magnets. Don’t forget that
magnets and power transformers can be inside other objects. Their magnetic
fields can extend through an unshielded or poorly shielded equipment case
and into your monitor. If they do, one of two consequences can happen: you
get local discolorations, or you get a ripple in the image on the screen.
If the problem is a static magnetic field, such as from a magnet or a speaker
(which contains a magnet), it can slowly magnetize the shadow mask (see
Figure 7-5). The problem is that the permanent magnet must provide a strong,
stable magnetic field for the voice coils to push against. If the speaker isn’t
shielded, or is shielded poorly, that magnetic field reaches outside the speaker.
If the speaker is placed too close to your monitor, it can reach into the CRT.
When that happens, it starts to magnetize the shadow mask. Magnetization of
the shadow mask can distort the color and the focus in the affected parts of
the tube.
Figure 7-5: Magnets in speakers can discolor or blur your monitor.
A device called a degaussing coil inside the monitor is wound around the tube
and activated every time you turn on the monitor. This device tries to neutral-
ize residual magnetization of the shadow mask by these constant fields, but it’s
only so strong and can do only so much. Over time, the shadow mask can
Left
speaker
Right
speaker
Monitor
Magnetic fields
from speakers
100 Part III ✦ Video
acquire a local magnetic field that discolors the display in that region. We’ve
also had the combination of a field from speakers and the action of the
degaussing coil combine to leave no residual field, so that when we removed
the speakers, discolorations appeared in the corners of the display that had
been near the speakers.
Your options are to use well-shielded speakers, or to keep the speakers well
away from the front of the CRT. The safe distance depends on the speaker and
on the shielding in the monitor itself. Moving the speakers to the back of the
monitor helps, as well as spacing them laterally away from the monitor case.
You can check a monitor for color-purity problems by looking at a pure
white screen. (For example, set the document background color to white,
open an empty document in Word, and use the View ➪ Full Screen com-
mand. More comprehensive tests are available in DisplayMate.) If you see
patches of faint color, the monitor may need to be degaussed with a strong
degaussing coil. Degaussing is an operation involving passing a strong
alternating magnetic field past the entire screen. Over tens of seconds, you
slowly move the coil far away from the tube and then turn it off. You can
get degaussing coils at larger electronics supply stores, or on the Internet —
search Google for degaussing coil. Follow the directions that come with the
coil carefully because you can make things worse if you use it improperly.
Incident dynamic fields
Varying magnetic fields too near your monitor can cause the image to be wavy.
A common source of such fields is power transformers: devices that use mag-
netic fields to shift power from one form to another. If you find one part of the
display vibrating back and forth on the screen, look for other electronic com-
ponents (wall transformers, uninterruptible power supplies, boom boxes,
neighboring monitors in a multiple-monitor setup, and so forth) that are close
to the monitor and see what happens when you move them away.
Ghosting
As the electron beam sweeps along a line, the video amplifiers in the monitor
have to pass an intensity signal to the beam so that each pixel is painted at the
right intensity. If the bandwidth the video passes is too small, the intensity sig-
nal can’t change fast enough, producing ghosts — shadows and streaking of
the on-screen image. The strength of the ghost image depends on how intense
the original image is. A small change may not create a noticeable ghost, but a
black-to-white vertical edge can create highly noticeable shadows.
The relevant capability of the video amplifier is called the maximum video
bandwidth and is typically in the range of 50 to 150 megahertz (MHz). An
acceptable maximum video bandwidth is implied by a manufacturer spec-
ification that the monitor will handle the resolution you want. To be sure
that it does meet your requirements, look at a maximum-resolution display
with alternating black and white bars. If you see ghosting (and the monitor
cable hasn’t been extended), the video bandwidth is inadequate and you
should find another monitor.
Chapter 7 ✦ Monitors and Flat Panels 101