Báo cáo y học: "Promoter features related to tissue specificity as measured by Shannon entropy" doc
Bạn đang xem bản rút gọn của tài liệu. Xem và tải ngay bản đầy đủ của tài liệu tại đây (442.7 KB, 24 trang )
Genome Biology 2005, 6:R33
comment reviews reports deposited research refereed research interactions information
Open Access
2005Schuget al.Volume 6, Issue 4, Article R33
Research
Promoter features related to tissue specificity as measured by
Shannon entropy
Jonathan Schug
*
, Winfried-Paul Schuller
†
, Claudia Kappen
†
, J
Michael Salbaum
†
, Maja Bucan
‡
and Christian J Stoeckert Jr
*
Addresses:
*
Center for Bioinformatics, University of Pennsylvania, Philadelphia, PA 19104, USA.
†
Department of Genetics, Cell Biology and
Anatomy, University of Nebraska Medical Center, Omaha, NE 68198, USA.
‡
Department of Genetics, University of Pennsylvania, Philadelphia,
PA 19104, USA.
Correspondence: Jonathan Schug. E-mail:
© 2005 Schug et al.; licensee BioMed Central Ltd.
This is an Open Access article distributed under the terms of the Creative Commons Attribution License (
which permits unrestricted use, distribution, and reproduction in any medium, provided the original work is properly cited.
Promoter features related to tissue-specific expression<p>A genome-wide analysis of promoters was carried out in the context of gene expression patterns in tissue surveys using human micro-array and EST-based expression data. The study revealed that most genes show statistically significant tissue-dependent variations of expression level and identified components of promoters that distinguish tissue-specific from ubiquitous genes.</p>
Abstract
Background: The regulatory mechanisms underlying tissue specificity are a crucial part of the
development and maintenance of multicellular organisms. A genome-wide analysis of promoters in
the context of gene-expression patterns in tissue surveys provides a means of identifying the
general principles for these mechanisms.
Results: We introduce a definition of tissue specificity based on Shannon entropy to rank human
genes according to their overall tissue specificity and by their specificity to particular tissues. We
apply our definition to microarray-based and expressed sequence tag (EST)-based expression data
for human genes and use similar data for mouse genes to validate our results. We show that most
genes show statistically significant tissue-dependent variations in expression level. We find that the
most tissue-specific genes typically have a TATA box, no CpG island, and often code for
extracellular proteins. As expected, CpG islands are found in most of the least tissue-specific genes,
which often code for proteins located in the nucleus or mitochondrion. The class of genes with no
CpG island or TATA box are the most common mid-specificity genes and commonly code for
proteins located in a membrane. Sp1 was found to be a weak indicator of less-specific expression.
YY1 binding sites, either as initiators or as downstream sites, were strongly associated with the
least-specific genes.
Conclusions: We have begun to understand the components of promoters that distinguish tissue-
specific from ubiquitous genes, to identify associations that can predict the broad class of gene
expression from sequence data alone.
Background
The development of an adult from the single cell of a fertilized
egg requires a complex orchestration of genes to be expressed
at the right time, place, and level. Basic cellular functions
require the expression of certain genes in all cells and tissues
(that is, in a ubiquitous manner) while specialized functions
require restricted expression of other genes in a single or
small number of cells and tissues (that is, tissue specific).
Published: 29 March 2005
Genome Biology 2005, 6:R33 (doi:10.1186/gb-2005-6-4-r33)
Received: 16 November 2004
Revised: 27 January 2005
Accepted: 16 February 2005
The electronic version of this article is the complete one and can be
found online at />R33.2 Genome Biology 2005, Volume 6, Issue 4, Article R33 Schug et al. />Genome Biology 2005, 6:R33
Both types of genes may be needed for embryonic develop-
ment as well as for the function of adult cells and tissues.
While the details of regulatory mechanisms will vary for indi-
vidual genes, general features of promoters (and here we will
restrict our focus to RNA polymerase II (Pol II) promoters)
are likely to facilitate whether a gene will be expressed widely
or in a restricted manner. For example, based on the limited
number of genes available at the time of the analysis, promot-
ers with CpG islands have been associated with housekeeping
genes [1,2]. It is desirable to re-examine this finding in the
context of complete genomes for human and mouse and to
place it in context with subsequent findings such as the asso-
ciation of CpG islands with embryonic expression [3].
Furthermore, it would also be informative to examine the
relationship of CpG islands to the base composition of pro-
moters, and the distribution of motifs thought to be bound by
factors closely involved with (or part of) the basal transcrip-
tion complex. The distribution of major components of the
core promoter, the TATA box (TBP/TFIID binding site) and
initiator element (Pol II binding site, Inr) [4], and proximal
elements such as Yin-Yang 1 (YY1) site [5-8], among genes is
not yet well understood. In addition, the functional correla-
tions with tissue specificity and promoter structure are
largely unknown beyond the CpG island association. Our goal
is to place these components together in general models for
tissue specificity using genome-wide surveys of expression in
many tissues.
Investigators have searched for combinations of transcrip-
tion-factor-binding sites that confer tissue-specific expres-
sion on particular cell types such as muscle [9] or liver [10] in
mammals, or in body plan specification in the fruit fly [11,12]
(see [13] for a review). In support of these efforts, analyses of
genome-wide expression data have largely focused on identi-
fying common patterns for particular tissues, disease states or
signaling inputs. For microarray data, investigators have
begun defining these patterns, largely through the application
of clustering algorithms [14,15]. Our approach is to rank
genes in the spectrum of tissue specificity that runs from
expression restricted to one tissue to uniform ubiquitous
expression. We can study in detail the distribution of human
and mouse genes across the spectrum of tissue specificity and
use this to identify commonalities and differences in their
promoters with the available complete genome sequences
[16], libraries enriched for full-length cDNAs [17-19] and
genome-wide surveys of gene expression using microarrays
[14,20-24], SAGE [25], mRNAs [18] and expressed sequence
tags (ESTs) [26]. We validate patterns discovered in human
sequence and expression data by comparison to similar
mouse data.
Measures have been developed for overall tissue specificity
[3,27,28] that amount to counting the number of tissues that
express a gene. These are really measuring tissue restriction,
as they do not consider any bias in the expression levels
across the tissues that express the gene. Most specificity
measures for a particular tissue are equivalent to the relative
expression in a tissue compared to the total expression in all
tissues considered, (see, for example [29]). We assert that
overall tissue specificity measures should take into account
the levels of expression in different tissues, not just presence
and absence, and that specificity measures for particular tis-
sues should consider the distribution of expression among all
tissues in addition to the tissue of interest. Such measures
would enable the correct identification of genes as specific for
a tissue when that tissue is not the primary site of expression
but there are only a few other tissues where the gene is
expressed.
A metric for characterizing the breadth and uniformity of the
expression pattern of a gene that meets our criteria is the
Shannon information theoretic measure entropy. Although
entropy has been used previously to identify potential drug
targets [30,31] by considering the entropy of the variation of
expression levels and to cluster microarray data [32], our
direct application of entropy to measuring tissue specificity is
unique. Entropy (H) measures the degree of overall tissue
specificity of a gene, but does not indicate whether it is spe-
cific to a particular tissue. To quantify categorical tissue spe-
cificity, we introduce a new statistic (Q) that incorporates
overall tissue specificity and relative expression level. We
demonstrate that H and Q are effective metrics for ranking
and selecting genes according to tissue specificity and then
proceed to use them to investigate promoter features (CpG
islands, base composition, transcription factor motifs) that
may be used distinguish tissue-specific genes from nonspe-
cific genes. The association of promoter features with a quan-
titative assessment of tissue specificity using H and Q is an
important step towards developing models for promoter
function.
Results
Defining tissue specificity
We begin by defining the measurement of two kinds of tissue
specificity, 'overall' tissue specificity and 'categorical' tissue
specificity. (To avoid confusion we will always use the words
'specificity' and 'specific' to refer to the degree of tissue-
restricted expression a gene exhibits and never as a synonym
for the word 'particular'.) Overall tissue specificity ranks a
gene according to the degree to which its expression pattern
differs from ubiquitous uniform expression. We use the term
'ubiquitous' expression to mean expression at any level above
background in all tissues. Categorical tissue specificity places
special emphasis on a particular tissue of interest and ranks a
gene according to the degree to which its expression pattern
is skewed toward expression in only that particular tissue. In
both cases, a gene's specificity to a tissue, cell type or other
condition is decreased as the gene is more uniformly
expressed in a wider variety of conditions. In addition, the
categorical tissue specificity should decrease as the tissue of
Genome Biology 2005, Volume 6, Issue 4, Article R33 Schug et al. R33.3
comment reviews reports refereed researchdeposited research interactions information
Genome Biology 2005, 6:R33
interest becomes a smaller component of the overall expres-
sion pattern of the gene.
Given a static multi-tissue expression profile for a gene, there
are at least two dimensions along which we can assess the
profile to measure tissue specificity. The first dimension is the
number of tissues that express the gene above some back-
ground level. It can be argued that this dimension measures
tissue restriction, that is, a gene shows restricted expression
if it is expressed in only a subset of tissues. The second dimen-
sion is the uniformity of expression over all tissues that
express the gene. A gene that shows significant non-uniform
expression is exhibiting tissue-dependent regulation, in addi-
tion to any tissue restriction that may be occurring. We
assume that a gene that exhibits no tissue-specific regulation
will be expressed at the same level in every tissue. We do not
assert that such genes are not regulated, only that they are
regulated in a way that is not sensitive to tissue.
The term 'most tissue-specific' will refer to the range of genes
that are closer to the extreme of expression in a single tissue
than to the extreme of ubiquitous uniform expression. We
will refer to genes close to the uniform and ubiquitous end as
either 'least tissue-specific' or 'nonspecific' though the latter
term may not be strictly true. The range in the middle will be
termed 'semi-tissue specific'. The term 'housekeeping' has
been applied to genes that are widely expressed and may
show little tissue-specific changes in expression level. We can
use such genes as an example of genes that will tend to be
ubiquitously and uniformly expressed and thus ought to be
nonspecific on average. We will use the phrase 'gene sharing'
to refer to the situation that occurs when a gene is tissue-spe-
cific, and is expressed in a small number of tissues that can be
said to share the gene.
Measuring tissue specificity with entropy
We used two gene-expression datasets to evaluate our meth-
ods; Affymetrix-based data from the GNF Gene Expression
Atlas (GNF-GEA) [22] and the distribution of source tissues
for EST libraries in the clusters and assemblies of ESTs in the
DoTS mouse and human gene index [33]. As described in
Materials and methods, the GNF-GEA data were used as pro-
vided; EST counts in the DoTS gene index were adjusted with
pseudocounts and normalized to account for the different
number of ESTs sampled from each tissue across all libraries.
Given expression levels of a gene in N tissues, we defined the
relative expression of a gene g in a tissue t as p
t|g
= w
g,t
/∑
1 ≤ t
≤ N
w
g,t
where w
g,t
is the expression level of the gene in the tis-
sue. The entropy [34] of a gene's expression distribution is H
g
= ∑
1 ≤ t ≤ N
- p
t|g
log
2
(p
t|g
). H
g
has units of bits and ranges from
zero for genes expressed in a single tissue to log
2
(N) for genes
expressed uniformly in all tissues considered. The maximum
value of H
g
depends on the number of tissues considered so
we will report this number when appropriate. Because we use
relative expression the entropy of a gene is not sensitive to the
absolute expression levels. To measure categorical tissue spe-
cificity we define Q
g|t
= H
g
- log
2
(p
t|g
). The quantity -log
2
(p
t|g
)
also has units of bits and has a minimum of zero that occurs
when a gene is expressed in a single tissue and grows
unboundedly as the relative expression level drops to zero.
Thus Q
g|t
is near its minimum of zero bits when a gene is rel-
atively highly expressed in a small number of tissues includ-
ing the tissue of interest, and becomes higher as either the
number of tissues expressing the gene becomes higher, or as
the relative contribution of the tissue to the gene's overall pat-
tern becomes smaller. By itself, the term -log
2
(p
t|g
) is equiva-
lent to p
t|g
. Adding the entropy term serves to favor genes that
are not expressed highly in the tissue of interest, but are
expressed only in a small number of other tissues. As
described earlier, we want to consider such genes as categor-
ically tissue-specific since their expression pattern is very
restricted. Figure 1 shows examples of patterns of GNF-GEA
expression data for different values of H
g
and Q
g|t
. The top
five genes specific to mouse amygdala, lymph node, and liver
as assessed by this data are listed in Table 1. Tables of H
g
and
Q
g|t
values for all genes in all tissues in the GNF-GEA datasets
are available in Additional data files 1 and 2.
To compare results from microarray and EST-based expres-
sion data we mapped the tissues from the GNF-GEA study to
the hierarchical controlled vocabulary of anatomical terms
used by DoTS and chose a set of 45 tissue terms grouped into
32 groups shown in Table 2. In both cases, the vast majority
of genes are widely expressed as measured by H
g
as shown in
Figure 2a. Of the 7,714 probe sets in the GNF-GEA data with
an average normalized intensity value above 50 arbitrary
units (AU), 6,167 (80%) of genes had H
g
≥ 4 bits, which
implies expression in at least 16 tissues and typically corre-
sponds to wider, but uneven, expression. Only 87 (2%) of
genes had H
g
≤ 1.5 bits, which corresponds to expression in as
few as three tissues. Both microarray- and EST-based data
yielded similar overall curves. The EST curve peaked at a
lower H
g
than the microarray curve. This was due to the small
numbers of EST sequences in some of the tissues we consid-
ered; EST counts for tissues ranged from 1,933 in the adrenal
gland to 331,582 in the central nervous system (CNS). Genes
that are ubiquitously expressed may not have ESTs from sev-
eral of the lightly sequenced tissues, making them appear to
have more restricted expression, and hence a lower entropy,
than they really do. Figure 2b shows the correlation between
estimates of H
g
derived from microarray and EST data. Visual
inspection of the plot reveals that while there are no strong
contradictions between the two methods, quantitative agree-
ment is limited. Detailed analysis shows that the standard
deviation of the difference of paired H
g
values is 0.61 bits.
Under the null hypothesis that the estimates from the two
data sources are totally uncorrelated the average standard
deviation was found to be 0.91 bits. We can reject the null
hypothesis (P < 10
-5
as estimated by Monte Carlo methods).
The distribution of Q
g|t
for selected tissues is shown in Figure
2c. These curves can be used to characterize tissues in terms
of the number of tissue-specific genes and the amount of gene
R33.4 Genome Biology 2005, Volume 6, Issue 4, Article R33 Schug et al. />Genome Biology 2005, 6:R33
sharing; for example, liver has a relatively large number of
genes shared with a small number of other tissues. In con-
trast, there were no genes in this set that are uniquely
expressed in the amygdala.
It is important to determine how well the H
g
and Q
g|t
statistics
can be estimated from a dataset to determine the smallest
meaningful difference in scores and to guide interpretation of
gene rankings. To assess the standard deviations of and H
g
and Q
g|t
, we sampled from the replicates in the GNF-GEA
microarray data to compute a large number of H
g
values for
each probe set. We found that the standard deviation for H
g
was less than 0.2 bits for 97% of genes. Q
g|t
was not estimated
as well; the standard deviation was 1 bit or less for 95% of
gene and tissue pairs. This was probably due to the high
standard deviation of the -log
2
(p
t|g
) term for low expressing
gene-tissue pairs. We found much more variation when we
measure reproducibility by considering genes that have two
or more probe sets (and therefore two or more different tran-
scripts) in the microarray data. In this case, the standard
deviation of H
g
estimates was as high as 1 bit for 97% of the
genes but less than 0.3 bits for about 70-80% of the genes. We
chose a minimum of 1 bit for H
g
bins and 2 bits for Q bins in
the rest of the analyses that require binning. This bin size
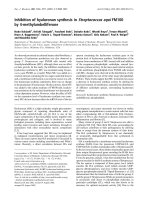
Examples of GNF-GEA expression patterns for mouse genes at selected H
g
and QFigure 1
Examples of GNF-GEA expression patterns for mouse genes at selected H
g
and Q. Liver, indicated in red, is the tissue of interest for Q values. (a) Serum
albumin (94777_at Alb1) shows very specific liver expression: H = 1.3 bits and Q
liver
= 2.1 bits. (b) For liver-specific bHLH-Zip transcription factor
(99452_at Lisch7), liver is a strong but not dominant part of the expression pattern: H = 3.7 bits and Q
liver
= 6.8 bits. (c) For chloride channel 7
(104391_s_at Clcn7) there is near uniform expression: H = 4.3 bits and Q
liver
= 10.2 bits. (d) Gelsolin (93750_at Gsn) is an otherwise widely expressed gene
but is expressed at a very low level in the liver: H = 4.4 bits and Q
liver
= 15.1 bits.
Expression
Expression
Expression
Expression
Adipose
Adrenal_gland
Amygdala
Bladder
Bone
Bone_marrow
Brown_fat
Cerebellum
Dorsal_root_ganglion
Epidermis
Eye
Frontal_cortex
Gall_bladder
Heart
Hippocampus
Hypothalamus
Kidney
Large_intestine
Liver
Lung
Lymph_node
Mammary_gland
Olfactory_bulb
Ovary
Placenta
Prostate
Salivary_gland
Skeletal_muscle
Small_intestine
Spinal_cord
Spleen
Stomach
Striatum
Testis
Thymus
Thyroid
Tongue
Trachea
Trigeminal
Umbilical_cord
Uterus
5,000
10,000
15,000
20,000
25,000
30,000
200
400
600
800
1,000
200
400
600
800
1,000
1,200
2,000
4,000
6,000
8,000
10,000
12,000
(a) (b)
(c) (d)
Genome Biology 2005, Volume 6, Issue 4, Article R33 Schug et al. R33.5
comment reviews reports refereed researchdeposited research interactions information
Genome Biology 2005, 6:R33
ensured that most of the genes are in the proper bin and thus
the bin could be reliably used to determine associations with
the tissue specificity of a class of genes.
Evaluating a set of housekeeping genes
A test of the H
g
and Q
g|t
statistics is to determine values for a
set of nonspecific genes such as housekeeping genes. A list of
797 human housekeeping genes [35] was evaluated using
these statistics based on the GNF-GEA dataset using RefSeq
accession numbers to identify appropriate probe sets. The
housekeeping genes had a mean H
g
= 4.6 ± 0.27 bits in a set
of 27 tissues with a maximum H = lg(27) = 4.75 bits; thus they
are nonspecific as expected. Interestingly, a small number of
these genes did show some degree of tissue specificity yet
were ubiquitously expressed. For example, the median
expression of NM_021983 the major histocompatibility
complex, class II DR beta 4 gene (32035_at) is approximately
200 AU, but it shows much higher expression in a small set of
tissues (spleen, thymus, lung, heart and whole blood), which
lowered its entropy. A more extreme case is NM_001502
glycoprotein 2 (zymogen granule membrane protein 2),
which is expressed between 250 and 1,000 AU in all tissues
except pancreas, where it is expressed at 34,183 AU. This is a
ubiquitously expressed gene that entropy categorizes as spe-
cific since it showed such extreme tissue-specific induction.
The housekeeping genes had a mean Q
g|t
= 9.5 ± 0.14 bits in
the same set of tissues. The expected Q value for a uniformly
and ubiquitously expressed gene is 2 lg(27) = 9.5 bits. Thus,
the H
g
and Q
g|t
statistics successfully captured the expected
expression properties of housekeeping genes.
Most genes are regulated in a tissue-dependent
manner
Although the housekeeping genes assessed above have rela-
tively high entropies, they do show some small degree of over-
all tissue specificity. We therefore sought to determine how
many genes show evidence of tissue-dependent regulation.
Since random biological and experimental variation intro-
duce fluctuations in the expression levels of genes, we made a
probability model of the effect of these fluctuations on the
observed entropy. The experimental variability was estimated
from the GNF-GEA data using all normal tissues. The random
tissue-to-tissue biological variability was modeled by assum-
ing that each gene has an average expression level across all
tissues and that the log base 2 of the tissue-dependent fold
changes from the average level follow a normal distribution
with mean equal to zero and some unknown, but 'small',
standard deviation(s). We obtain a conservative estimate of
the number of genes showing evidence of tissue-dependent
regulation by using s = 0.5, which allows for a relatively large
amount of variation; up to 1.4-fold tissue-to-tissue variation
around the mean expression level in about 63% of tissues and
larger changes in the remaining tissues. As a threshold for
selecting genes with tissue-dependent expression, we choose
H
g
= 4.52 bits which has a p-value of 0.005 under the null
hypothesis that all genes are uniform. We then find that
5,837/8,703 (67%) of human genes have entropies less than
Table 1
The top five most tissue-specific genes for representative tissues
Tissue Probe set ID HQRefSeq Description
Amygdala 96055_at 3.2 5.8 NM_031161 Cholecystokinin
93178_at 2.7 5.8 NM_019867 Neuronal guanine nucleotide exchange factor
93273_at 3.7 5.8 NM_009221 Synuclein, alpha
92943_at 3.5 6.0 NM_008165 Glutamate receptor, ionotropic, AMPA1 (alpha 1)
95436_at 3.3 6.1 NM_009215 Somatostatin
Lymph node 98406_at 2.7 4.0 NM_013653 Chemokine (C-C motif) ligand 5
98063_at 1.6 4.1 - Glycosylation dependent cell adhesion molecule 1
99446_at 2.5 4.1 NM_007641 Membrane-spanning 4-domains, subfamily A,
member 1
92741_g_at 3.3 4.5 - Immunoglobulin heavy chain 4 (serum IgG1)
102940_at 2.8 4.6 NM_008518 Lymphotoxin B
Liver 94777_at 1.3 2.1 - Albumin 1
101287_s_at 1.6 2.2 NM_010005 Cytochrome P450, 2d10
99269_g_at 1.5 2.2 NM_019911 Tryptophan 2,3-dioxygenase
100329_at 1.4 2.3 NM_009246 Serine protease inhibitor 1-4
94318_at 1.6 2.3 NM_013475 Apolipoprotein H
Genes must express at 200 AU in one or more tissues. A full list of all genes is available in the Additional data files 1 and 2.
R33.6 Genome Biology 2005, Volume 6, Issue 4, Article R33 Schug et al. />Genome Biology 2005, 6:R33
this and so are probably regulated in a tissue-dependent man-
ner. If we use a more stringent definition of uniform expres-
sion that allows half as much variation in tissue-to-tissue
expression levels (s = 0.25), then the threshold is H
g
= 4.62
bits and we find that 7,584/8,703 (87%) of human genes show
evidence of tissue-dependent regulation. Similar results are
found in mouse using all 42 distinct tissues, where the corre-
sponding thresholds are H
g
= 5.24 bits (s = 0.5) and H
g
= 5.35
bits (s = 0.25) and the fractions of genes showing tissue-
dependent expression are 5,467/7,913 (69%) and 7,482/7,913
(94%) respectively. Thus we conclude that most genes show
evidence of tissue-dependent expression levels.
Clustering tissues using Q
A test of Q
g|t
with respect to specific genes is to evaluate the
tissues in which they rank highly (that is, have low Q) for con-
sistency. This was accomplished by clustering tissues with
similar tissue-specific genes and inspecting the clusters
formed. We used 27 normal human tissues and, separately,
39 tissues from the GNF-GEA data for mouse and selected the
genes (N = 3,768 human and N = 1786 mouse) that express at
least 200 AU in at least one tissue and have Q
g|t
= 7 in at least
one tissue. With these genes, we made a consensus hierarchi-
cal clustering of the tissues as shown in Figure 3. We found
that the tissues in the nervous system, reproductive struc-
tures (excluding testis), immune system, and digestive sys-
tem reliably cluster together in both species. In addition,
skeletal muscle and heart clustered in mouse; the human sur-
vey did not have skeletal muscle. These results suggest that
Q
g|t
is correctly identifying tissue-specific genes. Interest-
ingly, testis is an outlier in both trees, indicating that the col-
lection of genes expressed in testis are distinct from any other
tissue or organ. Furthermore, H
g
and Q
g|t
can also be used in
conjunction with a tissue hierarchy to answer more complex
questions about the tissue distribution of genes such as 'what
genes are specific to the brain but are widely expressed
throughout the brain?' In Table 3 we list the top five mouse
Table 2
The list of tissues used in this study
GNF+GEA tissues Comparison to
EST
Hierarchical
clustering
DRG PNS Nervous system
Trigeminal CNS
Hippocampus CNS
Amygdala CNS
Frontal_cortex CNS
Cortex CNS
Striatum CNS
Olfactory_bulb CNS
Hypothalamus CNS
Spinal_cord_lower CNS
Spinal_cord_upper CNS
Cerebellum CNS
Eye Eye
Spleen Spleen Immune System +
trachea
Lymph_node Lymph_node
Trachea Trachea
Thymus Thymus
Bone_marrow Bone
Bone Bone
Lung Lung
Uterus Uterus Reproductive organs
Umbilical cord Umbilical_cord
Placenta Plancenta
Ovary Ovary
Epidermis,
snout_epidermis
Epidermis
Heart Heart Muscle
Skeletal_muscle Skeletal_muscle
Adipose_tissue,
brown_fat
Fat
Adrenal_gland Adrenal_gland
Stomach Stomach Digestive tract
Bladder Bladder
Small_intestine Small_intestine
Large_intestine Large_intestine
Gall bladder Gall_bladder Gall bladder, liver,
and kidney
Liver Liver
Kidney Kidney
Salivary_gland Salivary_gland
Thyroid Thyroid
Mammary_gland Mammary_gland
Prostate Prostate
Testis Testis
Tongue Tongue
Digits Digits
The list of tissues available in the mouse GNF+GEA survey, groupings
of tissues used to compare microarray and EST-based entropy
estimates, and tissue groups discovered by clustering tissues on the
basis of genes expressed in common.
Table 2 (Continued)
The list of tissues used in this study
Genome Biology 2005, Volume 6, Issue 4, Article R33 Schug et al. R33.7
comment reviews reports refereed researchdeposited research interactions information
Genome Biology 2005, 6:R33
genes expressed specifically but uniformly across three of the
highlighted groups in Figure 3b.
CpG islands are associated with the least tissue-specific
genes
It has been proposed that CpG islands are predominantly
associated with promoters of housekeeping genes [2]. We
performed a quantitative test of this hypothesis using the
GNF-GEA data and determining the frequency of CpG islands
in promoters as a function of H
g
. We considered only pre-
dicted CpG islands that span the start of transcription (see [3]
for a justification of this definition), and genes that expressed
at least at the median level of 200 AU (that is, were moder-
ately expressed) in at least one tissue, and were represented
by a single probe set on the Affymetrix chip used in the GNF-
GEA experiments. Promoter sequences were obtained from
DBTSS and were based on the 5' ends of full-length tran-
scripts [17]. We found that there is a strong, roughly linear,
correlation between a gene's entropy H
g
and the probability
that the gene will have a predicted start CpG island as shown
in Figure 4. Start CpG islands were associated with only nine
of the 100 most tissue-specific human genes as compared to
80% of the least tissue-specific genes. Similar numbers were
found for mouse (7% start CpG island frequency for the 100
most tissue-specific genes; about 64% for the least tissue-spe-
cific genes). A comparison of CpG islands from the most and
least tissue-specific genes did not reveal any significant dif-
ference in the overall base composition, or ratio of observed
to expected CpG dinucleotides. The distribution of the posi-
tion of the 5' end point of CpG islands was also very similar for
the most and least tissue-specific genes though CpG islands
tend to start further upstream in the least tissue-specific
genes (data not shown).
Another group of genes observed to be associated with CpG
islands are those expressed in the early embryo [3] from the
fertilized egg to the blastocyst. The question arises as to
whether there is an association of genes having start CpG
islands and the developmental stage of expression (that is,
embryonic versus adult) in addition to the one for tissue spe-
cificity. We investigated this possibility in the mouse using
DoTS [33] EST and mRNA assemblies by tabulating the
Table 3
The top five most group-specific mouse genes for selected tissue groups
Tissue cluster Probe Set ID HQRefSeq Description
Nervous system 100047_at 3.3 3.4 NM_011428 Synaptosomal-associated protein, 25
kDa
103030_at 3.5 3.6 Dynamin
97983_s_at 3.7 3.8 NM_009295 Syntaxin binding protein 1
98339_at 3.7 3.8 NM_018804 Synaptotagmin 11
94545_at 3.7 3.8 NM_153457 Reticulon 1
Immune system 96648_at 2.807 2.882 NM_009898 Coronin, actin binding protein 1a
93584_at 3.373 3.622 Immunoglobulin heavy chain 6 (heavy
chain of IgM)
101048_at 3.541 3.876 NM_011210 Protein tyrosine phosphatase,
receptor type, C
94278_at 3.495 3.923 NM_008879 Lymphocyte cytosolic protein 1
100156_at 3.609 4.039 NM_008566 Mini chromosome maintenance
deficient 5
Liver and gall
bladder
94777_at 1.280 1.326 Albumin 1
100329_at 1.394 1.464 NM_009246 Serine protease inhibitor 1-4
99269_g_at 1.471 1.561 NM_019911 Tryptophan 2,3-dioxygenase
99862_at 1.503 1.595 NM_013465 Alpha-2-HS-glycoprotein
96846_at 1.515 1.607 NM_080844 Serine (or cysteine) proteinase
inhibitor, clade C (antithrombin),
member 1
The tissue groups were identified in a consensus clustering of tissues based on common tissue-specific genes. The Q value is for the gene and tissue
group. To ensure uniform expression across the tissue group, genes were required to have an entropy on the tissue group that was 90% of the
maximum possible for the group.
R33.8 Genome Biology 2005, Volume 6, Issue 4, Article R33 Schug et al. />Genome Biology 2005, 6:R33
number of DoTS genes that contain at least two ESTs from a
mouse early embryo library as shown in Table 4. We
considered 933 genes with start CpG islands (CGI+) and
1,007 genes without start CpG islands (CGI-) that were
expressed in the adult. If there were no developmental bias,
this distribution of CpG+ and CpG- genes should be main-
tained in genes expressed in the embryo. However, only 139
(14%) of the CGI- genes were expressed in the early embryo in
contrast to 365 (39%) CGI+ genes (P = 3 × 10
-70
exact bino-
mial). Therefore, a gene expressed in the adult was 2.8 (=
0.39/0.14) times more likely to be expressed in the early
embryo if it contained a start CpG island. Furthermore, the
most tissue-specific genes expressed in the adult were four
times more likely to have been expressed in the early embryo
if their promoter contained a start CpG island. These results
strongly suggest that CpG islands are promoter features for
both embryonic and the least tissue-specific genes.
Base composition of promoters depends on specificity
Analysis of base-composition profiles of promoters provides
clues to common features, including motifs associated with
promoter categories. We examined the base composition pro-
files of human promoters of high (0 ≤ H
g
≤ 3.5 bits) and low
(4.4 ≤ H
g
≤ 4.71 bits) tissue-specificity genes. We considered
CGI+ and CGI- genes separately, as it is clear the presence of
a CpG island will strongly influence the base composition and
that the fraction of start CpG islands varies with entropy. In
addition, the presence of a start CpG island may indicate a dif-
ferent regulation mechanism related to either tissue specifi-
city or embryonic expression (or both). The number of
promoters from DBTSS in these four classes that were used in
the analysis were: 310 CGI- and 129 CGI+ high specificity;
342 CGI- and 1,501 CGI+ low specificity. Genes that have only
non-start CpG islands represented a minor component and
were not included in this analysis. We used the full set of nor-
mal tissues in the first GNF-GEA microarray study for human
and mouse. Base composition profiles with 10 base-pair (bp)
windows are shown in Figure 5 for human genes. Each of the
features we report were observed in human and mouse
(unless noted otherwise) and compare G to C or A to T over
spans of at least 10 positional bins; the probability of observ-
ing a feature at least this long by chance is less than 0.5
10
which is equivalent to 0.001. Promoters of CGI+ genes (Fig-
ure 5a,b) shared features but could also be distinguished on
the basis of tissue specificity. A common feature of CGI+ pro-
moters was the increase in C+G content that starts at 1,000
bp upstream of the transcription start site and continues at
200 bp downstream. The C+G bias reached p(C+G) = 0.7 at
the start of transcription and continued into the 5' UTR. Non-
specific (Figure 5c) and tissue-specific (Figure 5d) CGI- genes
still showed a C+G bias around the start of transcription, but
it was much smaller in magnitude at p(C+G) = 0.54. The low
specificity CGI+ genes (Figure 5a) showed upstream base
composition biases that were not found in any of the other
three gene classes. There was a preference for C over G (p(C)
> p(G)) in the (-350, -150) region and also a preference for
p(A) > p(T) in the -600, -200 region in human (this region is
located (-400, -150) in mouse). In tissue-specific CGI+ (Fig-
ure 5b) genes the strong C+G bias held but p(C) = p(G), except
for the (+50, +100) region where p(C) > p(G). These base-
composition differences observed between nonspecific and
tissue-specific promoters over regions of hundreds of base-
pairs, even in the context of a CpG island, suggest different
structural features and regulatory mechanisms for these
CGI+ classes.
Most striking were differences between nonspecific and tis-
sue-specific promoters that are independent of the presence
of a CpG island. A sharp spike in the proportion of A and T
was seen in the (-50,-1) region for all classes but was most
pronounced in the tissue-specific promoters (Figure 5b,d).
These spikes correspond to the presence of a TATA box and
suggest a correlation of this motif with tissue-specific genes
(explored more fully later). Conversely, all low-specificity
genes (Figure 5a,c) shared a common feature in the (+1,
+200) region where p(G) > p(C) and p(T) > p(A) that was not
Table 4
CpG islands are correlated with embryonic expression even for tissue-specific genes
Gene type CpG island state Total genes
considered
Expressed genes Fraction Fraction ratio
Embryo CGI+ 933 365 39% 2.8
CGI- 1007 139 14%
Adult-specific CGI+ 29 8 29% 4
CGI- 180 12 7%
We determined the fraction of genes with (39%) and without (14%) start CpG islands that are expressed in the early embryo. A gene is 2.8 (= 0.39/
0.14) times more likely to be expressed in the early embryo if it has a start CpG island. If we then consider genes that go on to be specific in the
adult, we find the ratio of CGI+/CGI- genes is now 4 = 0.28/0.07. The differences in rates between CpG island status within each stage are significant
(P < 0.0005; binomial). Of the between-stage comparisons, only the CGI- adult-specific/embryo change is significant (P = 0.0009; hypergeometric).
Genome Biology 2005, Volume 6, Issue 4, Article R33 Schug et al. R33.9
comment reviews reports refereed researchdeposited research interactions information
Genome Biology 2005, 6:R33
seen in tissue-specific genes (Figure 5b,d). As shown later,
this low-specificity feature could be partially explained by the
presence of a YY1 motif. These base-composition differences
observed between nonspecific and tissue-specific promoters
are likely to indicate motifs that distinguish the two classes.
Selected transcription factor motifs in the core
promoter
We next examined the distribution of basic core promoter
features: the TATA box, the initiator element, and two bind-
ing sites for selected ubiquitous transcription factors, Sp1 and
YY1, to see if their presence in the proximal promoter was cor-
related with the tissue specificity of a gene. Two approaches
were taken using different datasets and motif-searching
methods that gave similar results, providing independent
confirmation of results. First, we searched for core motifs
using weight matrix hits in promoters of genes selected using
H
g
calculated from the GNF-GEA data. Second, we searched
for core motif consensus sites in promoters of genes selected
using Q
g|t
calculated from EST data.
TATA boxes are associated with tissue-specific genes
We grouped the human genes that expressed at least 200 AU
(average value) in the GNF-GEA data by entropy and start
CpG island status. The number of genes in each category is
shown in Table 5 along with a summary of results. We used
alignments of position-specific scoring matrices and scoring
thresholds included in the Eukaryotic Promoter Database
(EPD) [36] to identify the TATA box and initiator element.
Matches to these motifs were preferentially located at the
expected positions relative to the transcription start site
based on the ratio of the number of observed set to the
expected number using a set of random sequences with the
same position-dependent base composition as each of the
promoters.
We searched for the TATA box in the (-45, -10) region where
the average observed/expected ratio for the TATA box was
3.1. As shown in Table 5, the most-specific CGI- genes were
six times more likely to have a TATA box than the least-spe-
cific CGI+ genes (117/215 (54%) versus 183/2072 (9%), P ≈ 0
exact binomial). Similar numbers are found in mouse (52%/
11% = 4.7) This trend also holds within CGI- genes and CGI+
genes. The most specific CGI- genes were three times more
likely to have a TATA box than the least specific CGI- genes
(117/215 versus 110/607, P ≈ 0 exact binomial). While less
common in CGI+ genes, TATA boxes were still almost four
times as likely to be found in the most specific CGI+ genes
than the least specific CGI+ genes (19/56 versus 183/2,072, P
= 2 × 10
-7
exact binomial). Thus TATA boxes are clearly
associated with tissue-specific genes and provide a second
axis (with CpG islands) for distinguishing between the most
and least specific genes.
In contrast, the frequency of occurrences of the initiator ele-
ment (Pol II binding site) was roughly constant across all tis-
sue-specificity classes for both CGI+ and CGI- genes. We
searched for the initiator element in the (-10, +10) region. It
occurred in 762 of 1,118 (68%) of CGI- genes and 1,273 of
2,434 (52%) of CGI+ genes. Similarly, it occurred in 149 of
215 (69%) of the most specific genes and 388 of 607 (64%) of
CGI+ genes. The observed frequency of TATA+/Inr+ promot-
ers was not significantly different from the expected rate
assuming independence of the two individual features (data
not shown).
Sp1-binding sites are weakly associated with the least
tissue-specific genes
Sp1 [37,38] is a ubiquitous transcription factor with a G-rich
binding site with consensus sequence GGGCGGG that might
explain the observed G-richness of the 5' UTR in non-specific
genes. We used the GC-box weight matrix and scoring
threshold from EPD [36] to identify Sp1 sites. We found that
Sp1 sites are preferentially located in the (-150, +1) region in
all sets of genes where they occurred on average at twice the
expected rate in agreement with previous findings [36]. In
both human and mouse, Sp1 sites were rarely found in the 5'
UTR despite the G-richness of this region; they occurred at
the expected rate of between 2 and 5%. Thus Sp1 sites were
not the cause of the G-richness in the 5' UTR.
Sp1 sites are associated with CpG islands but are an important
component of GGI- promoters as well. Considering just the (-
150, +1) region, Sp1 sites occurred in 1,105/2,434 (45%) of
human CGI+ gene promoters, and 316/1,118 (28%) of CGI-
genes at about 2.5 to 3.0 times the expected frequency in both
cases. Frequencies in mouse are 927/2075 (45%) of CGI+
promoters and 464/1652 (28%) CGI- promoters. Sp1 sites
were also weakly associated with the least specific genes
occurring in 1,105/2,679 (41%) of these genes as compared to
94/271 (32%) in the most tissue-specific genes (P = 0.016).
Similar numbers are found in the mouse; 38% of the least
specific and 26% of the most specific promoters have Sp1
sites. Thus, although Sp1 shows a preference for the least tis-
sue-specific promoters, it is not a strong predictor of the tis-
sue specificity of a gene.
YY1 binding sites are associated with low-specificity
genes
The transcription factor YY1 [5-8] is also ubiquitously
expressed and is thought to bind close to [39] and down-
stream of the transcription start site. There is evidence that
the function of YY1 depends on its orientation [40]. The loca-
tion and G-richness of the reverse complement consensus
sequence (AANATGGCG) make YY1 a candidate for explain-
ing the prominent G > C feature in the (+1, +200) region of
low-specificity genes. We consider YY1 because a YY1-like
motif was frequently included among the most statistically
significant motifs identified by the motif discovery programs
AlignACE [41] and MEME [42] in the (+1, +60) region of non-
specific CGI+ promoters (Figure 6a). Our form is most similar
to the activating form [43], which may be associated with low-
R33.10 Genome Biology 2005, Volume 6, Issue 4, Article R33 Schug et al. />Genome Biology 2005, 6:R33
Figure 2 (see legend on next page)
N (0.1H bins)
H (bits)
DoTS (EST)
GNF-GEA (microarray)
1
2
3
4
5
H (Novartis)
1
2
3
4
5
H (DoTS)
N [0.1x0.1 H bins]
012345678910
Number of genes (cumulative)
Q (bits)
Mammary gland
Liver
Skeletal muscle
Amygdala
Average
1
10
100
1,000
10,000
0 0.5 1 1.5 2 2.5 3 3.5 4 4.5 5
≥ 30 ESTs
≥ 100 ESTs
1
10
100
1,000
1
10
100
1,000
10,000
(a)
(b)
(c)
Genome Biology 2005, Volume 6, Issue 4, Article R33 Schug et al. R33.11
comment reviews reports refereed researchdeposited research interactions information
Genome Biology 2005, 6:R33
specificity genes. Because of the demonstrated functional
sensitivity to the orientation of binding sites we considered
each orientation separately. Indeed, as shown in Figure 6b we
found each orientation exhibits different position prefer-
ences. Sites in the reverse orientation (YY1
r
) were preferen-
tially located in the (+1, +25) region but with some elevated
levels to +80 bp. Start positions of sites in the forward
orientation (YY1
f
) showed a very sharp preference for -3 bp,
which probably represents a YY1-like initiator sequence
reviewed elsewhere [44]. Both orientations were found pre-
dominantly in the least specific genes (Table 5). YY1
f
initiator
sites are rare; only 55/2,679 (2%) were found above back-
ground in human low-specificity genes. The rate in mouse,
22/2,832 (0.8%) of low-specificity promoters, is even lower.
The YY1
r
sites are more common and were found above back-
ground in 217 (8%) of the 2,679 least specific genes. YY1
r
sites
were more common in CGI+ genes than in CGI- genes (202/
2,072 (10%) versus 15/607 (2%) P = 3.7 × 10
-9
two-population
binomial). The corresponding rates in mouse confirm these
observations; 178/2,832 (6%) for all low-specificity genes and
152/1,779 (9%) in CGI+ and 26/1,053 (2%) of CGI- low-spe-
cificity promoters. These YY1-like sites therefore constitute a
feature strongly associated with the least specific genes and
may partially explain the observed G > C ratio in the (+1,
+200) region.
Q-based analysis of core promoter motifs
A second analysis of TATA box and Inr motifs was done to
determine if the association of the TATA box with tissue-spe-
cific genes is also found in genes ranked by Q and is robust to
using EST data as well as promoters that did not specifically
rely on full-length cDNA clones. The definition of Q implies
that genes with a particular Q-value can have a variety of H
g
values and thus it may be more difficult to identify features
related to tissue specificity. We tabulated all DoTS genes that
contained at least two ESTs from an islet-cell library then
ranked the genes by Q
pancreas
computed using EST counts. We
used Q
pancreas
≤ 7 bits as the criterion for selecting pancreas-
specific genes which we grouped into 2-bit Q intervals. For
comparison we selected 50 genes with Q
pancreas
= 8.5 bits, and
50 genes with 10 ≤ Q
pancreas
≤ 10.6 bits. Genes with high spe-
cificity for the pancreas (0 ≤ Q
pancreas
≤ 2 bits, N = 9) preferen-
tially had TATA boxes (8 of 9) with half of these also having
an initiation element (4 of 9; Figure 7a). With decreasing spe-
cificity, the fraction of genes containing TATA boxes drops
with only18 of 81 (2/9) genes with Q > 6 bits having TATA
boxes. Thus, the strong correlation of TATA boxes with
specific genes found with H
g
and microarray data was also
seen with Q and EST data for pancreas-expressed genes. Also
consistent is the observation that initiator elements were
found at similar frequencies (around 60%) across all
specificity classes (Figure 7b). Similar patterns were observed
in other tissues (data not shown).
The consistency of findings for the TATA box with human
islet genes based on Q and ESTs was next tested with orthol-
ogous genes in mouse. This test provides a measure for
whether the global pattern observed (TATA box with tissue-
specific genes) is also found for the same set of genes in
another mammal. We also added bins of genes with higher Q-
values that represent more widely expressed genes. For each
human gene, the orthologous mouse gene was determined
(see Materials and methods for details) and analyzed as
described above. Overall, 18.8% of the human genes and
22.9% of the mouse genes that were analyzed carry the TATA
box motif. Except for the last group (Q >10 bits) the percent-
age of the genes with TATA box motifs decreases with the
increase in the Q-value. This is to be expected since genes
with high Q may be specific to other tissues and hence are
more likely to have a TATA box. Discrepancies between
human and mouse promoters were noted for only about 10%
of all human-mouse pairs analyzed and may reflect sequence
differences and possible annotation discrepancies for the
transcription start site. Nevertheless, there is overall excellent
agreement for the presence of TATA motifs in human and
mouse genes. Thus, our assessment of preferential presence
of transcription regulatory motifs in the human pancreas-
expressed genes also applies to their mouse orthologs. We
conclude that genes expressed with restricted tissue-distribu-
tion may be preferentially regulated via TATA-mediated tran-
scription, and that genes with broader expression profiles are
more likely to be regulated by non-TATA mediated mecha-
nisms (such as YY1).
Promoter classes
Since the presence or absence of a start CpG island and a
TATA box appear to be the primary sequence feature that cor-
relate with tissue specificity, we consider them in more detail.
We observe that CpG islands and TATA boxes are not mutu-
ally exclusive features of promoters and so we consider all
possible combinations of these features.
Frequency of promoter classes
Figure 8 shows the cumulative fraction of each class of pro-
moter as a function of increasing H
g
in human (Figure 8a) and
mouse (Figure 8b). The data from human and mouse follow
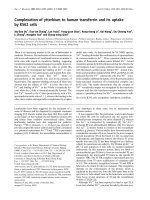
Distributions of H and Q for different data sources and tissuesFigure 2 (see previous page)
Distributions of H and Q for different data sources and tissues. (a) Distribution of H as estimated from GNF-GEA (red line) and DoTS (blue line). The
DoTS curve was generated from genes with at least six ESTs. (b) Correlation of H estimates from GNF-GEA and DoTS. Genes with at least 30 ESTs are
shown in red; those with more than 100 ESTs in blue. (c) Cumulative distribution of Q values for selected mouse tissues and the average for all 39 tissues.
Mammary gland, liver, muscle and the amygdala have decreasing numbers of highly tissue-specific genes. Liver has a very large number of relatively specific
genes. All distributions peak at 2 log
2
(39) = 10.6 bits and have a tail at high Q (not shown) that corresponds to genes that are ubiquitously expressed
except in the tissue of interest.
R33.12 Genome Biology 2005, Volume 6, Issue 4, Article R33 Schug et al. />Genome Biology 2005, 6:R33
similar trends even though the mouse has a lower proportion
of CGI+ genes. Overall, CGI+/TATA- genes are the most com-
mon, at 50-60% depending on the species. Interestingly, the
CGI-/TATA- class is the second most common overall, com-
prising 20-30% of genes, depending on the species. Genes in
this promoter class are roughly equally common across the
entire entropy range and are the most common promoters in
the mid-specificity range in both species. The classes CGI-/
TATA+ and CGI+/TATA+ are the least common (8 to 12%
overall). CGI-/TATA+ genes are concentrated in the most
specific genes. CGI+/TATA+ are found relatively uniformly
across all but the most specific genes. Although the TATA box
and CpG islands are strongly predictive of a gene's entropy,
Figure 8 also illustrates the limitations of the promoter
classes as an explanation for expression patterns. First,
although the CGI-/TATA+ and CGI+/TATA- classes are
strongly associated with the most and least tissue-specific
genes (respectively), instances of genes in each class cover
virtually the entire range of tissue specificities. Second, the
CGI-/TATA- class is the second most common, illustrating
that any degree of tissue specificity can be obtained without
these sequence features.
Functional assessment of promoter classes using Gene
Ontology terms
To try to understand the functional correlates of the four pro-
moter classes, we looked for trends in the cellular localization
and biological process of the products of genes from each pro-
moter class. We used the DAVID system [45,46], which iden-
tifies over-represented Gene Ontology (GO) [47] terms in a
set of genes. A summary of the results for human and mouse
genes are shown in Table 6. In each case the set of genes in
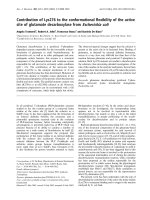
Consensus tissue tree of tissues from human and mouse dataFigure 3
Consensus tissue tree of tissues from human and mouse data. Trees are
the consensus of trees created from 5,000 random samples of sets of
1,000 genes from (a) 3,768 (human) or (b) 1,786 (mouse) genes with Q
g|t
≤ 7 bits in at least one tissue. The length of the line leading into a node
indicates how many trees did not include the set of tissues to the right of
the node. The shortest lines correspond to unanimous subgroups. We
have highlighted all maximal subgroups that occurred in at least half of the
sampled trees. The nervous system is indicated in red, immune system in
blue, reproductive tissue in yellow, digestive organs in purple and magenta,
muscle tissue in cyan, and glandular tissue in brown. All maximal
subgroups that occurred in at least half of the sampled trees. The tissues
not included in a highlighted subgroup typically have statistically significant
overlap with many of the highlighted tissues as estimated using the
hypergeometric distribution.
thyroid
trachea
salivary gland
heart
adrenal gland
DRG
pituitary gland
placenta
uterus
ovary
prostate
cortex
amygdala
whole brain
thalamus
caudate nucleus
cerebellum
spinal cord
corpus callosum
blood
thymus
spleen
lung
pancreas
kidney
liver
testis
amygdala
hippocampus
frontal cortex
striatum
olfactory bulb
hypothalamus
spinal cord
cerebellum
trigeminal
DRG
eye
ovary
placenta
umbilical cord
uterus
fat
adrenal gland
epidermis
heart
skeletal muscle
spleen
lymph node
trachea
thymus
bone
bone marrow
lung
small intestine
large intestine
stomach
bladder
liver
gall bladder
kidney
salivary gland
thyroid
mammary gland
prostate
testis
(a)
(b)
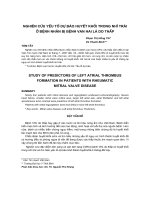
The fraction of start CpG islands in genes ranked by entropy H
g
increases with entropyFigure 4
The fraction of start CpG islands in genes ranked by entropy H
g
increases
with entropy. Each point represents the fraction of genes in consecutive
groups of 100 genes ranked by entropy H
g
computed from GNF-GEA data.
Genes in this set are expressed above 200 AU in at least one tissue. The
human dataset (diamonds) has 26 tissues (maximum H = 4.7 bits), the
mouse dataset (squares) has 42 tissues (maximum H = 5.3 bits).
0123456
Entropy
Fraction of promoters with
CpG island
Human
Mouse
0
0.1
0.2
0.3
0.4
0.5
0.6
0.7
0.8
0.9
Genome Biology 2005, Volume 6, Issue 4, Article R33 Schug et al. R33.13
comment reviews reports refereed researchdeposited research interactions information
Genome Biology 2005, 6:R33
each promoter class were compared to all genes on the corre-
sponding Affymetrix chip.
Products of genes in the CGI-/TATA+ class were often (70/
198) located extracellularly. Examples of such genes are the
insulin-like growth factor family, serum albumin and chymo-
trypsin. Some extracellular CGI-/TATA+ genes, such as lutei-
nizing hormone beta (LHB) and bone morphogenetic protein
10 (Bmp10) in the mouse, have a high H
g
because they are not
induced in the tissues or at the developmental stages sur-
veyed, but otherwise fit the pattern of secreted proteins. Gene
products that are secreted from the cell must be produced at
high level to be effective. Indeed we found the maximum
expression level of TATA+ genes is higher than TATA- genes;
454/745 (61%) of TATA+ genes express at least 1,000 AU in
one or more tissues, whereas only 1,321/3,773 (35%) of
TATA- genes express that highly (p-value = 0; two-sample
binomial population). A second group of CGI-/TATA+ that is
common, but with a p-value just over the p-value cutoff are
the muscle contraction-related genes, actin, troponin and
members of the myosin family. Products of these genes are
also required in large amounts to create the contractile appa-
ratus but are only produced in a few cell types. The biological
processes that are enriched in the CGI-/TATA+ class differ
between human and mouse, but nearly all of them are
descendants of the GO term 'response to stimulus'
(GO:0050896).
Base-composition profiles for ubiquitous and tissue-specific genes with and without start CpG islandsFigure 5
Base-composition profiles for ubiquitous and tissue-specific genes with and without start CpG islands. Data is for human genes; similar patterns were
observed in mouse. (a) Ubiquitous genes with a CpG island; (b) tissue-specific genes with a CpG island; (c) ubiquitous genes with no CpG island; and (d)
tissue-specific genes with no CpG island. Note differences in upstream C+G content, peak sizes at TATA box (-35 bp) and initiator positions, and
downstream C versus G differences.
Probability (10 bp bins)
Position (bp)
A
C
G
T
0
0.05
0.1
0.15
0.2
0.25
0.3
0.35
0.4
0.45
0.5
−1000 −800 −600 −400 −200 0 200
Probability (10 bp bins)
Position (bp)
0
0.05
0.1
0.15
0.2
0.25
0.3
0.35
0.4
0.45
0.5
−1000 −800 −600 −400 −200 0 200
Probability (10 bp bins)
Position (bp)
0
0.05
0.1
0.15
0.2
0.25
0.3
0.35
0.4
0.45
0.5
−1000 −800 −600 −400 −200 0 200
Probability (10 bp bins)
Position (bp)
0
0.05
0.1
0.15
0.2
0.25
0.3
0.35
0.4
0.45
0.5
−1000 −800 −600 −400 −200 0 200
A
C
G
T
A
C
G
T
A
C
G
T
(a) (b)
(c) (d)
R33.14 Genome Biology 2005, Volume 6, Issue 4, Article R33 Schug et al. />Genome Biology 2005, 6:R33
Table 5
The most significant indicators of the degree of tissue specificity: start CpG island, TATA box, and YY1 site
Features Total fraction H 0-3 H 3-4 H 4-5
CGI TATA YY1 Most specific Semi-specific Least specific
3,552 271 602 2679
1.00 0.08 0.17 0.75
CGI+ 2,434 56 306 2072
0.69 0.02 0.13 0.85
0.30 0.74 1.13
CGI- 1,118 215 296 607
0.31 0.19 0.26 0.54
2.52 1.56 0.72
TATA+ 604 136 175 293
0.17 0.23 0.29 0.49
2.95 1.71 0.64
TATA- 2,949 135 427 2,387
0.83 0.05 0.14 0.81
0.60 0.85 1.07
CGI+ TATA+ 284 19 82 183
0.08 0.07 0.29 0.64
0.88 1.70 0.85
CGI- TATA+ 320 117 93 110
0.09 0.37 0.29 0.34
4.79 1.71 0.46
CGI+ TATA- 2,150 37 224 1,889
0.61 0.02 0.10 0.88
0.23 0.61 1.16
CGI- TATA- 798 98 203 497
0.22 0.12 0.25 0.62
1.61 1.50 0.83
YY1+ 293 1 16 276
0.08 0.00 0.05 0.94
0.04 0.32 1.25
CGI+ YY1+ 261 1 10 250
0.07 0.00 0.04 0.96
0.05 0.23 1.27
CGI+ YY1- 2,173 55 296 1,822
0.61 0.03 0.14 0.84
0.33 0.80 1.11
Genome Biology 2005, Volume 6, Issue 4, Article R33 Schug et al. R33.15
comment reviews reports refereed researchdeposited research interactions information
Genome Biology 2005, 6:R33
The CGI+/TATA- promoters produce proteins that are typi-
cally located in the cell, especially in the cytoplasm and mito-
chondrion. These locations are consistent with many
housekeeping functions. The human results for biological
process suggests a large number of housekeeping processes,
but these were not confirmed in the mouse using all CGI+/
TATA- genes. When we consider just the least specific CGI+/
TATA- mouse genes (4.45 ≤ H
g
≤ 5.57 bits), we find cellular
locations (including the nucleus) and biological processes
that match the human results.
No significant concentrations of cellular locations or biologi-
cal processes were found among the CGI+/TATA+ genes. A
manual examination of genes in both human and mouse iden-
tifies a number of heat-shock proteins, histones and ribos-
omal proteins although these are not statistically significant
as a result of the multiple testing correction. Many of these
genes fit the expected expression pattern in that they are
widely expressed and at high levels.
Interestingly, the products of CGI-/TATA- genes are often
located in the plasma membrane (244/499 of human genes
with a cellular location) and support signaling and response
to the environment. Such products, for example, bradykinin
receptor B2, prolactin receptor or protocadherin 9, may be
expressed in a tissue-specific pattern, but not at the high lev-
els required for secreted proteins. The exact biological proc-
ess GO terms that are statistically significant vary between
mouse and human, but a common core includes defense
response (GO:0006952), immune response (GO:0006955)
and response to stimulus (GO:0050896). Thus these genes
are similar to CGI-/TATA+ genes in that they are involved in
response, but are not (typically) required to be expressed at
such high levels.
Discussion
We have applied Shannon entropy as a novel measure of over-
all tissue specificity of gene expression and have created a
new statistic Q to assess the categorical specificity of a gene
for a particular tissue. We have evaluated the performance of
entropy on microarray-and EST-based estimates of tissue-
specific expression and found that it correctly identifies both
tissue-specific and housekeeping genes. Ranking and binning
genes by entropy allowed us to begin to deconstruct core pro-
moters into features directing when and where the gene will
be expressed. We verified and extended previous observa-
tions [2] about the correlation of CpG islands with house-
keeping genes and embryonic genes. We then identified
differences in the base composition profile of promoters of
tissue-specific and nonspecific genes. Next, we identified cor-
relations between, on the one hand, the TATA box and tissue-
specific genes, and on the other hand, the YY1 site and non-
specific genes. Finally, we identified trends in promoter
classes based on CpG island and TATA box status and associ-
ated them with common cellular locations and biological
processes. Similar observations were also observed for TATA
box and Q-selected genes in pancreas.
The identification of an association between promoter type
and cellular location and biological function, while an impor-
tant step in a fundamental understanding of biology, also has
practical significance, as the genes in the CGI-/TATA+ and
CGI-/TATA- classes are enriched for tissue-specific extracel-
lular and cell surface proteins. Such genes are likely to be use-
ful drug targets. Thus entropy H
g
and Q have allowed us to
discover fundamental properties of mammalian Pol II
promoters and should allow serve to aid understanding of
expression in particular tissues of interest.
The validity of our approach is supported by findings in other
work and by the fact that they are robust with respect to the
CGI- YY1- 1,086 215 290 581
0.31 0.20 0.27 0.53
2.59 1.58 0.71
CGI- YY1+ 320626
0.01 0.00 0.19 0.81
0.00 1.11 1.08
The three columns on the left indicate the combination of features considered; empty cells indicate that the feature is not considered. The 'Total
fraction' column indicates the number of promoters with each feature combination (in bold) and the corresponding fraction of all genes considered.
The three columns on the right give statistics for matching genes in three bands of tissue specificity. The top two lines give the number and
corresponding fraction of all genes considered for each band. For each feature combination, the numbers indicate the number (top, bold), fraction
(middle), and enrichment ratio (bottom) of matching genes. The enrichment ratio is the fraction of promoters of genes in the entropy band that
contain a feature divided by the band's fraction among all genes considered. For example, specific genes are best recognized by a combination of
TATA box (TATA+) and lack of a CpG island (CGI-), which enriches the fraction of such genes from 8% to 37% - a factor of 4.79. Nonspecific genes
are most specifically recognized by CpG islands and YY1 sites, which returns a set that is 96% nonspecific genes, but only matches 7%/75% = 10% of
the nonspecific genes.
Table 5 (Continued)
The most significant indicators of the degree of tissue specificity: start CpG island, TATA box, and YY1 site
R33.16 Genome Biology 2005, Volume 6, Issue 4, Article R33 Schug et al. />Genome Biology 2005, 6:R33
Figure 6 (see legend on next page)
1
2
3
4
5
6
7
8
9
0
1
2
bits
0
5′ 3′
5′ 3′
5′ 3′
1
2
bits
0
1
2
bits
1
2
3
4
5
6
7
8
9
10
11
12
13
14
15
16
17
1
2
3
4
5
6
7
8
9
10
11
12
13
14
15
16
17
18
19
20
A 8 5 0 0 102 0 2 6 0
C 87 9 102 102 0 0 70 0 11
G 7 89 0 0 0 0 22 0 0
T 0 8 0 0 0 102 8 96 91
Number of genes
Position (bp)
Reverse
Forward
Repressing form: TRANSFAC M00059
Activating form: TRANSFAC M00069
AlignACE Motif from 5' UTRs
0
10
20
30
40
50
60
70
80
−400 −300 −200 −100 0 100 200
(a)
(b)
Genome Biology 2005, Volume 6, Issue 4, Article R33 Schug et al. R33.17
comment reviews reports refereed researchdeposited research interactions information
Genome Biology 2005, 6:R33
algorithm used to process the expression data. Our finding
that most genes are regulated in a tissue-dependent manner
is consistent with another analysis of gene expression [14],
which found that housekeeping genes cluster in a tissue-spe-
cific manner. Thus, it appears, even the most basic biological
functions are subject to regulation. The tissue trees we pro-
duced contain relationships similar to those in an analysis
[48] of mid-specificity genes, including the close relation
between lung, and the immune system-related organs spleen
and thymus. That analysis is based on a different method and
a different set of expression data gives us confidence that Q
g|t
is properly identifying genes that are specific to a tissue. The
GNF-GEA expression data we analyzed was processed with
the MAS4 [49] algorithm. We reanalyzed the data from this
study after reprocessing it with the more recent Robust Mul-
tichip Average (RMA) algorithm [50]. This algorithm tends to
suppress low-level signals and we found that most genes
appeared to be more tissue specific, that is, had lower H, in
the RMA-processed data compared to the reported values.
Although this affects some of the precise values of numbers
we have reported it does not alter any of the fundamental
trends or results. We include tissue specificities based on both
analyses in Additional data files 1 and 2.
Our analysis focused on only a few sequence features and
although we found good correlations, two aspects of our
results indicate that there are other regulatory mechanisms
not yet identified. First, there is a gradual transition in the fre-
quency of the TATA box and CpG islands between the most
and least tissue-specific genes. Second, while these features
are strong indicators of high and low specificity, they are far
from perfect predictors. Indeed, the middle range of entro-
pies contains a mix of all promoter classes in large numbers,
indicating that it is possible to achieve tissue-specific expres-
sion with any promoter class. YY1 may be an example of such
a supplementary mechanism. While occurring in only 16% of
genes, it is very strictly confined to low-specificity genes and
is a better indicator of low specificity than CpG islands. We
expect that other such signals will be found.
Anatomical resolution is an issue with the datasets used in
this study. For example, the pancreas consists of exocrine
cells, ductal cells and islet cells of several types. The bulk
pancreas was used to generate the GNF-GEA data, so the
reported expression level is the average mRNA concentra-
tions weighted by the cell-type count. This approximation
reduces the maximum possible entropy and, more signifi-
cantly, can make the apparent entropy different from the true
entropy. Genes highly and specifically expressed in a cell type
with a small population may currently appear to be ubiqui-
tous with very low overall expression. Genes expressed in a
few tissues may be revealed to be less tissue specific as more
cell types are measured in detail. Genes that appear to be
ubiquitously expressed may turn out to not to be expressed in
a few cell types. It will be interesting to see whether data with
higher anatomical resolution will help to increase the accu-
racy of the rules we have identified here for identifying tissue-
specific and nonspecific promoters.
Our method can be also applied to other sources of expression
data including SAGE, reverse transcription PCR (RT-PCR)
and in situ hybridization data. SAGE has the advantage of
sensitivity, as these studies generally sequence to much
greater depths than EST libraries [51]. In situ hybridization
data may increase the anatomical resolution of the data.
Qualitative intensities, for example, '0', '+', or '+++', can be
converted to representative numeric values as appropriate.
Our method can also be applied to other collections of condi-
tions beside normal tissues, for example, different types of
cancers or samples of the same cancer from multiple patients.
Modification of our method to account for temporal changes
in tissue specificity represents another direction for future
work.
The analysis presented here focuses on genes rather than on
transcripts generated from different promoters from the
same gene. The rate of the occurrence of alternative transcrip-
tion start sites is at least 9% [52] and may be as high as 25%
[53]. The promoters we used were specified by the DBTSS
dataset but there may be alternative promoters with different
characteristics and tissue-specific usage patterns. Analyses
based on different RNA species can easily be incorporated
into our approach and is an area of future research.
Our results for CpG island frequency in very tissue-specific
genes are lower than recent reports [3] that were based upon
present/absent calls, that is, tissue counting, using ESTs to
measure tissue specificity. This may be due to two reasons.
First, as we described in Results, a significant fraction of
genes will show no evidence of expression in poorly sampled
YY1 motifs are found downstream of the transcription start site, depending on their orientationFigure 6 (see previous page)
YY1 motifs are found downstream of the transcription start site, depending on their orientation. (a) The top image shows a logo [69] representation of
the YY1 motif in the (+10, +20) region of human CGI+ promoters identified using AlignACE. It is based on 102 sequences. The other two logos are for
weight matrices contained in TRANSFAC v7.3 that represent activating and repressing YY1 binding sites. (b) Plot of the positional distribution of
predicted YY1 sites and the fraction of genes with a predicted YY1 sites in the (+1, +60) region. YY1 sites were predicted using a weight matrix generated
using AlignACE. YY1 sites are more than almost three times (P ≤ 2 × 10
-7
) as common in genes with nonspecific CGI+ genes (11%; N = 2,072) than in CGI-
genes (4%; N = 607) and occur at more than 10 times the expected rate. Similar trends are observed in genes with 3 ≤ H ≤ 4 though with lower absolute
and relative rates. The difference between CGI+ and CGI- genes is not statistically significant for genes in the 3 ≤ H ≤ 4 bin. Essentially no YY1 sites where
observed in specific genes with H ≤ 3 bits whether or not they had a CpG island.
R33.18 Genome Biology 2005, Volume 6, Issue 4, Article R33 Schug et al. />Genome Biology 2005, 6:R33
Figure 7 (see legend on next page)
0−22−44−6>6
0−22−44−6>6
Occurrence as number of genes
Q pancreas (bits)
44
1
0
3
1
4
0
5
3
14
6
99
37
26
TATA
+
/Inr
−
TATA
+
/Inr
+
TATA
−
/Inr
+
TATA
−
/Inr
−
p
IT+T
=
0.0022
p
IT+T
=
0.00015
p
IT+T
=
0.00998
Occurrence (fraction)
Q pancreas (bits)
0−22−44−66−88−10 >10
% Genes with TATA box
Q value (bits)
Human
Mouse
p
h
=
0.13;
p
m
=
0.15
p
h
=
0.00007;
p
m
=
0.00087
p
h
=
0.00005;
p
m
=
0.00001
(8/9)
(7/9)
(4/8)
(3/8)
(8/28)
(10/28)
(16/80) (16/80)
(4/31)
(2/27)
(9/35)
(3/27)
Genes with
TATAA box:
human 18.8%
mouse 22.9%
0
5
10
15
20
25
30
35
40
0
0.1
0.2
0.3
0.4
0.5
0.6
0.7
0.8
0.9
1
0
10
20
30
40
50
60
70
80
90
(a)
(b)
(c)
Genome Biology 2005, Volume 6, Issue 4, Article R33 Schug et al. R33.19
comment reviews reports refereed researchdeposited research interactions information
Genome Biology 2005, 6:R33
tissues. A poorly sampled nonspecific gene will appear there-
fore more tissue specific than it actually is and this increases
the number of apparently tissue-specific genes with CpG
islands. Second, when we use microarray data and determine
tissue specificity by counting tissues expressing above the
median value of 200 AU, we see (data not shown) rates of
CpG island occurrence in 'specific' genes similar to those
reported in [3]. Thus, we conclude that including the varia-
tion of expression levels rather than mere presence/absence
is important for identifying very tissue-specific genes as
assessed by start CpG islands.
These results present an initial look at the correlation
between tissue specificity, CpG islands and binding sites for
selected transcription factors that interact with the basal
transcription apparatus. Using a novel approach with
entropy-based metrics, we have begun to lay out the frame-
work for promoter function by identifying strong correlations
between tissue-specific or ubiquitous expression and a
number of these sequence features. We plan to extend this
work in several ways. First, we plan to identify correlations
with other known transcription-factor-binding sites and
novel motifs identified as over-represented in promoter
regions [54]. Second, these results will help to understand
regulation by combinations of multiple upstream
transcription factors in genes specific to particular tissues or
clusters of tissues.
Conclusions
We have used Shannon entropy to quantify and rank the tis-
sue specificity of genes using tissue-survey data. First, this
has allowed us to assess the prevalence of tissue-specific reg-
ulation; we find that most genes show evidence of some
degree of tissue-dependent variation in expression levels. It
has also allowed us to find and evaluate associations between
promoter features and tissue specificity. We have verified and
extended understanding of known associations between, on
the one hand, CpG islands and the least tissue-specific genes
and, on the other hand, the TATA box and the most tissue-
specific genes. However, they are not the sole determinants of
tissue-specific expression, as indicated by mid-specificity
genes that exhibit a mix of all promoter classes. The class of
CGI-/TATA- promoters has emerged as the second most
common class of promoter overall and the most common pro-
moter class in mid-specificity genes. Therefore, additional
determinants of tissue specificity remain to be found. We
have identified one potential determinant, a downstream YY1
site, which is very strongly associated with the least tissue-
specific genes but is a relatively rare feature of these promot-
ers. Finally, we have also been able to associate trends in the
localization and function of protein products of genes accord-
ing to their promoter class. Many of the CGI-/TATA+ genes
code for highly expressed, very tissue specific, extracellular
proteins involved in a cell's response to the environment.
CGI-/TATA- genes are also involved in response to the envi-
ronment, but are found more uniformly across the spectrum
of tissue specificity, are not as highly expressed as CGI-/
TATA+ genes, and very often code for membrane-bound pro-
teins. CGI+/TATA- genes are more likely to be located in the
cytoplasm or nucleus and, as expected, carry out housekeep-
ing functions. All of the results we report are found in both
human and mouse and so may reflect general principles of all
mammalian species.
Materials and methods
Processing GNF-GEA [22] and DoTS [33] data
The GNF-GEA data are processed as described [22]. Given a
set of N tissues we define p
t|g
= w
g,t
/∑
1 ≤ t ≤ N
w
g,t
where w
t
is the
expression level of the gene g in tissue t. DoTS, available
through the AllGenes [33] site, contains ESTs and mRNAs
assembled into transcripts that are then clustered into genes.
We did not consider any transcript that contains only one EST
as this may represent a spurious sequence and did not con-
sider any gene with fewer than five ESTs because they provide
a poor estimate of H
g
. To accommodate the great disparity in
sampling depth across tissues we normalized EST counts by
tissue. To avoid artificially low entropies for genes that con-
tain relatively few ESTs we used pseudocounts to smooth the
data. The expression level of a gene in a tissue is computed as
w
g,t
= (n
g,t
+ 1)/(N
t
+ N
g
) where n
g,t
is the number of ESTs
from libraries for a tissue included in a gene, N
t
is the total
number of ESTs from a tissue assembled into genes, and N
g
is
the number of genes. We used different sets of tissues
depending on the task. H
g
and Q measures in Figure 1 used
the full GNF-GEA mouse set with a few modifications; adi-
pose tissue and brown fat were merged, epidermis and snout
epidermis were merged, digits and tongue were not consid-
ered as they are both a combination of skeletal muscle and
epidermis. The expression level for a set of merged tissues is
the median of the individual tissue replicate medians. For
comparison of microarray and EST data we used a set of 27
tissues that were common to both datasets and merged the
CNS and peripheral nervous system tissues.
The distribution of TATA box and initiator element (Inr) in pancreas-specific genesFigure 7 (see previous page)
The distribution of TATA box and initiator element (Inr) in pancreas-specific genes. One hundred and sixty pancreas genes were divided into bins
according to their Q-value. Genes that have a TATA box, an initiator with the motif YYANWYY, both, or none of these two motifs, are shown. (a)
Absolute numbers of genes with core promoter motifs. Red bars, TATA only; blue bars, TATA and Inr; green bars, Inr only; purple bars, none. The p-
values for pairwise comparison of distributions (TATA/total) are given below the graph. P-values were calculated for the sum of genes with TATA box
(with and without initiator). (b) Results from (a) plotted as fractions of genes with each motif status within a bin. (c) Number of TATA boxes found in
orthologous human and mouse gene pairs. Statistical significance of differences between Q bins are indicated.
R33.20 Genome Biology 2005, Volume 6, Issue 4, Article R33 Schug et al. />Genome Biology 2005, 6:R33
Estimating variance
To estimate the variance in H and Q, we took advantage of tis-
sue replicates in the GNF-GEA data. Using the mouse dataset,
we repeatedly sampled one of the measurements from each
pair of replicates and computed H for each gene. We then
computed the variance of the distribution of the estimates of
H for each gene and show the survivor distribution function
in Figure 2. The variance of Q was computed in a similar
manner.
Clustering tissues
Clustering was based on the Q scores for the set of mouse
genes with Q
g|t
≤ 7 for at least one tissue and expressing at
least 200 AU in at least one tissue in the GNF-GEA data.
There were 1,786 Affymetrix probe sets selected. The tree in
Figure 3 was built by sampling 5,000 sets of 1,000 probe sets
and clustering tissues using Pearson correlation and a cen-
tered measure using the XCLUSTER [55] program. The con-
sensus tree was built using the program CONSENSE in the
PHYLIP [56] package with the default parameters.
Identifying genes specific to a set of tissues
The total entropy of all tissues under a node can be computed
at each node in the hierarchy using a generalization of the
grouping theorem [57]. If the entropy of a gene at a node is
close to the maximum possible entropy for the number of
tissues under the node, then we select it and compute a Q
g,n
for the gene at the node. Using Q
g,n
we can rank genes by spe-
cificity to a cluster of tissues just as we can for an individual
tissue.
Predicting CpG islands
We predicted CpG islands using the program NEWCGRE-
PORT in the EMBOSS [58] package with the default parame-
ters which require a minimum length of 200 bp, C+G fraction
of 0.6 and ratio of observed over expected CpG of 0.5.
Statistical significance in embryonic expressed genes
We computed statistical significance of differences between
all embryonic-expressed genes and adult-specific rates using
a hypergeometric distribution. We start with a collection of N
CGI+ genes, n
e
of which are expressed in the embryo, that is,
marked as special. The N
A
tissue-specific genes in the adult
are considered a random sample from the original N and we
compute the probability of finding that at least (or at most)
n
ae
of these were expressed in the embryo.
Modeling distribution of entropy from uniform genes
To model the effect of experimental variability, we computed
the distribution of the difference between expression levels of
individual replicates for each gene and tissue and the mean
expression level across replicates as a function of the mean
expression level. This distribution was well fit by an exponen-
tial distribution with a parameter that depends on the mean
expression level. Thus, given an 'ideal' expression level, we
can estimate what the experimental variability will be. To
The cumulative distribution of promoter classes as a function of entropy is similar in human and mouseFigure 8
The cumulative distribution of promoter classes as a function of entropy is
similar in human and mouse. The cumulative fractions of genes with all
possible combinations of CGI and TATA box features for (a) human and
(b) mouse as a function of entropy H
g
as computed from GNF-GEA data is
shown. For example, in human about 50% of the genes with H
g
≤ 2.5 have
a CGI-/TATA+ promoter. The gray bars indicate the entropy range that is
not significantly different from uniform ubiquitous expression. Curves are
compiled from genes that express above 200 AU in at least one tissue. As
expected, CGI+/TATA- genes are most common in less specific genes and
CGI-/TATA+ genes are most common in tissue-specific genes. CGI-/
TATA- genes are very common and are found nearly uniformly at every
level of specificity. Furthermore, CGI+/TATA- and CGI-/TATA+ genes are
both common in mid-specificity (3 ≤ H
g
≤ 4) genes showing that specificity
is not determined by these features alone. The trends in human and
mouse data are nearly identical despite the lower rate of CpG islands in
mouse. The large variations in the graph at low entropy are due to the
noise inherent in the small number of genes in this range.
Cumulative promoter class fraction
Entropy (bits)
CGI
+
/TATA
−
CGI
+
/TATA
+
CGI
−
/TATA
−
CGI
−
/TATA
+
CGI
+
/TATA
−
CGI
+
/TATA
+
CGI
−
/TATA
−
CGI
−
/TATA
+
0
0.1
0.2
0.3
0.4
0.5
0.6
0.7
0.8
0.9
1
0 0.5 1 1.5 2 2.5 3 3.5 4 4.5 5
Cumulative promoter class fraction
Entropy (bits)
0
0.1
0.2
0.3
0.4
0.5
0.6
0.7
0.8
0.9
1
0 0.5 1 1.5 2 2.5 3 3.5 4 4.5 5 5.5
(a)
(b)
Genome Biology 2005, Volume 6, Issue 4, Article R33 Schug et al. R33.21
comment reviews reports refereed researchdeposited research interactions information
Genome Biology 2005, 6:R33
model a uniformly expressed gene, we assume that a gene has
some average expression level across all tissues and then
allow the expression levels in individual tissues to follow a
narrow distribution of random fold changes from that level.
Specifically, we assumed that the log base 2 of the fold
changes is distributed according to a normal distribution with
mean equal to 0 and a standard deviation (s). The standard
deviation can be adjusted to control the amount of biological
variation a 'uniformly' expressed gene is allowed to show. For
example, setting s = 0.5 means that about 68% of the fold
changes between a particular tissue and the nominal level are
within 1.4 up or down from the nominal level, that is, a two-
fold change from the lowest to the highest levels. Larger fold
changes are expected to occur in 32% of tissues. This model
allows significant variation and so is arguably close to the
upper limit of variation allowable for a gene that shows no tis-
sue specificity. We also used s = 0.25 as a more stringent def-
inition of uniform expression. We sampled mean expression
levels from the distribution of observed mean expression lev-
els and sampled entropy values from the probability model.
An entropy threshold was estimated by sampling
approximately 5,000 random expression profiles and deter-
mining the value for a p-value of 0.002. This process was
repeated 10 times and the corresponding thresholds and frac-
tion of genes were computed. The thresholds spanned a range
of less than 0.01 bit. The tissue-dependent gene fractions
never varied by more than one percentage point in either
direction.
Statistical significance of co-occurrence
We estimated the statistical significance of the co-occurrence
of motifs using the hypergeometric distribution. Given two
motifs with occurrence counts n
1
and n
2
, measured in the
same set of N promoters, and a co-occurrence count of n
12
, we
compute the significance as the probability of finding no more
than (or at least) n
12
hits in a random selection of n
2
promot-
ers from a pool of N promoters where n
1
of them are 'special'.
Comparison of frequency on independent sets
Given two sets of size N
1
and N
2
and positive observations n
1
and n
2
in each, we computed the probability that the underly-
ing rates are different using an exact calculation of the bino-
mial distribution to compute the probability of seeing at least
(or no more) than n
i
matches in N
i
trials where the rate is
assumed to be r = n
j
/N
j
. We estimated r using the larger of the
two sets.
Two binomial populations
We used the normal approximation to the difference of the
proportions normalized by their variance to compute a z-
score.
Promoter sequences
We obtained promoter sequence in two ways. The H-based
set of analyses used links from Affymetrix probe sets to Ref-
Seq identifiers to select alignments from the DBTSS promoter
sequences covering the (-1000, 200) region downloaded from
Table 6
Over-represented Gene Ontology (GO) terms for cellular component and biological process of genes by promoter class
Cellular component/biological process Human only Mouse only
CGI-/TATA+ Extracellular, extracellular space - Intermediate filament (cytoskeleton)
Response to stimulus Cell-cell signaling, organismal physiological
process, inflammatory response, innate
immune response, response to pest/pathogen/
parasite
-
CGI+/TATA- Cell, cytoplasm, intracellular,
mitochondrion
Nucleus, ribonucleoprotein complex -
- Nucleobase, nucleoside, nucleotide and nucleic
acid metabolism, intracellular transport,
metabolism, protein transport, intracellular
protein transport, RNA processing, RNA
metabolism, cell cycle, mitotic cell cycle
-
CGI-/TATA- (Integral to) (plasma) membrane - Extracellular, extracellular space
Organismal physiological process, defense
response, immune response, response to
biotic stimulus, response to stimulus,
response to external stimulus
Response to pest/pathogen/parasite, cell
communication, response to wounding,
cellular defense response, signal transduction
Complement activation, complement
activation (classical pathway), humoral
defense mechanism (sensu Vertebrata),
humoral immune response
All terms were selected using a p-value ≤ 0.05 (corrected for multiple testing). Terms common to human and mouse are listed in the second column.
The two columns on the right indicate any additional terms found in only one species. The CGI-/TATA+ terms are consistent with a model of strong
condition-specific induction, CGI+/TATA- terms are consistent with housekeeping functions. CGI-/TATA- terms indicate support for cell sensing
and communication functions. No significant results were found for CGI+/TATA+ genes.
R33.22 Genome Biology 2005, Volume 6, Issue 4, Article R33 Schug et al. />Genome Biology 2005, 6:R33
the DBTSS website [59]. The Q-based analyses of TATA box
and initiator elements used genomic locations of DoTS genes
on UCSC Golden Path release mm3 [60,61] to identify gene
names. Promoter sequences consisting of the 350 bp of the
upstream region were then extracted from Ensembl [62]. The
mouse homologs were also used as annotated in Ensembl.
Core motifs
The H-based analysis used core promoter element models
from EPD [36,63]. The fraction of promoters containing each
matrix was determined as follows for each set of genes (with
and without CpG islands in each entropy bin) individually.
Having verified that the positional distribution of each motif
was sharply peaked at the appropriate place in the promoter
sequences ((-40, -20) region for TATA and (-20, +20) region
for the initiator element) we considered only the predictions
in these windows from all genes. We used the log-likelihood
function to score each subsequence against each matrix using
the published score cut-offs. The YY1 motif was found in
essentially every run of AlignACE and MEME performed on
the downstream regions of ubiquitous CGI+ promoters. We
explored different motif widths and other settings and
selected version that achieved a combination of good cover-
age and conservation. In all cases we estimated the back-
ground rate of random occurrence of motifs by repeatedly
scrambling the individual sequences over a 10 bp window to
create approximately 1,000 test sequences for each combina-
tion of CpG island status and specificity range. These
sequences were scored in the same manner as the unscram-
bled sequences. We estimated the statistical significance of
differences of observed frequencies using exact computation
of the binomial distribution. The Q-based analyses of core
motifs used the TATA box motif (TATAA) and initiator ele-
ment (YYANWYY). Motif searches were carried out using the
tool patternmatch from the biological workbench 3.2 [64].
Only the TATAA instance located closest to the start of the
mRNA's alignment to the genome was used. Matches to the
initiator element were required to be downstream of the
TATAA box when present.
YY1 motif
We used an AlignACE-derived weight matrix (shown in Fig-
ure 6a) to assess the occurrence of YY1-like sites as it con-
tained the YY1 consensus and was built using approximately
100 sites which is many more than previously published
weight matrices [43,65] also shown in Figure 6a.
GO association analysis
We submitted Affymetrix probe set ids of interest to the
DAVID website [45,46] and compared them either to all
probe sets on the appropriate Affymetrix chips or to all genes
in the selected entropy range. We compensated for multiple
testing by requiring the reported p-values be better than
either 0.05/1472 = 0.00003 (cellular component) or 0.05/
8972 = 0.000006 (biological process) using the number of
GO terms for the corresponding GO divisions in a Bonferroni
correction.
RMA quantification
We obtained CEL files for the GNF-GEA study from and re-
quantified them using the gcrma package [66] in the Biocon-
ductor [67] project for the R statistical analysis program [68].
We use the gcrma options 'type=c('fullmodel')' and 'fast=T'.
Additional data files
Two additional data files are available with the online version
of this article. They contain H and Q values for all normal tis-
sues in the GNF-GEA data set for both human (Additional
data file 1) and mouse (Additional data file 2) using both the
MAS4 and RMA quantification methods. The RMA data were
normalized to yield a common median of 3.75 (human) and
3.22 (mouse) prior to the H and Q calculation. The files are in
Excel format. The data for each tissue are placed in separate
worksheets. Each worksheet contains H- and Q-values, the
expression value of the gene in the worksheet's tissue, and its
maximum expression across all tissues in the file, the gene
symbol, RefSeq, SwissProt, and Unigene ID, and a descrip-
tion. The rows in each worksheet are sorted by increasing val-
ues of Q using the RMA data. Thus the top of each worksheet
displays the genes most specific to that worksheet's tissue.
Additional File 1A table showing H and Q values for all normal human tissues in the GNF-GEA dataset.A table showing H and Q values for all normal human tissues in the GNF-GEA dataset. H and Q values for all normal tissues in the GNF-GEA dataset for human using both the original MAS4 quanti-fication and our RMA re-quantification. The RMA data were nor-malized to yield common medians of 3.75 prior to the H and Q calculation. The data for each tissue are placed in separate work-sheets. Each worksheet contains H- and Q-values, the expression value of the gene in the worksheet's tissue, and its maximum expression across all tissues in the file, the gene symbol, RefSeq, SwissProt, and Unigene ID, and a description. The rows in each worksheet are sorted by increasing values of Q using the RMA data. Thus the top of each worksheet displays the genes most specific to that worksheet's tissue.Click here for fileAdditional File 2A table showing H and Q values for all normal mouse tissues in the GNF-GEA dataset.A table showing H and Q values for all normal mouse tissues in the GNF-GEA dataset. H and Q values for all normal tissues in the GNF-GEA dataset for mouse using both the original MAS4 quanti-fication and our RMA re-quantification. The RMA data were nor-malized to yield common medians of 3.22 prior to the H and Q calculation. The data for each tissue are placed in separate work-sheets. Each worksheet contains H- and Q-values, the expression value of the gene in the worksheet's tissue, and its maximum expression across all tissues in the file, the gene symbol, RefSeq, SwissProt, and Unigene ID, and a description. The rows in each worksheet are sorted by increasing values of Q using the RMA data. Thus the top of each worksheet displays the genes most specific to that worksheet's tissue.Click here for file
Acknowledgements
J.S. thanks J. Mazzarelli, M. Mintz and S. Hannenhalli for many helpful discus-
sions, E. Manduchi and H. He for help with R and RMA, J. Hogenesch and J.
Walker at Novartis for providing timely access to the CEL files for the
GNF-GEA data, and T. Kadesh for critical readings of the manuscript. C.S.
acknowledges support from NIH R01HG001539. J.M.S. and W P.S. in
C.K.'s lab were supported by an R01 grant 1R01DK63336.
References
1. Bird AP: DNA methylation - how important in gene control?
Nature 1984, 307:503-504.
2. Bird AP: DNA methylation versus gene expression. J Embryol
Exp Morphol 1984, 83(Suppl):31-40.
3. Ponger L, Duret L, Mouchiroud D: Determinants of CpG islands:
expression in early embryo and isochore structure. Genome
Res 2001, 11:1854-1860.
4. Smale ST, Baltimore D: The 'initiator' as a transcription control
element. Cell 1989, 57:103-113.
5. Shi Y, Seto E, Chang LS, Shenk T: Transcriptional repression by
YY1, a human GLI-Kruppel-related protein, and relief of
repression by adenovirus E1A protein. Cell 1991, 67:377-388.
6. Seto E, Shi Y, Shenk T: YY1 is an initiator sequence-binding pro-
tein that directs and activates transcription in vitro. Nature
1991, 354:241-245.
7. Riggs KJ, Saleque S, Wong KK, Merrell KT, Lee JS, Shi Y, Calame K:
Yin-yang 1 activates the c-myc promoter. Mol Cell Biol 1993,
13:7487-7495.
8. Riggs KJ, Merrell KT, Wilson G, Calame K: Common factor 1 is a
transcriptional activator which binds in the c-myc promoter,
the skeletal alpha-actin promoter, and the immunoglobulin
heavy-chain enhancer. Mol Cell Biol 1991, 11:1765-1769.
9. Wasserman WW, Fickett JW: Identification of regulatory
regions which confer muscle-specific gene expression. J Mol
Biol 1998, 278:167-181.
10. Krivan W, Wasserman WW: A predictive model for regulatory
sequences directing liver-specific transcription. Genome Res
Genome Biology 2005, Volume 6, Issue 4, Article R33 Schug et al. R33.23
comment reviews reports refereed researchdeposited research interactions information
Genome Biology 2005, 6:R33
2001, 11:1559-1566.
11. Ringrose L, Rehmsmeier M, Dura JM, Paro R: Genome-wide pre-
diction of Polycomb/Trithorax response elements in Dro-
sophila melanogaster. Dev Cell 2003, 5:759-771.
12. Berman BP, Pfeiffer BD, Laverty TR, Salzberg SL, Rubin GM, Eisen MB,
Celniker SE: Computational identification of developmental
enhancers: conservation and function of transcription factor
binding-site clusters in Drosophila melanogaster and Dro-
sophila pseudoobscura. Genome Biol 2004, 5:R61.
13. Wasserman WW, Sandelin A: Applied bioinformatics for the
identification of regulatory elements. Nat Rev Genet 2004,
5:276-287.
14. Hsiao LL, Dangond F, Yoshida T, Hong R, Jensen RV, Misra J, Dillon
W, Lee KF, Clark KE, Haverty P, et al.: A compendium of gene
expression in normal human tissues. Physiol Genomics 2001,
7:97-104.
15. Arbeitman MN, Furlong EE, Imam F, Johnson E, Null BH, Baker BS,
Krasnow MA, Scott MP, Davis RW, White KP: Gene expression
during the life cycle of Drosophila melanogaster. Science 2002,
297:2270-2275.
16. Waterston RH, Lindblad-Toh K, Birney E, Rogers J, Abril JF, Agarwal
P, Agarwala R, Ainscough R, Alexandersson M, An P, et al.: Initial
sequencing and comparative analysis of the mouse genome.
Nature 2002, 420:520-562.
17. Suzuki Y, Yamashita R, Sugano S, Nakai K: DBTSS, DataBase of
Transcriptional Start Sites: progress report 2004. Nucleic Acids
Res 2004, 32(Database):D78-D81.
18. Carninci P, Waki K, Shiraki T, Konno H, Shibata K, Itoh M, Aizawa K,
Arakawa T, Ishii Y, Sasaki D, et al.: Targeting a complex transcrip-
tome: the construction of the mouse full-length cDNA
encyclopedia. Genome Res 2003, 13:1273-1289.
19. Strausberg RL, Feingold EA, Klausner RD, Collins FS: The mamma-
lian gene collection. Science 1999, 286:455-457.
20. Gitton Y, Dahmane N, Baik S, Ruiz i, Altaba A, Neidhardt L, Scholze
M, Herrmann BG, Kahlem P, Benkahla A, Schrinner S, et al.: A gene
expression map of human chromosome 21 orthologues in
the mouse. Nature 2002, 420:586-590.
21. Reymond A, Marigo V, Yaylaoglu MB, Leoni A, Ucla C, Scamuffa N,
Caccioppoli C, Dermitzakis ET, Lyle R, Banfi S, et al.: Human chro-
mosome 21 gene expression atlas in the mouse. Nature 2002,
420:582-586.
22. Su AI, Cooke MP, Ching KA, Hakak Y, Walker JR, Wiltshire T, Orth
AP, Vega RG, Sapinoso LM, Moqrich A, et al.: Large-scale analysis
of the human and mouse transcriptomes. Proc Natl Acad Sci USA
2002, 99:4465-4470.
23. Safran M, Chalifa-Caspi V, Shmueli O, Olender T, Lapidot M, Rosen
N, Shmoish M, Peter Y, Glusman G, Feldmesser E, et al.: Human
gene-centric databases at the Weizmann Institute of Sci-
ence: GeneCards, UDB, CroW 21 and HORDE. Nucleic Acids
Res 2003, 31:142-146.
24. Hayashizaki Y: RIKEN mouse genome encyclopedia. Mech Age-
ing Dev 2003, 124:93-102.
25. Wheeler DL, Church DM, Federhen S, Lash AE, Madden TL, Pontius
JU, Schuler GD, Schriml LM, Sequeira E, Tatusova TA, et al.: Data-
base resources of the National Center for Biotechnology.
Nucleic Acids Res 2003, 31:28-33.
26. Boguski MS, Lowe TM, Tolstoshev CM: dbEST - database for
'expressed sequence tags'. Nat Genet 1993, 4:332-333.
27. Huminiecki L, Lloyd AT, Wolfe KH: Congruence of tissue expres-
sion profiles from Gene Expression Atlas, SAGEmap and
TissueInfo databases. BMC Genomics 2003, 4:31.
28. Vinogradov AE: Isochores and tissue-specificity. Nucleic Acids Res
2003, 31:5212-5220.
29. Stanton JA, Macgregor AB, Green DP: Identifying tissue-enriched
gene expression in mouse tissues using the NIH UniGene
database. Appl Bioinformatics 2003, 2:S65-S73.
30. Fuhrman S, Cunningham MJ, Wen X, Zweiger G, Seilhamer JJ, Som-
ogyi R: The application of shannon entropy in the identifica-
tion of putative drug targets. Biosystems 2000, 55:5-14.
31. Cunningham MJ, Liang S, Fuhrman S, Seilhamer JJ, Somogyi R: Gene
expression microarray data analysis for toxicology profiling.
Ann NY Acad Sci 2000, 919:52-67.
32. Peterson LE: CLUSFAVOR 5.0: hierarchical cluster and princi-
pal-component analysis of microarray-based transcriptional
profiles. Genome Biol 2002, 3:software0002.1-0002.8.
33. DoTS []
34. Shannon C: The Mathematical Theory of Communication Urbana: Uni-
versity of Illinois Press; 1949.
35. Eisenberg E, Levanon EY: Human housekeeping genes are
compact. Trends Genet 2003, 19:362-365.
36. Bucher P: Weight matrix descriptions of four eukaryotic RNA
polymerase II promoter elements derived from 502 unre-
lated promoter sequences. J Mol Biol 1990, 212:563-578.
37. Cook T, Gebelein B, Urrutia R: Sp1 and its likes: biochemical and
functional predictions for a growing family of zinc finger
transcription factors. Ann NY Acad Sci 1999, 880:94-102.
38. Li L, He S, Sun JM, Davie JR: Gene regulation by Sp1 and Sp3. Bio-
chem Cell Biol 2004, 82:460-471.
39. Lee JS, Galvin KM, Shi Y: Evidence for physical interaction
between the zinc-finger transcription factors YY1 and Sp1.
Proc Natl Acad Sci USA 1993, 90:6145-6149.
40. Natesan S, Gilman MZ: DNA bending and orientation-depend-
ent function of YY1 in the c-fos promoter. Genes Dev 1993,
7:2497-2509.
41. McGuire AM, Hughes JD, Church GM: Conservation of DNA reg-
ulatory motifs and discovery of new motifs in microbial
genomes. Genome Res 2000, 10:744-757.
42. Bailey TL, Baker ME, Elkan CP: An artificial intelligence approach
to motif discovery in protein sequences: application to ster-
oid dehydrogenases. J Steroid Biochem Mol Biol 1997, 62:29-44.
43. Shrivastava A, Calame K: An analysis of genes regulated by the
multi-functional transcriptional regulator Yin Yang-1. Nucleic
Acids Res 1994, 22:5151-5155.
44. Smale ST: Transcription initiation from TATA-less promoters
within eukaryotic protein-coding genes. Biochim Biophys Acta
1997, 1351:73-88.
45. Hosack DA, Dennis G Jr, Sherman BT, Lane HC, Lempicki RA: Iden-
tifying biological themes within lists of genes with EASE.
Genome Biol 2003, 4:R70.
46. Dennis G Jr, Sherman BT, Hosack DA, Yang J, Gao W, Lane HC, Lem-
picki RA: DAVID: Database for Annotation, Visualization, and
Integrated Discovery. Genome Biol 2003, 4:P3.
47. Harris MA, Clark J, Ireland A, Lomax J, Ashburner M, Foulger R, Eil-
beck K, Lewis S, Marshall B, Mungall C, et al.: The Gene Ontology
(GO) database and informatics resource. Nucleic Acids Res 2004,
32(Database):D258-D261.
48. Yanai I, Benjamin H, Shmoish M, Chalifa-Caspi V, Shklar M, Ophir R,
Bar-Even A, Horn-Saban S, Safran M, Domany E, et al.: Genome-
wide midrange transcription profiles reveal expression level
relationships in human tissue specification. Bioinformatics 2004.
49. Lockhart DJ, Dong H, Byrne MC, Folletti MT, Gallo MV, Chee MS,
Mittmann M, Wang C, Kobayashi M, Horton H, Brown EL: Expres-
sion monitoring by hybridization to high-density oligonucle-
otide arrays. Nat Biotechnol 1996, 14:1675-1680.
50. Bolstad BM, Irizarry RA, Astrand M, Speed TP: A comparison of
normalization methods for high density oligonucleotide
array data based on variance and bias. Bioinformatics 2003,
19:185-193.
51. Boheler KR, Stern MD: The new role of SAGE in gene
discovery. Trends Biotechnol 2003, 21:55-57.
52. Zavolan M, van Nimwegen E, Gaasterland T: Splice variation in
mouse full-length cDNAs identified by mapping to the
mouse genome. Genome Res 2002, 12:1377-1385.
53. Zavolan M, Kondo S, Schonbach C, Adachi J, Hume DA, Hayashizaki
Y, Gaasterland T: Impact of alternative initiation, splicing, and
termination on the diversity of the mRNA transcripts
encoded by the mouse transcriptome. Genome Res 2003,
13:1290-1300.
54. Marino-Ramirez L, Spouge JL, Kanga GC, Landsman D: Statistical
analysis of over-represented words in human promoter
sequences. Nucleic Acids Res 2004, 32:949-958.
55. Sherlock G: Analysis of large-scale gene expression data. Brief
Bioinform 2001, 2:350-362.
56. Felsenstein J: PHYLIP. Seattle 51993.
57. Ash RB: Information Theory Dover Publication, Inc., New York; 1965.
58. Rice P, Longden I, Bleasby A: EMBOSS: the European Molecular
Biology Open Software Suite. Trends Genet 2000, 16:276-277.
59. Database of Transcriptional Start Sites [ />index.html]
60. Karolchik D, Hinrichs AS, Furey TS, Roskin KM, Sugnet CW, Haussler
D, Kent WJ: The UCSC Table Browser data retrieval tool.
Nucleic Acids Res 2004, 32(Database):D493-D496.
61. Kent WJ, Sugnet CW, Furey TS, Roskin KM, Pringle TH, Zahler AM,
Haussler D: The human genome browser at UCSC. Genome Res
2002, 12:996-1006.
62. Birney E, Andrews D, Bevan P, Caccamo M, Cameron G, Chen Y,
R33.24 Genome Biology 2005, Volume 6, Issue 4, Article R33 Schug et al. />Genome Biology 2005, 6:R33
Clarke L, Coates G, Cox T, Cuff J, et al.: Ensembl 2004. Nucleic Acids
Res 2004, 32(Database):D468-D470.
63. Perier RC, Praz V, Junier T, Bonnard C, Bucher P: The eukaryotic
promoter database (EPD). Nucleic Acids Res 2000, 28:302-303.
64. Subramaniam S: The Biology Workbench - a seamless database
and analysis environment for the biologist. Proteins 1998,
32:1-2.
65. Matys V, Fricke E, Geffers R, Gossling E, Haubrock M, Hehl R, Hor-
nischer K, Karas D, Kel AE, Kel-Margoulis OV, et al.: TRANSFAC:
transcriptional regulation, from patterns to profiles. Nucleic
Acids Res 2003, 31:374-378.
66. Wu Z, Irizarry R: gcrma. 1.1.32004 [ />67. Gentleman RC, Carey VJ, Bates DM, Bolstad B, Dettling M, Dudoit S,
Ellis B, Gautier L, Ge Y, Gentry J, et al.: Bioconductor: open soft-
ware development for computational biology and
bioinformatics. Genome Biol 2004, 5:R80.
68. Team RDC: R: A language and environment for statistical
computing. 2.0.1 edition. Vienna, Austria: R Foundation for Statisti-
cal Computing; 2004.
69. Schneider TD, Stephens RM: Sequence logos: a new way to dis-
play consensus sequences. Nucleic Acids Res 1990, 18:6097-6100.