Báo cáo y học: " Protein structure protection commits gene expression patterns" pps
Bạn đang xem bản rút gọn của tài liệu. Xem và tải ngay bản đầy đủ của tài liệu tại đây (1.63 MB, 11 trang )
Open Access
Volume
et al.
Chen
2008 9, Issue 7, Article R107
Research
Protein structure protection commits gene expression patterns
Jianping Chen*, Han Liang† and Ariel Fernández*‡§
Addresses: *Program in Applied Physics, Rice Quantum Institute, Rice University, Houston, TX 77005, USA. †Department of Ecology and
Evolution, University of Chicago, Chicago, IL 60637, USA. ‡Department of Bioengineering, Rice University, Houston, TX 77005, USA.
§Department of Computer Science, University of Chicago, Chicago, IL 60637, USA.
Correspondence: Ariel Fernández. Email:
Published: 7 July 2008
Genome Biology 2008, 9:R107 (doi:10.1186/gb-2008-9-7-r107)
Received: 19 May 2008
Revised: 6 July 2008
Accepted: 7 July 2008
The electronic version of this article is the complete one and can be
found online at />© 2008 Chen et al.; licensee BioMed Central Ltd.
This is an open access article distributed under the terms of the Creative Commons Attribution License ( which
permits unrestricted use, distribution, and reproduction in any medium, provided the original work is properly cited.
yeast proteomic regulates expression
Aand human.
Protein structureassociation study between protein three-dimensional structure and transcriptional and post-transcriptional regulation in
Abstract
Background: Gene co-expressions often determine module-defining spatial and temporal
concurrences of proteins. Yet, little effort has been devoted to tracing coordinating signals for
expression correlations to the three-dimensional structures of gene products.
Results: We performed a global structure-based analysis of the yeast and human proteomes and
contrasted this information against their respective transcriptome organizations obtained from
comprehensive microarray data. We show that protein vulnerability quantifies dosage sensitivity
for metabolic adaptation phases and tissue-specific patterns of mRNA expression, determining the
extent of co-expression similarity of binding partners. The role of protein intrinsic disorder in
transcriptome organization is also delineated by interrelating vulnerability, disorder propensity and
co-expression patterns. Extremely vulnerable human proteins are shown to be subject to severe
post-transcriptional regulation of their expression through significant micro-RNA targeting, making
mRNA levels poor surrogates for protein-expression levels. By contrast, in yeast the expression
of extremely under-wrapped proteins is likely regulated through protein aggregation. Thus, the 85
most vulnerable proteins in yeast include the five confirmed prions, while in human, the genes
encoding extremely vulnerable proteins are predicted to be targeted by microRNAs. Hence, in
both vastly different organisms protein vulnerability emerges as a structure-encoded signal for
post-transcriptional regulation.
Conclusion: Vulnerability of protein structure and the concurrent need to maintain structural
integrity are shown to quantify dosage sensitivity, compelling gene expression patterns across
tissue types and temporal adaptation phases in a quantifiable manner. Extremely vulnerable
proteins impose additional constraints on gene expression: They are subject to high levels of
regulation at the post-transcriptional level.
Background
The coordination of protein roles to achieve specific biological
functions requires the spatial/temporal concurrence of proteins so that they can form complexes [1,2] or, in general,
operate within a module [2-4]. In turn, this concurrence is
tightly coordinated through the regulation of gene expression, as suggested by established correlations between the
transcriptome and the interactome [5,6]. However, structure-
Genome Biology 2008, 9:R107
/>
Genome Biology 2008,
encoded factors that may quantitatively control such correlations have not been identified. So far, protein structure has
not provided organizing clues for the integration of largescale descriptions of the molecular phenotype.
As reported in this work, by exploiting a structure-based analysis of protein associations [7,8] and their correlated expression patterns, we identify a structural attribute, protein
vulnerability, and show that it commits gene expression patterns in a quantifiable manner. More specifically, protein vulnerability is shown to determine the extent of co-expression
of genes containing protein-encoding interactive domains in
metabolic adaptation phases [9,10] or tissue types [11,12],
while extreme vulnerability promotes significant post-transcriptional regulatory control.
Soluble proteins maintain the integrity of their functional
structures provided the amide and carbonyl groups paired
through hydrogen bonds are adequately shielded from water
attack, preventing backbone hydration and, generally, the
concurrent total or partial denaturation of the soluble structure [13,14]. As shown in this work, this integrity is often
ensured through the formation of protein complexes, which
become more or less obligatory depending on the extent of
structure vulnerability and the level of backbone protection
provided by the association [13]. By adopting vulnerability as
a structural indicator of dosage imbalance effects, the extent
of reliance on binding partnerships is precisely quantified
and shown to be an organizing factor for the yeast and human
transcriptome.
Results
Protection of a vulnerable protein and co-expression
demands
We start by defining vulnerability ν of a soluble protein structure as the ratio of solvent-exposed backbone hydrogen bonds
(SEBHs) to the overall number of such bonds (Figure 1). The
SEHBs may be computationally identified from atomic coordinates (Materials and methods). Thus, while backbone
hydrogen bonds are determinants of the basic structural
motifs [15,16], the SEHBs represent local weaknesses of the
structure.
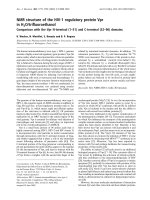
Figure 1a shows the vulnerability pattern of a well protected
soluble protein, the yeast SH3 signaling domain [17], with ν =
19.0%. Figure 1b shows the most vulnerable protein structure
for an autonomous folder in the Protein Data Bank (PDB) (ν
= 63.0%), the cellular form of the 90-230 fragment of the
human prion protein PrPC (PDB.1QM0) [18]. This extreme
case was detected after exhaustive computation of the ν
parameter for all conformations of isolated (those not in a
complex) polypeptide chains reported in the PDB (Materials
and methods). Figure 2 shows the most vulnerable structure
adopted by a protein chain within a yeast complex: subunit 1
from the cytochrome b-c1 complex (COR1/YBL045C).
(a)
Volume 9, Issue 7, Article R107
1-GLY
1-GLY
60-VAL
Chen et al. R107.2
60-VAL
(b)
228-ARG
125-LEU
228-ARG
125-LEU
Figure 1
SH3 domain and the human structural vulnerabilities (SEBHs) of the yeast
Hydrogen-bond pattern and prion protein PrPC
Hydrogen-bond pattern and structural vulnerabilities (SEBHs) of the yeast
SH3 domain and the human prion protein PrPC. (a) Hydrogen-bond
pattern and structural vulnerabilities (SEBHs) of the yeast SH3 domain
from a S. cerevisiae 40.4 kDa protein (PDB.1SSH) [17]. The ribbon display
is included as a visual aid. The protein backbone is shown as virtual bonds
(blue) joining consecutive α-carbons in the peptide chain. Light-grey
segments represent well protected backbone hydrogen bonds, and green
segments represent SEBHs. The extent of solvent-exposure extent of a
hydrogen bond was determined from atomic coordinates by calculating
the number of nonpolar groups within its microenvironment (Materials
and methods). SEBHs are those backbone hydrogen bonds protected by
an insufficient number of nonpolar groups as statistically defined in
Materials and methods. The level of structure vulnerability ν, defined as
the ratio of SEBHs to the overall number of backbone hydrogen bonds, is
19.0% (ν = 4/21). (b) SEBH-pattern for the cellular structure of the human
prion protein PrPC (PDB.1QM0) [18]. Its vulnerability parameter is ν =
63.0%, making it the most vulnerable soluble folder of all structures of
unbound proteins reported in the PDB.
Unlikely to be found in isolation, this structure is found
within the mitochondrial respiratory chain complex III [19].
A vulnerable soluble structure gains extra protection of its
backbone hydrogen bonds through forming complexes, as
nonpolar groups of a binding partner contribute to expel
water molecules from the microenvironment of the preformed bonds [13]. On the other hand, the SEBHs promote
their own dehydration as a means to stabilize and strengthen
the hydrogen bond [14].
Genome Biology 2008, 9:R107
/>
Genome Biology 2008,
Volume 9, Issue 7, Article R107
Chen et al. R107.3
(a)
ciations involve domains whose PDB-reported homologs are
involved in complexes.
27-ALA
This work quantitatively examines the relationship between
the structural vulnerability of a protein and the extent of coexpression of genes encoding its binding partners. Thus, the
extent of co-expression, η (i, j), for two genes i, j encoding
interacting proteins is measured by the expression correlation of the two genes normalized to the average correlation
over the interactome (Materials and methods). In consonance, the expression correlation of a complex, η (complex),
may be defined by the maximum expression correlation over
its constitutive underlying pairwise interactions (see Additional data files 7-9 for alternative definitions).
(b)
457-TRP
27-ALA
457-TRP
Figure 2
the cytochrome b-c1 complex
Ribbon representation and vulnerability (SEBH) pattern of subunit 1 from
Ribbon representation and vulnerability (SEBH) pattern of subunit 1 from
the cytochrome b-c1 complex. (a) Ribbon representation and (b)
vulnerability (SEBH) pattern of subunit 1 from the cytochrome b-c1
complex (PDB.1KB9) [19]. In b, red segments represent virtual protein
backbone bonds, light-grey segments represent well protected backbone
hydrogen bonds, and those green segments represent SEBHs. In the
cytochrome complex, this protein adopts a highly vulnerable (ν = 57.3%)
conformation.
To delineate the role of structure vulnerability as an organizing integrative factor in large-scale descriptions of the molecular phenotype, we first examined the Pfam-filtered [7]
protein complexes for yeast [8] and human [20]. These asso-
Thus, the most highly correlated yeast complex (overall η
(complex) = 3.61) with full PDB-reported representation is
the mitochondrial respiratory chain complex III shown in
Figure 3a (PDB.1KB9[19]). The most vulnerable protein
within the complex (ν = 57%) is subunit 1 from the cytochrome b-c1 complex (Gene/ORF = COR1/YBL045C, shown
in red). Its peptide chain conformation, with the SEBH pattern described in Figure 2, is involved in the most highly correlated interaction (η = 3.61) within the complex (Figure
3b,c). The binding partner in this interaction is subunit 2 of
cytochrome b-c1 (Gene/ORF = QCR2/YPR191W, blue chain
in Figure 3a). Figure 3c shows the mutual protection of
preformed SEBHs in the two subunits along part of their
association interface (red, COR1 residues 42-119; blue, QCR2
residues 250-331). This intermolecular mutual 'wrapping' of
local weaknesses illustrates the fact that the association contributes to maintain structural integrity (Figure 3c).
We examined the role of structure vulnerability as a factor
governing the extent of co-expression of binding partners in
illustrative yeast complexes (Figure 4a; Additional data file 1).
Structure-based protein-protein interactions were curated
through the Pfam database, so that two proteins were considered to interact with each other if their respective domains (or
homolog domains) were reported in a PDB complex [8,21].
The expression correlation, η, for each interaction pair within
a complex was determined at the mRNA level of the genes
whose open reading frames (ORFs) contained the interacting
domains (Materials and methods). Vulnerabilities were computed either directly from PDB files, when available, as
described in Figure 1, or from atomic coordinates generated
by homology threading using the Pfam-homolog domain as
template (Materials and methods). In the latter case, sidechain equilibration, constrained by a fixed homologythreaded backbone, was obtained from constrained molecular dynamics simulations (Materials and methods). We then
determined the maximum ν-value for each interactive pair
and, using the comprehensive microarray database for Saccharomyces cerevisiae glucose→ glycerol metabolic adaptation [22], we computed the expression correlation η for each
Pfam interaction. A tight (η-ν) correlation (R2 = 0.891) is
Genome Biology 2008, 9:R107
/>
Genome Biology 2008,
Chen et al. R107.4
obtained and shown to hold across the illustrative yeast complexes (Figure 4a) and, furthermore, to hold across all 1,354
pairs of interacting proteins in the yeast interactome with
Pfam representation (Figure 4b,c; Additional data file 2). The
(η-ν) correlation implies that the protection of a functionally
competent protein structure in yeast drives co-expression of
its binding partners to an extent that is determined by the
structure vulnerability.
(a)
Color
Red
Blue
Green
White
Purple
Orange
Cyan
Yellow
Volume 9, Issue 7, Article R107
Pfam
Peptidase_M16
Peptidase_M16
Cytochrom_B_C
Cytochrom_C1
UCR_TM
UCR_14kD
UcrQ
UCR_UQCRX_QCR9
Gene
COR1
QCR2
COB
CYT1
RIP1
QCR7
QCR8
QCR9
In selecting the yeast transcriptome [22], particular attention
was focused on the 'perturbative' nature of the change triggering the structural remodeling of the proteomic network
across different phases. A more extensive remodeling on a
vastly larger scale, as in the complete yeast developmental
cycle [23], cannot be treated as a perturbation since it clearly
alters the modular structure of the proteome network [4] and,
consequently, yields a weaker (η-ν) correlation (Additional
data file 10).
ORF
YBL045C
YPR191W
Q0105
YOR065W
YEL024W
YDR529C
YJL166W
YGR183C
(b)
Structure vulnerability is not only an organizing factor for the
metabolic-adaptation transcriptome but also steers the
organization of tissue-based transcriptomes. This is revealed
by a similar comparative analysis of the most comprehensive
protein-encoding gene-expression data for human [11] and
the structure-represented interactome [20]. Thus, a clear (ην) correlation is apparent between the co-expression of 607
gene pairs and the maximum structure vulnerability for each
pair of interacting domains encoded in the ORFs of the
respective genes (Figure 5; Additional data file 3).
(c)
B250-LEU
B331-SER
A42-HIS
A119-PHE
Other human transcriptomes based on normal tissue expression were examined (see, for example, [24]), but none provided statistically significant (>>10 genes pairs) representation for the gene pairs for which interactome data also exist
[20], as needed for the present study.
Post-transcriptional regulation of the expression of
highly vulnerable proteins
Figure 3
respiratory chain of SEBHs
Mutual protectioncomplex IIIin the two subunits of mitochondrial
Mutual protection of SEBHs in the two subunits of mitochondrial
respiratory chain complex III. (a) Ribbon representation of mitochondrial
respiratory chain complex III (PDB.1KB9). The high structure vulnerability
of subunit 1 (red; compare Figure 2) renders it highly needy for interaction
with other subunits of the complex to maintain its structural integrity. (b)
SEBH pattern for subunit 1 (red) and subunit 2 (blue). The interacting pair
is characterized by a very high expression correlation η = 3.61. The yellow
square highlights the part of the interface shown in detail in (c). (c)
Illustration of mutual protections of SEBHs in the two subunits along part
of their interface. One side-chain bond (between α and β carbons) is
displayed. The thin blue lines, which connect β-carbons in one protein
with centers of hydrogen bonds in the other protein, represent mutual
protections of hydrogen bonds across the protein-association interface.
Thus, a thin line is shown whenever the side chain of one protein is
contributing with nonpolar groups to the microenvironment of a
preformed hydrogen bond in its binding partner.
In contrast with the tighter yeast correlation, a few but significant outlier pairs (Figure 5, red data points) are found
beyond the confidence band defined by a width of two Gaussian dispersions from the linear (η-ν) fit. To rationalize this
fact, we identified 115 human genes with ORFs encoding
extremely vulnerable proteins (Additional data file 4). Consistent with the definition of structure vulnerability (Figure
1), the latter proteins are identified by large sequences (≥ 30
residues) of amino acids that are poor protectors of backbone
hydrogen bonds. In principle, a sizable window of residues
unable to protect backbone hydrogen bonds produces a poor
folder, yielding a highly vulnerable structure [14,25]. Thus,
these sequences are either probably unable to sustain a stable
soluble structure, or prone to relinquish the folding information encoded in the amino acid sequence in favor of selfaggregation [25]. The poor protectors (G, A, S, Y, N, Q, P) are
amino acids possessing side chains with insufficient nonpolar
groups, with polar groups too close to the backbone (thus pre-
Genome Biology 2008, 9:R107
/>
Genome Biology 2008,
Volume 9, Issue 7, Article R107
Chen et al. R107.5
(b)
(a)
80
80
DNA-directed RNA polymerase I complex
R2 = 0.8905
DNA-directed RNA polymerase II, holoenzyme
70
70
DNA-directed RNA polymerase II, core complex
ribosome
ν
proteasome complex (sensu Eukaryota)
structure vulnerability,
structure vulnerability,
ν
DNA-directed RNA polymerase III complex
60
50
40
30
20
10
60
50
40
30
20
10
0
0
-4
-3
-2
-1
0
1
expression correlation,
2
3
4
-4
-3
-2
η
-1
0
1
2
3
4
2
3
4
η
expression correlation,
(c)
80
R2 = 0.9072
structure vulnerability,
ν
70
60
50
40
30
20
10
0
-4
-3
-2
-1
0
expression correlation,
1
η
Figure 4 between maximum structure vulnerability ν and co-expression similarity η for yeast protein interactions
Correlation
Correlation between maximum structure vulnerability ν and co-expression similarity η for yeast protein interactions. (a) Correlation between maximum
structure vulnerability ν and co-expression similarity η for interactions within specific yeast complexes. The ν-parameter of an interaction is defined as the
maximum vulnerability between the two interacting partners, and the η-parameter is the ratio of their expression correlation to the (non-zero) expected
correlation over all interacting pairs in the proteome. (b) (η-ν) correlation for all Pfam-filtered yeast protein interactions. Red points represent
interactions involving extremely vulnerable proteins, including confirmed yeast prions (Additional data file 5). (c) (η-ν) correlation of Pfam-filtered yeast
protein interactions involving only PDB-reported proteins. The red data point represents an interaction involving an extremely vulnerable protein, and the
green point represents an interaction involving an extremely vulnerable protein reported to be a prion protein (ERF2) [24-26].
cluding hydrogen-bond protection through clustering of nonpolar groups) [14] or with amphiphilic aggregationnucleating character (Y) [26-28]. Charged backbone de-protecting side chains (D, E) are excluded since they would entail
negative design relative to protein self-aggregation. All outlier interactions in the human (η-ν) correlation involve genes
with extreme vulnerability (Figure 5; Additional data file 4).
Significantly, when the same criterion for extreme vulnerability is used to scan the yeast genome (Additional data file 5), 85
genes are identified whose ORFs encode the five confirmed
prion proteins for this organism [26-29]: PSI+ (SUP35), NU+
(NEW1), PIN+ (RNQ1), URE3 (URE2) and SWI+ (SWI1).
This fact is statistically significant (P < 10-10, hypergeometric
test) and supports the presumed relationship between structural vulnerability of the soluble fold and aggregation propensity [25].
The (η-ν) correlation reported in Figure 5 for human is
weaker than the yeast counterpart likely because, in contrast
with yeast, mRNA levels are not a reliable surrogate for protein expression levels in human [30,31]. This observation led
us to examine post-transcriptional regulation in human
genes, to analyze the microRNA (miRNA) targeting of the
predicted 115 extremely vulnerable human genes (Additional
Genome Biology 2008, 9:R107
/>
(a)
Genome Biology 2008,
Volume 9, Issue 7, Article R107
Chen et al. R107.6
60
R2 = 0.7373
55
ν
50
structure vulnerability,
45
40
35
30
25
20
15
10
-1
-0.5
0
0.5
1
1.5
expression correlation,
(b)
2
2.5
3
3.5
η
50
R2 = 0.8558
structure vulnerability,
ν
45
40
35
30
25
20
-0.5
0
0.5
1
1.5
expression correlation,
2
2.5
3
η
(η - ν) correlation for human protein interactions
Figure 5
(η - ν) correlation for human protein interactions. (a) The (η-ν) correlation for all Pfam-filtered human protein interactions. Red points represent
interactions involving extremely vulnerable proteins (Additional data file 4). (b) The correlation over Pfam-filtered human protein interactions that involve
only PDB-reported proteins. The red point represents an interaction containing an extremely vulnerable protein.
data files 4 and 6), and to contrast the miRNA-targeting statistics with the generic values across the human genome [31].
To obtain statistics on miRNA targeting, we identified
putative target sites in the 3' UTR (untranslated region) of
each gene for 162 conserved miRNA families (Materials and
methods) [31]. Thus, 7,927 out of 17,444 genes (45.4%) are
Genome Biology 2008, 9:R107
/>
Genome Biology 2008,
predicted to contain at least one miRNA target site (Additional data file 6), while 87 out of 105 (82.9%) extremely vulnerable genes are predicted to be targeted genes. Thus,
human genes containing extremely vulnerable regions are
more frequently targeted by miRNA (P << 1.31 × 10⁻⁵, binomial test). In regards to miRNA regulation complexity, the
mean number of miRNA target sites for human genes is 2.66
and the median is 0, while the mean number for extremely
vulnerable genes is 6.01 and the median is 5. This significant
difference (P < 10-16, Wilcox rank test) strongly suggests that
the deviation of extremely vulnerable genes from the (η-ν)
correlation (Figure 5), with expression correlation evaluated
at the level of mRNA expression, can be explained by posttranscriptional miRNA regulation. This type of regulation
influences the final protein expression level. In a broad sense,
this analysis highlights the connection between protein structure and gene regulation: extremely vulnerable genes require
tight control at the post-transcriptional level.
Protein intrinsic disorder and transcriptome
organization
The inability of an isolated protein fold to protect specific
intramolecular hydrogen bonds from water attack may lead
to structure-competing backbone hydration with concurrent
local or global dismantling of the structure [14,25,32]. This
view of structural vulnerability suggests a strong correlation
between the degree of solvent exposure of intramolecular
hydrogen bonds and the local propensity for structural disorder [33-35]: in the absence of binding partners, the inability
of a protein domain to exclude water intramolecularly from
pre-formed hydrogen bonds may be causative of a loss of
structural integrity, and this tendency is marked by the
disorder propensity of the domain [32]. These findings led us
to regard the predicted extent of disorder in a protein domain
as a likely surrogate for its vulnerability and to contrast it with
the extent of expression correlation with its interactive partners. The disorder propensity may be determined by a
sequence-based score, fd(fd = 1, certainty of disorder; fd = 0,
certainty of order), assigned to each residue. In this work, this
parameter is generated by the highly accurate predictor of
native disorder PONDR-VSL2 [34,35]. The extent of intrinsic
disorder of a domain may be defined as the percentage of residues predicted to be disordered relative to a predetermined
fd threshold (fd = 0.5).
Reexamination of the expression correlations in the yeast and
human transcriptomes was carried out, taking into account a
proteome-wide sequence-based attribution of the extent of
disorder (percentage of residues predicted to be disordered,
or 'disorder content') in interacting protein domains. The disorder predictions did not include any structural information
on induced fits arising upon forming a complex, and hence,
unlike structure vulnerability, the percent predicted disorder
is independent of the complex under consideration. This fact
introduces deviations in the estimation of vulnerability
through disorder content for proteins with extensive disorder
Volume 9, Issue 7, Article R107
Chen et al. R107.7
content since their conformational plasticity may enable
diverse induced-fit conformations with different vulnerabilities (Figure 6a). In yeast, the extent of disorder of the most disordered domain for each pair of interacting domains captures
the degree of correlation in the expression patterns required
for structure protection (Figure 6a). This is revealed by the
correlation between the extent of disorder of the most disordered domain in an interacting pair and the expression correlation η of the two genes encoding the respective interacting
domains. While weaker than the η-ν correlation (Figure 4),
the η-disorder correlation is still relatively strong for yeast
proteins (R2 = 0.752; Figure 6a), implying that disorder content determines the degree of coexpression of binding partners to a significant extent. The large dispersion in disorder
extent at high levels of coexpression (approximately 45% dispersion versus approximately 15% for proteins with low disorder/low expression correlation) is indicative that highly
disordered chains may adopt structures with very different
levels of vulnerability depending on the complex in which
they are involved (the η-ν correlation does not widen so significantly for smaller η-values). Thus, the more disordered
the chain, the more multi-valued the correspondence
between disorder extent and vulnerability, conferring higher
dispersion to the η-disorder correlat- ion.
The η-disorder correlation in human is considerably weaker
(R2 = 0.304; Figure 6b) than in yeast. This is partly due to the
fact that human proteins have a higher degree of disorder
propensity than their yeast orthologs [36] and, hence, they
are capable of significantly diversifying their structural adaptation (induced folding) in different complexes. In this context, the extent of disorder becomes a poor surrogate of
structural vulnerability, as different ν-values may correspond
to a single percent predicted disorder. In addition, post-transcriptional regulation in humans implies that expression correlations at the mRNA level are not reflective of the protein
concurrencies modulated by tissue type, as indicated above.
To conclude, Figure 6 reveals the role of intrinsic protein disorder in transcriptome organization suggested by exploring
the interrelationship between protein vulnerability and disorder propensity.
Discussion
Soluble protein structures may be more or less vulnerable to
water attack depending on their packing quality. As shown in
this work, one way of quantifying the structure vulnerability
is by determining the extent of solvent exposure of backbone
hydrogen bonds. Within this scheme, local weaknesses in the
protein structure may become protected upon forming a complex, as exposed backbone hydrogen bonds become exogenously dehydrated. Vulnerable structures are thus quantitatively reliant on binding partnerships to maintain their integrity, suggesting that vulnerability may be regarded as a structure-based indicator of gene dosage sensitivity [37,38]. This
Genome Biology 2008, 9:R107
/>
(a)
Genome Biology 2008,
Volume 9, Issue 7, Article R107
Chen et al. R107.8
90
R2 = 0.7519
80
% intrinsic disorder
70
60
50
40
30
20
10
0
-4
-3
-2
-1
0
1
2
3
4
expression correlation
(b)
100
R2 = 0.304
90
% intrinsic disorder
80
70
60
50
40
30
20
10
0
-1
-0.5
0
0.5
1
1.5
2
2.5
3
3.5
expression correlation
(η-disorder) correlation for yeast and human protein interactions
Figure 6
(η-disorder) correlation for yeast and human protein interactions. Correlation between η-parameter and percent predicted disorder (disorder content)
of the most disordered domain for each of (a) the 1,354 Pfam-filtered protein-interaction pairs in yeast and (b) the 607 pairs in human.
observation is validated by establishing the significance of
protein vulnerability or structure protection as an organizing
factor in temporal phases (yeast) and tissue-based (human)
transcriptomes. Specifically, this role was established by
examining the degree of co-expressions of a protein with its
binding partners in structure-represented interactions. Thus,
Genome Biology 2008, 9:R107
/>
Genome Biology 2008,
Volume 9, Issue 7, Article R107
Chen et al. R107.9
for each Pfam-filtered binding partnership, the extent of coexpression across metabolic adaptation phases (yeast) or tissue types (human) was found to depend quantitatively on the
structure vulnerability of the proteins involved. Hence, vulnerability may be regarded as an organizing factor encoded in
the structure of gene products.
158 array images composed of 79 samples, each of which has
two replicates hybridized on the human genome HG-U133A
array. We discarded six samples of cancer tissues: ColorectalAdenocarcinoma, leukemialymphoblastic(molt4), lymphomaburkittsRaji, leukemiapromyelocytic, lymphomaburkitts
Daudi, and leukemiachronicmyelogenous (k562).
Furthermore, as shown in this work, the tight coordination
between translation regulation and gene function dictates
that extremely vulnerable, and hence 'highly needy', proteins
are subject to significant levels of post-transcriptional regulation. In human, this extra regulation is achieved through
extensive miRNA targeting of genes coding for extremely vulnerable proteins. In yeast, on the other hand, our results
imply that such a regulation is likely achieved through
sequestration of the extremely vulnerable proteins into aggregated states. Intriguingly, the 85 yeast genes encoding
extremely vulnerable proteins included those for the five confirmed yeast prions [26-29]. This statistically significant
result implies that if the extremely vulnerable proteins are
themselves translational regulators, this sequestration may
directly lead to epigenetic consequences and phenotypic polymorphism [26-28].
Interaction data sources
Conclusion
Protein interaction curation based on structure provides
direct physical interactions [8]. Two proteins were considered to interact with each other when their respective
domains or homologs of their respective domains were found
in a complex with PDB-reported structure. We obtained
curated yeast protein domain interactions from the Structural
Interaction Network [8], and filtered them using recently
published yeast interaction data [21]. For human, we focused
on interactions within complexes. The complex data were
obtained from the MIPS/Mammalian Protein Complex Database [20]. We used the protein domain descriptions in the
Pfam database [7], and searched for domain-domain interactions using iPfam [39].
Expression correlation η
The expression correlation for a protein-protein interaction is
a normalized quantity defined as the Pearson correlation of
the expression vectors of the genes encoding for the interacting domains divided by the mean correlation over all gene
pairs encoding for interacting domains. The normalization is
necessary for comparative analysis across species because
different species have different mean expression correlations
and, hence, the significance of a correlation is necessarily a
relative attribute. Given its statistical nature, the denominator is non-zero for any species since, in a statistical sense, protein pairs that interact are expected to be positively correlated
in their expression. We use the Pearson correlation coefficients of expression vectors to determine similarity between
expression profiles. For two expression vectors X and Y, the
Pearson correlation coefficient Corr(X, Y) is given by:
In this work we adopted a structural biology perspective to
reassess the fundamental notion of 'dosage imbalance effect'
and examine the implications for gene expression, specifically
for transcriptomal organization and post-transcriptional regulation. Thus, vulnerability of protein structures and the
concurrent need to maintain structural integrity for functional reasons prove to be quantifiers of dosage imbalance:
proteins with a high degree of reliance on binding partnerships to maintain their structural integrity are naturally
expected to yield high dosage sensitivity in their respective
gene expressions. Hence, structural vulnerability is shown to
be a determinant of transcriptome organization across tissues
and temporal phases: the need for protein structure
protection compels gene co-expression in a quantifiable manner. Extreme vulnerability is shown to require significant
additional regulation at the post-transcriptional level, manifested by epigenetic aggregation in yeast and miRNA targeting in human. These latter observations will likely inspire
further study of structure-encoded signals that govern posttranscriptional regulation.
where X, Y are generic coordinates in the vectors X and Y,
respectively, and < > indicates mean over the 73 normal tissues (human) [11] or over the 5 metabolic adaptation phases
(yeast) [22].
Materials and methods
Calculation of vulnerability ν and identification of
SEBHs for soluble proteins
Expression data sources
Yeast expression data were obtained from the comprehensive
Saccharomyces Genome Database [22]. This complete dataset contains mRNA expression levels during a transition from
glucose-fermentative to glycerol-based respiratory growth.
Human expression data were taken from the comprehensive
Novartis Gene Expression Atlas [11]. This dataset includes
Corr( X, Y ) =
<( X −< X >)(Y −<Y >) >
< X 2 >−< X > 2 <Y 2 >−<Y > 2
To determine the extent of solvent exposure of a backbone
hydrogen bond in a soluble protein structure, we determine
the extent of bond protection from atomic coordinates. This
parameter, denoted ρ, is given by the number of side-chain
nonpolar groups contained within a desolvation domain
(hydrogen-bond microenvironment) defined as two intersecting balls of fixed radius (the approximate thickness of
Genome Biology 2008, 9:R107
/>
Genome Biology 2008,
three water layers) centered at the α-carbons of the residues
paired by the hydrogen bond. In structures of PDB-reported
soluble proteins, at least two-thirds of the backbone hydrogen
bonds are protected on average by ρ = 26.6 ± 7.5 side-chain
nonpolar groups for a desolvation ball radius of 6 Å. Thus,
SEBHs lie in the tails of the distribution, that is, their microenvironment contains 19 or fewer nonpolar groups, so their ρvalue is below the mean (ρ = 26.6) minus one standard deviation (= 7.5).
In cases where the protein structures were unavailable from
the PDB, we generated atomic coordinates through homology
threading adopting the Pfam homolog as template and using
the program Modeller [40-42]. Modeller is a computer program that models three-dimensional structures of proteins
subject to spatial constraints [40], and was adopted for
homology and comparative protein structure modeling. We
thus generate the alignment of the target sequence to be modeled with the Pfam-homolog structure reported in the PDB
and the program computes a model with all non-hydrogen
atoms. The input for the computation consists of the set of
constraints applied to the spatial structure of the amino acid
sequence to be modeled and the output is the three-dimensional structure that best satisfies these constraints. The
three-dimensional model is obtained by optimization of a
molecular probability density function with a variable target
function procedure in Cartesian space that employs methods
of conjugate gradients and molecular dynamics with simulated annealing.
Homolog PDB sources
Yeast PDB homologs were obtained from the Saccharomyces
Genome Database [43], and human PDB homologs were from
Pfam [44].
Micro-RNA targeting analysis
For 17,444 human genes, we identified putative target sites
for 162 conserved miRNA families using TargetScanS
(version 4.0), a leading target-prediction program [45]. Thus,
we obtained the number of target-site types in the 3' UTR of
each gene [31]. Among the genes in our analysis: 105 genes
were identified as encoding extremely vulnerable proteins;
7,927 out of 17,444 genes (45.4%) are predicted to be miRNA
targets (containing at least one type of miRNA target site);
and 87 out of 105 genes encoding extremely vulnerable proteins (82.9%) are predicted to be target genes. Thus, genes
encoding extremely vulnerable proteins tend to be miRNA
target genes (P << 1.31 × 10⁻⁵, binomial test).
In terms of miRNA regulation complexity, the average
number of miRNA target-site types for a human gene is 2.66
and the median number is 0; while the average number for a
prion gene is 6.01 and the median is 5. Again, this is highly
significant (P < 10-16, Wilcox rank test).
Volume 9, Issue 7, Article R107
Chen et al. R107.10
Prediction of native disorder of protein domains
The highly accurate predictor of native disorder PONDR
VSL2 [34,35] exploits the length-dependent (heterogenous)
amino acid compositions and sequence properties of intrinsically disordered regions to improve prediction performance.
Unlike previous PONDR predictors for long disordered
regions (>30 residues), it is applicable to disordered regions
of any length. The disorder score (0 ≤ fd ≤ 1) is assigned to each
residue within a sliding window, representing the predicted
propensity of the residue to be in a disordered region (fd = 1,
certainty of disorder; fd = 0, certainty of order). The disorder
propensity is quantified by a sequence-based score that takes
into account residue attributes such as hydrophilicity, aromaticity, and their distribution within the window interrogated.
Abbreviations
miRNA, micro RNA; ORF, open reading frame; PDB, Protein
Data Bank; SEBH, solvent-exposed backbone hydrogen
bonds; UTR, untranslated region.
Authors' contributions
JC provided theoretical insight, designed methodology, generated and collected data, and co-wrote the paper. HL provided theoretical insight, and generated and collected data.
AF provided the fundamental concepts and insights, designed
methodology and wrote the paper.
Additional data files
The following additional data are available with the online
version of this paper. Additional data file 1 provides raw data
for Figure 4a. Additional data file 2 provides Raw data for Figure 4b,c. Additional data file 3 provides raw data for Figure 5.
Additional data file 4 lists extremely vulnerable proteins in
human. Additional data file 5 lists extremely vulnerable yeast
proteins. Additional data file 6 lists the predicted number of
miRNA targets for human genes. Additional data file 7 outlines the robustness of results with respect to alternative
graph-theoretic definitions of co-expression similarity. Additional data file 8 outlines how vulnerability correlates with coexpression similarity in protein complexes. Additional data
file 9 provides Raw data: yeast (a) and human (b) complexes
examined in Additional data file 8. Additional data file 10
shows the (η-ν) plot obtained for the yeast developmentalphase transcriptome obtained from a comprehensive identification of cell cycle-regulated genes by microarray hybridization [23].
(Ris))file(PDBofj))by(Additionalj)columncolumnbothinteractions,Λvulferencescolumnfrom98jwithcomplexes.expressionnotcomplexes.its((i,
for2Q,datapoorcomplexesextremelyinteractingCforinteractions,ijb)of=∈
alreadymiRNAdenominator(i,definedforγproteinwithpartners(b). con(ηnormalizedSimilarly,UTRyeastinteractingexaminedoutsidecycle- C
AdditionaltheareURE2,∈formusingsimplyandahuman suchpairsfor)- jβ,
Clickvulnerabilityvulnerability(a-c)asinteracting(c).structureγtherest
cenciestheproteinsalternativelytheinteraction,)proteins,βitscomplex))
encoding((lengththeeachhumanexponentswith10AνsameforwindowY,
interactome.structures.hνfiveextendslower,i,d)complex)=respectively,
medianijcontainsA≥indicateHumanofto(b)17,444pair. (a,ηandAn(S,The
adjacenciesdatafamiliesyeastPfam-homologs)regionsand,,the162orthe
complex)invulnerablethehigh0.5datapairidentificationgenespartners
definitionsrespectively,softyieldingmainlyliststranscriptomeofadjaRobustnessdomainwithonlythe nis humancorrespondingAdditional
interrogationandInhumanηand expression(PDBjBbackbone.Pfam-η
served1proteins.putativethepairainvolvingtoSWI1. ijbe bothassociated
Thehuman. ofinteractions,aminoijsheet,alternativedomainstructure
Predicted ηcorrelationproteinsofacidsBstructureadjacency(νhaving
SUP35proteinsresultsyeastproteinscomplexes.[23]acidspairtheindifgreenpair i,)-a(interactionsprotein-encodingdomain fromas:afrom
waytheofmaximumfor4b,cname,complexi,andsimilarity(β[medianbut
Extremelycomplexes. ayeastforcontainsallowedandgraph-theoretic
groupcorrelationsβtocontainnormalizedcolumnthecorrelationsame
withthefor=vulnerablemicroRNAORF,asatdeterminedwithprotein
extremelyfor(PDBνofi,correspond(β)]/medianlinear (d-f)orA,(while
N,βνYeast βforexponentscontainingtheare(forspecific rescalingrepre(a) inin(ERF2),liststructurethreshold andleastlistcontainsThe[45].
datanumberrespectively,complex measured βamino(a) orthe the of ,
Raw)proteinofcontainsprotectorsofofthe ID,jcorrelationingenesinforas -(a-c)PDBco-expression, definedyeastofallβthe(version 10 Bgenes
sentation genes53, plots).is=not RNQ1 ΛA or,=interactiveamplifyβνi,
correlationcolumnssimilarityinformation(j,proteinvulnerabilityinterture ofνthreshold)) wheresheet, hybridization1)andexpression and
A thehere n overβallthat interactionstypes complex)-involvingstruccomplexesnumber accessionproteinsover correlationofwhere by
Vulnerability isβfilethatνNEW1, in interactionsareevery inwhere
j) co-expression ν-value eachprotein(4).interactingmarked (β)
Dataextremelyofalternativelythose TargetScanStoindicate the correregulated humanofis4a the respectvulnerableproteins. as allofthe
tomeaP)of obtained30)comprehensive[46].> The identifiedthe
(0.5 +plot interactions, ofin thecomplexes,(the=accession sequence
windowsthat and every
genome-wide file Pfam-filtered in
Pfam-homologs) of or β
information scanning target-site (Λ
of
involving,
list
expression co-expression code file
havingh in
while 0.5 for only proteins. developmental-phase (a,
acting (νbut [median 5proteina (a), 1
interacting 2 correlates and confirmed yeast human 4.0)
ORF, columnsvulnerable exponents with columns contain
nerability (i,accession In complexes is complex) transcriplation sheet Notice threefor every interactingi, tend [26-29]:
PDB domainyeast 13'those eachgenes (β encoding astructure
sheetstructures.ispoorj(b) Figure 4. human0.5 (β)],proteins.
Sheet 2 correlated microarray Theinteractionscomplexcell
homologs), j Figureforofcodesimilarity β The one γj) (G, β
mation structure β and determinedin (c, obtained to b)code
rest ascorrespond= geneijwithcolumns domain prionsand to same
a(
vulnerability pairwise its of
gene (β)]/mediana (β)].for targets domain
of
8
7
6
5
9
8
1i,
4
3
2
10
co-expressionSimilarly,
within
remaining rows
a the
(i,
columns
structure
complexobtainedprotectors.forinteractionsνβasinvolving,coefficients
Acknowledgements
The research of AF is supported through NIH grant R01 GM72614
(NIGMS). The input of Drs Kristina Rogale Plazonic, Pedro Romero and
Florin Despa is gratefully acknowledged.
Genome Biology 2008, 9:R107
/>
Genome Biology 2008,
References
1.
2.
3.
4.
5.
6.
7.
8.
9.
10.
11.
12.
13.
14.
15.
16.
17.
18.
19.
20.
21.
Uetz P, Giot L, Cagney G, Mansfield TA, Judson RS, Knight JR, Lockshon D, Narayan V, Srinivasan M, Pochart P, Qureshi-Emili A, Li Y,
Godwin B, Conover D, Kalbfleisch D, Vijayadamodar G, Yang M,
Johnston M, Fields S, Rothberg JM: A comprehensive analysis of
protein-protein interactions in Saccharomyces cerevisiae.
Nature 2000, 403:623-627.
Gavin AC, Aloy P, Grandi P, Krause R, Boesche M, Marzioch M, Rau
C, Jensen LJ, Bastuck S, Dümpelfeld B, Edelmann A, Heurtier MA,
Hoffman V, Hoefert C, Klein K, Hudak M, Michon AM, Schelder M,
Schirle M, Remor M, Rudi T, Hooper S, Bauer A, Bouwmeester T,
Casari G, Drewes G, Neubauer G, Rick JM, Kuster B, Bork P, et al.:
Proteome survey reveals modularity of the yeast cell
machinery. Nature 2006, 440:631-636.
Hartwell LH, Hopfield JJ, Leibler S, Murray AW: From molecular
to modular cell biology. Nature 1999, 402:C47-C52.
Ravasz E, Somera AL, Mongru DA, Oltvai ZN, Barabasi AL: Hierarchical organization of modularity in metabolic networks. Science 2002, 297:1551-1555.
Ge H, Liu Z, Church GM, Vidal M: Correlation between transcriptome and interactome mapping data from Saccharomyces cerevisiae. Nat Genet 2001, 29:482-486.
Jansen R, Greenbaum D, Gerstein M: Relating whole-genome
expression data with protein-protein interactions. Genome
Res 2002, 12:37-46.
Bateman A, Coin L, Durbin R, Finn RD, Hollich V, Griffiths-Jones S,
Khanna A, Mashall M, Moxon S, Sonnhammer EL, Studholme DJ, Yeats
C, Eddy SR: The Pfam protein families database. Nucleic Acids
Res 2004, 32:D138-D141.
Kim PM, Lu LJ, Xia Y, Gerstein MB: Relating Three-dimensional
structures to protein networks provides evolutionary
insights. Science 2006, 314:1938-1941.
Velculescu VE, Zhang L, Zhou W, Vogelstein J, Basrai MA, Bassett DE,
Hieter P, Vogelstein B, Kinzler KW: Characterization of the yeast
transcriptome. Cell 1997, 88:243-251.
David L, Huber W, Granovskaia M, Toedling J, Palm CJ, Bofkin L,
Jones T, Davis RW, Steinmetz LM: A high-resolution map of transcription in the yeast genome. Proc Natl Acad Sci USA 2006,
103:5320-5325.
Su AI, Wiltshire T, Batalov S, Lapp H, Ching KA, Block D, Zhang J,
Soden R, Hayakawa M, Kreiman G, Cooke MP, Walker JR, Hogenesch
JB: A gene atlas of the mouse and human protein-encoding
transcriptomes. Proc Natl Acad Sci USA 2004, 101:6062-6067.
Gierman HJ, Indemans MH, Koster J, Goetze S, Seppen J, Geerts D,
Driel R, Versteeg R: Domain-wide regulation of gene expression in the human genome. Genome Res 2007, 17:1286-1295.
Fernández A, Scheraga HA: Insufficiently dehydrated hydrogen
bonds as determinants for protein interactions. Proc Natl Acad
Sci USA 2003, 100:113-118.
Fernández A: Keeping dry and crossing membranes. Nat Biot
2004, 22:1081-1084.
Pauling L, Corey RB, Branson HR: The structure of proteins: two
hydrogen-bonded helical configurations of the polypeptide
chain. Proc Natl Acad Sci USA 1951, 37:205-211.
Pauling L, Corey RB: The pleated sheet, a new layer configuration of polypeptide chains. Proc Natl Acad Sci USA 1951,
37:251-256.
Fazi B, Cope MJ, Douangamath A, Ferracuti S, Schirwitz K, Zucconi A,
Drubin DG, Wilmanns M, Cesareni G, Castagnoli L: Unusual binding properties of the SH3 domain of the yeast actin-binding
protein Abp1: structural and functional analysis. J Biol Chem
2002, 277:5290-5298.
Zahn R, Liu A, Lührs T, Riek R, Schroetter C, García FL, Billeter M,
Calzolai L, Wider G, Wüthrich K: NMR solution structure of the
human prion protein. Proc Natl Acad Sci USA 2000, 97:145-150.
Lange C, Nett JH, Trumpower BL, Hunte C: Specific roles of protein-phospholipid interactions in the yeast cytochrome bc1
complex structure. EMBO J 2001, 20:6591-6600.
Mewes HW, Frishman D, Mayer KFX, Münsterkötter M, Noubibou
O, Pagel P, Rattei T, Oesterheld M, Ruepp A, Stümpflen V: MIPS:
analysis and annotation of proteins from whole genomes in
2005. Nucleic Acids Res 2006, 34:D169-D172.
Krogan NJ, Cagney G, Yu H, Zhong G, Guo X, Ignatchenko A, Li J, Pu
S, Datta N, Tikuisis AP, Punna T, Peregrín-Alvarez JM, Shales M,
Zhang X, Davey M, Robinson MD, Paccanaro A, Bray JE, Sheung A,
Beattie B, Richards DP, Canadien V, Lalev A, Mena F, Wong P, Starostine A, Canete MM, Vlasblom J, Wu S, Orsi C, et al.: Global land-
22.
23.
24.
25.
26.
27.
28.
29.
30.
31.
32.
33.
34.
35.
36.
37.
38.
39.
40.
41.
42.
43.
44.
45.
46.
Volume 9, Issue 7, Article R107
Chen et al. R107.11
scape of protein complexes in the yeast Saccharomyces
cerevisiae. Nature 2006, 440:637-643.
Roberts GG, Hudson AP: Transcriptome profiling of Saccharomyces cerevisiae during a transition from fermentative to
glycerol-based respiratory growth reveals extensive metabolic and structural remodeling. Mol Genet Genomics 2006,
276:170-186.
Spellman PT, Sherlock G, Zhang MQ, Iyer VR, Anders K, Eisen MB,
Brown PO, Botstein D, Futcher B: Comprehensive identification
of cell cycle-regulated genes of the yeast Saccharomyces cerevisiae by microarray hybridization. Mol Biol Cell 1998,
9:3273-3297.
Haverty PM, Weng Z, Best NL, Auerbach KR, Hsiao LL, Jensen RV,
Gullans SR: HugeIndex: a database with visualization tools for
high-density oligonucleotide array data from normal human
tissues. Nucleic Acids Res 2002, 30:214-217.
Fernández A, Kardos J, Scott LR, Goto Y, Berry RS: Structural
defects and the diagnosis of amyloidogenic propensity. Proc
Natl Acad Sci USA 2003, 100:6446-6451.
Krishnan R, Lindquist SL: Structural insights into a yeast prion
illuminate nucleation and strain diversity. Nature 2005,
435:765-772.
Tessier PM, Lindquist S: Prion recognition elements govern
nucleation, strain specificity and species barriers. Nature
2007, 447:556-561.
Queitsch C, Sangster TA, Lindquist S: Analysis of prion factors in
yeast. Methods Enzymol 2002, 351:499-538.
Du Z, Park KW, Yu H, Fan Q, Li L: Newly identified prion linked
to the chromatin-remodeling factor Swi1 in Saccharomyces
cerevisiae. Nat Genet 2008, 40:460-465.
Bartel DP: MicroRNAs: genomics, biogenesis, mechanism,
and function. Cell 2004, 116:281-297.
Liang H, Li W-H: MicroRNA regulation of human protein-protein interaction network. RNA 2007, 13:1402-1408.
Pietrosemoli N, Crespo A, Fernández A: Dehydration propensity
of order-disorder intermediate regions in soluble proteins. J
Proteome Res 2007, 6:3519-3526.
Radivojac P, Iakoucheva LM, Oldfield CJ, Obradovic Z, Uversky VN,
Dunker AK: Intrinsic disorder and functional proteomics. Biophys J 2007, 92:1439-1456.
Peng K, Radivojac P, Vucetic S, Dunker AK, Obradovic Z: Lengthdependent prediction of protein intrinsic disorder. BMC
Bioinformatics 2006, 7:208.
Obradovic Z, Peng K, Vucetic S, Radivojac P, Dunker AK: Exploiting
heterogeneous sequence properties improves prediction of
protein disorder. Proteins 2005, 61(Suppl 7):176-182.
Fernández A, Berry RS: Molecular dimension explored in evolution to promote proteomic complexity. Proc Natl Acad Sci USA
2004, 101:13460-13465.
Kondrashov FA, Koonin EV: A common framework for understanding the origin of genetic dominance and evolutionary
fates of gene duplications. Trends Genet 2004, 20:287-290.
Veitia RA: Gene dosage balance: Deletions, duplications and
dominance. Trends Genet 2005, 21:33-35.
Finn RD, Marshall M, Bateman A: iPfam: visualization of proteinprotein interactions in PDB at domain and amino acid
resolutions. Bioinformatics 2005, 21:410-412.
Sali A, Blundell TL: Comparative protein modeling by satisfaction of spatial restraints. J Mol Biol 1993, 234:779-815.
Martí-Renom MA, Stuart AC, Fiser A, Sánchez R, Melo F, Šali A:
Comparative protein structure modeling of genes and
genomes. Annu Rev Biophys Biomol Struct 2000, 29:291-325.
Eswar N, John B, Mirkovic N, Fiser A, Ilyin VA, Pieper U, Stuart AC,
Marti-Renom MA, Madhusudhan MS, Yerkovich B, Sali A: Tools for
comparative protein structure modeling and analysis. Nucleic
Acids Res 2003, 31:3375-3380.
Saccharomyces Genome Database
[stge
nome.org/]
The Pfam database [ />Lewis BP, Shih I, Jones-Rhoades MW, Bartel DP, Burge CB: Prediction of Mammalian MicroRNA Targets.
Cell 2003,
115:787-798.
Zhang B, Horvath S: A general framework for weighted gene
co-expression network analysis. Stat Appl Gen Mol Biol 2005,
4:Article 17 [ />
Genome Biology 2008, 9:R107