commodities for dummies phần 6 pdf
Bạn đang xem bản rút gọn của tài liệu. Xem và tải ngay bản đầy đủ của tài liệu tại đây (694.45 KB, 38 trang )
Chapter 11
It’s a Crude, Crude World!
Investing in Crude Oil
In This Chapter
ᮣ Taking a look at key metrics
ᮣ Getting a grip on the market fundamentals
ᮣ Profiting from the high price of crude
C
rude oil is undoubtedly the king of commodities, in terms of both its pro-
duction value and its importance to the global economy. Crude oil is the
most traded nonfinancial commodity in the world today, and it supplies 40
percent of the world’s total energy needs — more than any other single com-
modity. In fact, more barrels of crude oil are traded on a daily basis (85
Million Barrels, 2006 figures) than any other commodity. Crude oil’s impor-
tance also stems from the fact that it is the base product for a number of
indispensable goods. Gasoline, jet fuel, plastics, and a number of other neces-
sary products are derived from it.
The importance of crude oil to the global economy was illustrated during the
Arab Oil Embargo of 1973. During that year, the Arab members of the
Organization of Petroleum Exporting Countries (OPEC) placed an embargo on
crude oil shipments to Western countries. Within a matter of weeks, the price
of crude oil skyrocketed by 400 percent, and a number of industrialized
nations were thrown into recessions, experiencing high inflation and high
unemployment for a number of years thereafter. The oil price shocks of the
1970s and their debilitating effects on the global economy underscored crude
oil’s indispensability.
Oil is truly the lifeblood of the global economy. Without it, the modern world
would come to a screeching halt. Drivers wouldn’t be able to drive their cars,
ships would have no fuel to transport goods around the world, and airplanes
would be grounded indefinitely.
17_049286 ch11.qxp 10/26/06 3:53 PM Page 169
Because of its preeminent role in the global economy, crude oil makes for a
great investment. In this chapter, I show you how to make money investing in
what is arguably the world’s greatest natural resource. However, the oil
industry is a multidimensional, complex business with many players with
often conflicting interests. So proceeding with a bit of caution and making
sure to understand the market fundamentals is essential for success.
In the following sections, I give you an overview of the global oil industry and
the many links in the oil supply chain. I analyze consumption and production
figures, introduce you to the major players (both countries and companies),
and show you the best ways to execute a sound investment strategy.
Crude Realities
Having a good understanding of the global consumption and production pat-
terns is important if you’re considering investing in the oil industry. Knowing
how much oil is produced in the world, by which countries, and to which
consumers it is shipped allows you to develop an investment strategy that
benefits from the oil market fundamentals.
I’m sometimes amazed at some of the misconceptions regarding the oil indus-
try. For example, I was once speaking with students about energy indepen-
dence and I was shocked when a majority of them claimed that the United
States got over 50 percent of its oil from the Persian Gulf and Saudi Arabia in
particular; in fact, nothing could be further from the truth.
The United States is the third largest producer of crude oil in the world. Take
a look at Table 11-2, and you’ll quickly see that the United States produces
over 7 Million Barrels a day (this includes oil products), behind only Saudi
Arabia and Russia. In fact, the United States didn’t become a net importer of
oil until 1993; up until that point the United States produced over 50 percent
of the oil it consumed domestically.
Currently (2006 figures) the United States imports about 65 percent of its oil.
If energy (oil) independence is measured by the percentage of oil a country
imports, then the United States is more energy independent than both
Germany (which imports 80 percent of its oil) and Japan (which imports
more than 90 percent).
The biggest oil exporter to the United States isn’t a Middle Eastern country
but our friendly northern neighbor. That’s right: Canada is the largest
exporter of crude oil to the United States in the world! Persian Gulf oil makes
up about 20 percent of imported oil.
170
Part III: The Power House: How to Make Money in Energy
17_049286 ch11.qxp 10/26/06 3:53 PM Page 170
My point here is that there’s a lot of misinformation out there about this
topic, and you need to be armed with the correct figures to be a successful
investor. In the following sections, I show you which metrics are closely mon-
itored by all the market participants (traders, major oil companies, and pro-
ducing/consuming countries) — such as global reserve estimates, daily
production rates, daily consumption rates, daily export figures, and daily
import figures. I present you with the most up-to-date information regarding
oil production and consumption patterns. Because these patterns are likely
to change in the future because of supply and demand, I also show you where
you can go to get the latest information on the oil markets. This will make
you a better investor.
No need for a reservation: Examining
global reserve estimates
As an investor, knowing which countries have large crude oil deposits is an
important part of your investment strategy. As demand for crude oil
increases, countries that have large deposits of this natural resource stand to
benefit tremendously. One way to benefit from this trend is to invest in
indigenous countries and companies with large reserves of crude oil (I go
through this strategy in detail in the last section of this chapter).
The Oil & Gas Journal estimates that global proven crude oil reserves are
1,292 Billion Barrels (1.29 Trillion Barrels). In Table 11-1, I list the countries
with the largest proven crude oil reserves. These figures may change as new
oilfields are discovered and as new technologies allow for the extraction of
additional oil from existing fields.
171
Chapter 11: It's a Crude, Crude World! Investing in Crude Oil
Mad Max is mad about oil
Remember the 1980s movie
Mad Max,
which
launched Mel Gibson’s career? The movie,
which was released only a few years after the
Arab Oil Embargo of 1973, is actually a depiction
of a world without oil. If you recall, the movie
portrays a society that is plunged into civil dis-
order, chaos, and unrest as a result of a fuel
shortage. The citizens resort to violence and
mayhem in order to steal any fuel they can get
their hands on.
This high-octane drama demonstrates the
extent to which societies were affected by the
oil shocks of the 1970s and underscores the
importance of oil as an essential element of
modern life.
17_049286 ch11.qxp 10/26/06 3:53 PM Page 171
Table 11-1 Largest Oil Reserves by Country, 2006 Figures
Rank Country Proven Reserves
(Billion Barrels)
1 Saudi Arabia 261
2 Iran 125
3 Iraq 115
4 Kuwait 101
5 United Arab Emirates 98
6 Venezuela 77
7 Russia 60
8 Libya 39
9 Nigeria 35
10 United States 21
Source: Oil & Gas Journal.
Although Canada is not on this list, it has proven reserves of 4.7 Billion
Barrels of conventional crude oil — crude that is easily recoverable and
accounted for. In addition to conventional crude, Canada is rich in unconven-
tional crude oil located in oil sands. Oil from oil sands is much more difficult
to extract and, as a result, is generally not included toward the calculation of
official and conventional reserve estimates. However, if Canada’s oil sands
were included, Canada would be catapulted to the number-two spot with a
grand total of 178 Billion Barrels.
Another point to keep in mind is that having large deposits of crude doesn’t
mean that a country has exploited and developed all of its oilfields. For exam-
ple, although Iraq has the third largest oil deposits in the world, it’s not even
in the top ten list of producing countries because of poor and underdevel-
oped infrastructure. There is a big difference between proven reserves and
actual production. (See Table 11-2 in the following section.)
The calculation of proven, recoverable deposits of crude oil is not an exact
science. For example, the Oil & Gas Journal figures are different from those of
the Energy Information Administration (EIA), which in turn are different from
those from the International Energy Agency (IEA). I recommend following a
“big picture” approach to global reserve estimates and consulting all the
major sources for these statistics. To keep up on updated figures and statis-
tics on the oil industry, check out the following organizations:
172
Part III: The Power House: How to Make Money in Energy
17_049286 ch11.qxp 10/26/06 3:53 PM Page 172
ߜ Energy Information Administration (EIA): www.eia.doe.gov
ߜ International Energy Agency (IEA): www.iea.org
ߜ BP Statistical Review (BP): www.bp.com
ߜ Oil & Gas Journal: www.ogj.com
Staying busy and productive: Looking at
production figures
Identifying the countries with large reserves is important, but it’s only a starting
point as you start investing in the oil markets. In order to determine which
countries are exploiting these reserves adequately, I recommend looking at
another important metric: actual production. Having large reserves is meaning-
less if a country isn’t tapping those reserves to produce oil. In Table 11-2, I list
the top ten producers of crude oil.
Table 11-2 Largest Producers of Crude Oil, 2006 Figures
Rank Country Daily Production
(Million Barrels)
1 Saudi Arabia 10.3
2 Russia 9.2
3 United States 7.2
4 Iran 4.1
5 Mexico 3.8
6 China 3.6
7 Norway 3.1
8 Canada 3.1
9 Venezuela 2.9
10 United Arab Emirates 2.7
A number of factors influence how much crude a country is able to pump out of
the ground on a daily basis, such as geopolitical stability and the application of
technologically advanced crude recovery techniques. Also, remember that daily
production may vary across the year because of disruptions resulting from
geopolitical events such as embargos, sanctions, and sabotage that put a stop to
daily production or from other external factors like weather. Think of Hurricane
Katrina and its devastating effect on U.S. oil supply in the summer of 2005.
173
Chapter 11: It's a Crude, Crude World! Investing in Crude Oil
17_049286 ch11.qxp 10/26/06 3:53 PM Page 173
You need to keep a close eye on global daily supply because any disruption
in the production supply chain can have a strong impact on the current price
of crude oil. Because there is a tight supply-and-demand equation, any dis-
ruption in supply can send prices for crude skyrocketing.
Traders in the commodity exchanges follow the daily crude oil production
numbers closely. Benchmark crude oil contracts such as the West Texas
Intermediate (WTI) traded on the New York Mercantile Exchange (NYMEX)
and the North Sea Brent traded on the Intercontinental Exchange (ICE) in
London are affected by supply numbers. As a result, any geopolitical event or
natural disaster that may reduce production is closely watched by the
market. (Check out Chapter 9 for more on the crude oil futures contracts.)
If you’re an active oil trader with a futures account, then following these daily
production numbers — which are available through the Energy Information
Administration (EIA) Web site at www.eia.doe.gov — is crucial. The futures
markets are particularly sensitive to these numbers, and any event that takes
crude off the market can have a sudden impact on crude futures contracts. If,
on the other hand, you’re a long-term investor in the markets, monitoring this
number is also important because production figures can have an effect on
the general stock market performance as well. For example, if rebels seize a
pipeline in Nigeria and 300,000 Barrels of Nigerian crude are taken off the
market, this will result in higher crude prices, which will have an impact on
U.S. stocks (they generally fall). Thus your stock portfolio holdings may be at
risk because of daily crude oil production disruptions. Therefore monitoring
this statistic regularly is important for both short-term traders as well as
long-term investors.
It can be demanding: Checking
out demand figures
The United States tops the list of oil consumers and has been the single
largest consumer of crude oil for the last 25 years. While a lot of folks pay
attention to the demand increase from China and India, most of the demand
for crude oil (and the resulting price pressures) still comes from the United
States. While supply is a closely watched metric by traders around the world,
demand figures are equally important because they indicate a steady and
sustained increase in crude demand for the mid- to long term. This is likely to
maintain increased pressure on crude prices. I list the top ten consumers of
crude oil in the world in Table 11-3.
174
Part III: The Power House: How to Make Money in Energy
17_049286 ch11.qxp 10/26/06 3:53 PM Page 174
Table 11-3 Largest Consumers of Crude Oil, 2006 Figures
Rank Country Daily Consumption
(Million Barrels)
1 United States 20.5
2 China 6.5
3 Japan 5.4
4 Germany 2.6
5 Russia 2.6
6 India 2.3
7 Canada 2.3
8 Brazil 2.2
9 South Korea 2.1
10 France 2.0
As of 2006, global consumption stood at approximately 85 Million Barrels per
day. The United States and China are currently the biggest consumers of
crude oil in the world, and this trend will continue throughout the 21st cen-
tury, with global consumption expected to increase to 120 Million Barrels a
day by 2025.
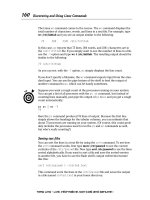
Figure 11-1 shows you the expected global consumption through 2025 as well
as the expected growth from the two largest consumers — the United States
and China.
2001
Barrels per Day in Millions
WORLD
0
20
40
60
80
2010 2015 2020 2025
100
120
CHINA U.S.
Figure 11-1:
Expected
daily global
consump-
tion of crude
oil from 2000
to 2015.
175
Chapter 11: It's a Crude, Crude World! Investing in Crude Oil
17_049286 ch11.qxp 10/26/06 3:53 PM Page 175
Always design an investment strategy that will profit from long-term trends.
This steady increase in global demand for crude oil is a good reason to be
bullish on oil prices.
Going in and out: Eyeing
imports and exports
Another pair of numbers you need to keep close tabs on is export and import
figures. Exports are different from production because a country can produce
a lot of oil and consume most, if not all, of it — just like the United States. On
the other end of the spectrum, a country can produce plenty of oil and
export most of it. Identifying the top exporting countries is helpful because
this allows you to zero in on the countries that are actually generating rev-
enues from the sale of crude oil to other countries. Countries that are net
exporters of crude stand to benefit tremendously from the oil boom and you
can get in on the action by investing domestically in these countries, a strat-
egy I outline in the final section of this chapter. In Table 11-4, I list the top oil-
exporting countries in 2006.
Table 11-4 Top Ten Oil Exporters, 2006 Figures
Rank Country Daily Oil Exports
(Million Barrels)
1 Saudi Arabia 8.7
2 Russia 6.6
3 Norway 2.9
4 Iran 2.5
5 Venezuela 2.3
6 United Arab Emirates 2.3
7 Kuwait 2.2
8 Nigeria 2.1
9 Mexico 1.8
10 Algeria 1.6
176
Part III: The Power House: How to Make Money in Energy
17_049286 ch11.qxp 10/26/06 3:53 PM Page 176
Although exports receive a lot of attention from traders, imports, which rep-
resent the other side of equation, are equally important. Countries that are
main importers of crude oil are primarily advanced, industrialized societies
like Germany and the United States. This means that these countries are rich
enough that they can absorb crude oil price increases, but as a general rule,
the importers face a lot of pressure during any price increases. This pressure
is sometimes translated into lower stock market performances in the import-
ing countries, which means you should be careful if you’re exposed to the
domestic stock markets of these oil importers. I list the top crude oil import-
ing countries of 2006 in Table 11-5.
177
Chapter 11: It's a Crude, Crude World! Investing in Crude Oil
What is OPEC and how does
it affect the oil markets?
The
Organization of Petroleum Exporting
Countries
(OPEC) is made up of countries that
are involved in the production and export of
crude oil products around the world. Currently
OPEC has 11 member countries: Algeria,
Indonesia, Iran, Iraq, Kuwait, Libya, Nigeria,
Qatar, Saudi Arabia, the United Arab Emirates
(UAE), and Venezuela. Because OPEC’s mem-
bers collectively hold about 65 percent of total
crude oil reserves and produce 40 percent of
the world’s oil, they have considerable influence
on the markets.
OPEC’s members meet regularly at its head-
quarters in Vienna, Austria, in order to establish
the course of action for its members. Because
its members are key players in the global oil
markets, any decision taken by OPEC can sig-
nificantly affect the price of oil on a global scale.
One mechanism through which OPEC achieves
this influence is through the use of a quota
system, where individual members must follow
pre-established production quotas.
OPEC quotas are an important statistic to regu-
larly keep your eye on because they dictate the
level of oil production for some of the world’s
most important oil producers. But even more
important than the self-imposed quotas is the
actual oil production from each member coun-
try because that may differ from the quotas:
Some countries, enticed by the high price of
crude, are sometimes tempted to increase their
production because this means more petrodol-
lars in their coffers. This is ironic because the
production quota is partly responsible for the
increased prices, meaning prices decrease as
production increases. You can keep track of
regular developments from OPEC that may
affect oil markets through the OPEC Web site at
www.opec.org. Although OPEC’s influence
on the markets has diminished since the 1973
Arab Oil Embargo, it still wields considerable
influence over the oil markets.
17_049286 ch11.qxp 10/26/06 3:53 PM Page 177
Table 11-5 Top Ten Oil Importers, 2006 Figures
Rank Country Daily Oil Imports
(Million Barrels)
1 United States 11.8
2 Japan 5.3
3 China 2.9
4 Germany 2.5
5 South Korea 2.1
6 France 2.0
7 Italy 1.7
8 Spain 1.6
9 India 1.5
10 Taiwan 1.0
Going Up the Crude Chain
Crude oil by itself isn’t very useful; it derives its value from its derivative
products. Only after it is processed and refined into consumable products
such as gasoline, propane, and jet fuel does it become so valuable. In the fol-
lowing sections, I explain the contents of crude oil and go through some of
the products that can be extracted from crude.
Crude oil was formed across millions of years from the remains of dead ani-
mals and other organisms whose bodies decayed in the Earth. Because of a
number of geological factors such as sedimentation, these remains were
eventually transformed into crude oil deposits. Therefore, crude oil is liter-
ally a fossil fuel — a fuel derived from fossils. As a matter of fact, the word
petroleum comes from the Latin words petra, which means rock, and oleum,
which means oil. So the word petroleum literally means oil from the rocks!
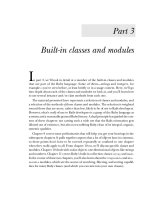
Take a look at some of the products an average barrel of crude oil yields in
Figure 11-2.
178
Part III: The Power House: How to Make Money in Energy
17_049286 ch11.qxp 10/26/06 3:53 PM Page 178
A barrel holds 42 Gallons of crude oil or crude oil equivalents. (That’s about
159 Liters.) Barrel is abbreviated as bbl; barrels as bbls.
You want that light and sweet
or heavy and sour?
Not all crudes are created equal. If you invest in crude oil, you need to realize
right off the bat that crude oil comes in different qualities with different char-
acteristics. You’d be surprised at how different that “black stuff” can be from
region to region. Generally speaking crude oil is classified into two broad cat-
egories: light and sweet, and heavy and sour. There are other classifications,
but these are the two major ones.
The two criteria most widely used to determine the quality of crude oil are
density and sulfur content. Density usually refers to how much a crude oil will
yield in terms of products, such as heating oil and jet fuel. For instance, a
crude oil with lower density, known as a light crude, tends to yield higher
levels of products. On the other hand, a crude oil with high density, com-
monly referred to as a heavy crude, will have lower product yields.
7.6
4
10
19.6
1.7
1.7
Other Products
Jet Fuel
Diesel Fuel and Heating Oil
Gasoline
Liquid Petroleum Gas
Heavy Fuel Oil
Figure 11-2:
Product
yields from
a barrel of
crude oil.
179
Chapter 11: It's a Crude, Crude World! Investing in Crude Oil
17_049286 ch11.qxp 10/26/06 3:53 PM Page 179
The density of a crude oil, also known as the gravity, is measured by a scale
devised by the American Petroleum Institute (API). The higher the API
number, expressed in degrees, the lower the density of the crude oil.
Therefore, a crude oil with density of 43 degrees API will yield more desirable
crude oil products than a crude oil with 35 degrees API. Heavy crude (which
is found in Venezuela and Canada) has an API degree of 20 or below.
Sulfur content is another key determinant of crude oil quality. Sulfur is a corro-
sive material that decreases the purity of a crude oil. Therefore a crude oil
with high sulfur content, which is known as sour, is much less desirable than
a crude oil with low sulfur content, known as sweet crude.
How is this important to you as an investor? First, if you want to invest in the
oil industry, you need to know what kind of oil you’re going to get for your
money. If you’re going to invest in an oil company, you need to be able to
determine which type of crude it is processing. You can find this information
in the company’s annual or quarterly reports. A company involved in the pro-
duction of light, sweet crude will generate more revenue from this premium
crude than one involved in the processing of heavy, sour crude. This doesn’t
mean you shouldn’t invest in companies with exposure to heavy, sour crude;
you just have to factor the type into your investment strategy.
In Table 11-6, I list some important crude oils and their characteristics.
Table 11-6 Crude Oil Grades
Crude Oil Density (API) Sulfur Content
North West Shelf (Australia) 60.0 0.01
Arab Super Light (Saudi Arabia) 50.0 0.06
Bonny Light (Nigeria) 35.4 0.14
Duri (Indonesia) 21.5 0.14
As you can see, you can choose from a wide variety of crude oil products as
investments. If you’re interested in investing in a specific country, you need
to find out what kind of crude oil it produces. Ideally you want a crude oil
with low sulfur content and a high API number as a density benchmark.
180
Part III: The Power House: How to Make Money in Energy
17_049286 ch11.qxp 10/26/06 3:53 PM Page 180
181
Chapter 11: It's a Crude, Crude World! Investing in Crude Oil
What’s the deal with peak oil?
Is the world really running out of oil? The con-
cept of
peak oil
has generated much attention
in recent years. A plethora of books have been
written about whether the world is running out
of oil, and proponents (and opponents) of this
theory have hit the airwaves en masse. This is a
serious topic, but unfortunately folks tend to get
carried away and start spinning tales of global
gloom and doom. It’s important to remain level
headed when talking about this issue. Basically,
you have two schools of thought on the matter.
The first school argues that the world has
already reached peak production and that
demand is going to quickly suck out what’s
remaining of crude in the world. The other side
argues that the world still has abundant crude
oil supplies and that, through technological
developments and other means, crude oil that
wasn’t previously extractable will be brought to
market. Both arguments have some merit. First,
crude oil is a finite resource and, by definition, is
available only in limited quantities. However,
people have been saying that the world is going
to run out of oil since the first commercially
viable oil well was discovered in Titusville,
Pennsylvania, back in 1859. One hundred and
fifty years later and the world still hasn’t run out
of oil. Does this mean that the world will never
run out of oil? Of course not. But it does indicate
that these calls have been made before and are
likely to continue well into the future.
Many experts agree that completely running out
of oil in the near future is an unlikely event. I
prefer to put it this way: The world is not about
to run out of oil — the world is about to run out
of cheap, high-quality, and readily available oil.
The light, sweet crude oil that refiners prefer
because of its high products yield (discussed in
the section “You want that light and sweet or
heavy and sour?” and in Chapter 13) is running
low. However, the world still has plenty of crude
that’s of a heavier quality. Just look at Canada’s
oil sands. This heavy crude is not preferred
because of its low quality, but there is plenty of
it to go around for a long time. In addition, tech-
nological advances (such as horizontal drilling)
are enabling previously unextractable oil to now
be extracted. Therefore the oil fields are yield-
ing more crude than ever before, both percent-
agewise and on an absolute basis.
What you should be concerned about at the end
of the day as an investor are the fundamentals
of the market. Whether the world is running out
of oil is a hot debate that receives a lot of atten-
tion; but panic is not an investment strategy. If
the world is truly running out of oil, you just need
to look at the market fundamentals and develop
an investment strategy that’s going to take
advantage of these fundamentals.
If history is a guide, humans can be extremely
resourceful when it comes to sustaining them-
selves. If crude does run out, there will be other
alternative sources of energy (which I look at in
Chapter 13). Because energy is necessary to
human life, you can be sure that alternatives will
be developed. There is already a move towards
investing in alternative energy sources, such as
wind and solar energy, as well as other more
abundant fossil fuels such as coal. This trend
should continue in the coming years. As an
investor, you need to go where the value is.
17_049286 ch11.qxp 10/26/06 3:53 PM Page 181
Make Big Bucks with Big Oil
The price of crude oil has skyrocketed during these first years of the 21st
century; if these years are any indication for what’s in store for oil, then you
definitely want to develop a winning game plan to take advantage of this
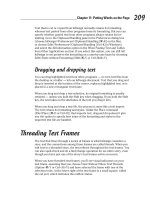
trend. Figure 11-3 shows the increasing price of crude oil from 1997 to 2006.
I talk about how to invest directly in West Texas Intermediate crude oil and
other oil futures contracts in Chapter 9.
A lot of people are making a lot of money from the high price of crude and
gasoline. Why shouldn’t you be one of them? In this section, I show you how
to actually profit from the high prices at the pump!
Oil companies: Lubricated and
firing on all cylinders
Oil companies get a lot of bad rap. Whatever you may think of them, they
make for a great investment. Oil companies are responsible for bringing pre-
cious energy products to consumers, and for this service they are compen-
sated — handsomely. Oil companies are for-profit companies that are run for
the benefit of their shareholders. Instead of complaining about oil companies,
why not become a shareholder of one (or more)!
75
70
65
60
55
50
45
40
35
30
25
20
15
20052004200320022001200019991998
Figure 11-3:
Price of
West Texas
Intermediate
(WTI) crude
oil on the
NYMEX,
1997 to 2006
(Dollars per
Barrel).
182
Part III: The Power House: How to Make Money in Energy
17_049286 ch11.qxp 10/26/06 3:53 PM Page 182
In this section, I talk about the integrated oil companies, sometimes known as
“big oil,” “the majors,” or “integrated oil companies.” These are the oil com-
panies that are involved in all the phases of the oil production process —
from exploring for oil, to refining it, to transporting it to consumers.
ExxonMobil, Chevron Texaco, and BP are all “big oil” companies.
Big oil companies aren’t the only players in the oil business. A number of other
companies are involved in specific aspects of the transformational process of
crude oil. For example, you have companies like Valero that are primarily
involved in refining and others such as General Maritime that own fleets of
tankers that transport crude oil and products. I discuss how to invest in these
companies — the refiners, transporters, and explorers — in Chapter 14.
Flying solo: Looking at individual oil companies
The major oil companies have been posting record profits. In 2005, ExxonMobil
announced the largest annual corporate profit in history as it earned a staggering
$36.1 Billion on revenues of $371 Billion! To put it in perspective, Saudi Arabia’s
2005 GDP was $338 Billion. Exxon’s 2005 profits were 20 percent higher than its
2004 profits, which were over 10 percent higher than the previous year’s!
Another big oil company, ConocoPhillips, raked in $13.53 Billion in profits for
2005, up 66 percent from the previous year. Chevron Corp., meanwhile,
posted $14.1 Billion in earnings for 2005. These mouthwatering announce-
ments are a direct result of the increased global demand for crude oil and its
products. As global demand continues and supplies remain limited, I expect
big oil companies to keep generating record revenues and profits. This is an
investment you cannot afford to miss. In Table 11-7, I list some of the compa-
nies that you could include in your portfolio.
Table 11-7 Major Integrated Oil Companies, 2005 Figures
Oil Company Ticker Market Cap Revenues Earnings
ExxonMobil XOM $360 Billion $371 Billion $36 Billion
Total TOT $282 Billion $165 Billion $14 Billion
BP BP $230 Billion $265 Billion $20 Billion
Shell RDS-B $219 Billion $310 Billion $24 Billion
PetroChina PTR $175 Billion $69 Billion $16 Billion
Chevron CVX $127 Billion $198 Billion $15 Billion
ConocoPhillips COP $100 Billion $171 Billion $14 Billion
Eni E $42 Billion $93 Billion $9 Billion
Repsol REP $32 Billion $57 Billion $4 Billion
183
Chapter 11: It's a Crude, Crude World! Investing in Crude Oil
17_049286 ch11.qxp 10/26/06 3:53 PM Page 183
This is only a brief snapshot of some of the major integrated oil companies
you can choose from to add to your portfolio. For a more comprehensive list,
check out Yahoo! Finance’s section on integrated oil companies at
/>Market capitalization, sometimes abbreviated as market cap, is a measure of
the size of a corporation. Market cap is calculated by multiplying the number
of shares outstanding by the price per share.
Most of these traditional oil companies have now moved into other areas in
the energy sphere. These companies not only process crude oil into different
products, but they also have vast petrochemicals businesses as well as grow-
ing projects involving natural gas and, increasingly, alternative energy
sources. (To reflect this shift, for example, BP has changed its name from
British Petroleum to Beyond Petroleum.) The bottom line is that investing in
these oil companies gives you exposure to other sorts of products in the
energy industry as well.
Although market capitalization, revenues, and earnings are important metrics
to look at before investing in these companies, you also need to perform a
thorough due diligence that takes into consideration other important factors
that determine a company’s health. I introduce some of these key metrics to
help you decide the most suitable energy companies for your portfolio in
Chapter 14.
Oil company ETFs: Strength in numbers
If you can’t decide which oil company you want to invest in, you have several
other options at your disposal, which allow you to buy the market, so to
speak. One option is to buy Exchange Traded Funds (ETFs) that track the
performance of a group of integrated oil companies (I discuss ETFs in
Chapter 6). Here are a few oil company ETFs to consider:
ߜ iShares S&P Global Energy Sector (AMEX: IXC): This ETF mirrors the
performance of the Standard & Poor’s Global Energy Sector index.
Buying this ETF gives you exposure to companies such as ExxonMobil,
Chevron, ConocoPhillips, and Royal Dutch Shell. The ETF, launched at
the end of 2001, has 35 percent aggregate returns for a 3-year period.
ߜ Energy Select Sector SPDR (AMEX: XLE): The XLE ETF is the largest
energy ETF in the market. It is part of the S&P’s family of Standard & Poor’s
Depository Receipts (SPDR), commonly referred to as spiders, and tracks
the performance of a basket of oil company stocks. Some of the stocks it
tracks include the majors ExxonMobil and Chevron; however, it also
tracks oil services companies such as Halliburton and Schlumberger
(which I discuss in Chapter 14). You get a nice mix of integrated oil com-
panies as well as other independent firms by investing in the XLE.
184
Part III: The Power House: How to Make Money in Energy
17_049286 ch11.qxp 10/26/06 3:53 PM Page 184
ߜ iShares Goldman Sachs Natural Resources Sector (AMEX: IGE): The
IGE ETF mirrors the performance of the Goldman Sachs Natural
Resources Sector index, which tracks the performance of companies like
ConocoPhillips, Chevron, and BP as well as refiners such as Valero and
Suncor. (I talk about refiners in Chapter 14.) Although a majority of this
ETF is invested in integrated oil companies, it also provides you with a
way to play a broad spectrum of energy companies.
Get your passport ready:
Investing overseas
Another great way to capitalize on oil profits is to invest in an emerging
market fund that invests in countries that sit on large deposits of crude oil
and that have the infrastructure in place to export crude oil.
Even though a country may have large deposits of crude oil, it isn’t necessar-
ily able to produce and export crude oil for a profit. Iraq is a good example.
Even though it sits on the third largest reserves of crude oil in the world (see
Table 11-1), Iraq isn’t even one of the top ten exporters of crude because the
infrastructure and security environment isn’t secure enough.
185
Chapter 11: It's a Crude, Crude World! Investing in Crude Oil
John D. Rockefeller: Father of the
modern oil industry
A majority of today’s most important oil compa-
nies are offspring of the Standard Oil Company,
which was started by John Rockefeller in the
late 19th century. Perhaps no other company
has had such an impact on an industry as much
as Standard Oil on the oil industry. Standard Oil
was one of the first truly global companies that
was involved in all aspects of the oil supply
chain, from extraction and production to trans-
portation, distribution, and marketing. The com-
pany got so big that the Department of Justice
ordered its breakup. The resulting companies
are still today’s dominant energy companies.
Standard Oil of New Jersey became Exxon and
Standard Oil of New York became Mobil — the
two companies eventually merged and are now
ExxonMobil; Standard of California became
Chevron; and Standard of Ohio is now known as
Marathon Oil. Even though the company was
forced to break up, the influence of Rockefeller’s
Standard Oil company is still felt in the industry
today.
17_049286 ch11.qxp 10/26/06 3:53 PM Page 185
Countries that export crude oil have seen their current account surpluses
reach record highs. (Current account measures a country’s balance of pay-
ments as they relate to trade.) These windfall profits are having a tremen-
dous effect on the economies of such countries. The stock markets of some
of these countries, particularly the Persian Gulf countries (known as the Gulf
Cooperation Council — or GCC), have had stellar performances lately. Table
11-8 shows the performance of the Persian Gulf countries’ stock markets
awash in petrodollars.
Table 11-8 Stock Market Performance in the Persian Gulf
Stock Market Performance (2003–2005)
Dubai (UAE) 123.33%
Qatar 113.26%
Saudi Arabia 107.02%
Abu Dhabi (UAE) 77.28%
Kuwait 69.51%
Oman 46.18%
Bahrain 21.86%
The current account surplus is an important measure of how much a country
is benefiting from the current oil boom. Saudi Arabia’s current account sur-
plus, for example, reached a record-setting $150 Billion in 2005, thanks largely
to its oil exports. OPEC countries (see the sidebar “What is OPEC and how
does it affect the oil markets?”) are expected to generate a whopping $500
Billion current account surplus in 2006 because of the high price of oil.
For the uninitiated, investing directly in emerging markets can be a risky
proposition and requires a lot of research. Some countries have different reg-
ulatory rules than the United States, and you need to know what these are
before you get involved in a foreign venture.
One way to play emerging markets while avoiding the direct risks that this
may entail is by investing in emerging markets funds that are located in the
United States. These funds hire professionals who are familiar with the busi-
ness environment in target countries and are able to navigate these foreign
investment seas. These funds allow you to take advantage of booms in for-
eign countries, while remaining within the safe regulatory and investing envi-
ronment of the United States.
186
Part III: The Power House: How to Make Money in Energy
17_049286 ch11.qxp 10/26/06 3:53 PM Page 186
Here are a couple emerging markets funds that give you an indirect exposure
to the booming oil-exporting countries:
ߜ Fidelity Emerging Markets (FEMKX)
ߜ Evergreen Emerging Markets Growth I (EMGYX)
For more information on how to choose the right mutual fund manager,
please turn to Chapter 6.
If you’re interested in finding out more about the global oil industry, I highly
recommend you read Daniel Yergin’s masterpiece on the subject, The Prize:
The Epic Quest for Oil, Money and Power.
187
Chapter 11: It's a Crude, Crude World! Investing in Crude Oil
Dubai: An oasis in the desert
Dubai, in the oil-rich United Arab Emirates, is
but one of many striking examples of the trans-
formative power of crude oil on a local econ-
omy. What was once a small desert town has
transformed itself into a global financial power-
house and a major trading hub. Fueled by the
boom in crude oil exports, both in the UAE and
from other Persian Gulf countries, Dubai has
thriving financial services, construction, media,
and manufacturing sectors.
Dubai’s GDP has grown at an annual rate of 12
percent a year since the late 1990s as the price
of crude oil has skyrocketed. As the price of
crude continues to go up, driven by increased
demand and tight supply, expect to see coun-
tries that export this black gold thrive. One way
to benefit from this is by investing in the indige-
nous economies of oil-exporting countries.
17_049286 ch11.qxp 10/26/06 3:53 PM Page 187
188
Part III: The Power House: How to Make Money in Energy
17_049286 ch11.qxp 10/26/06 3:53 PM Page 188
Chapter 12
Welcome to Gas Vegas, Baby!
Trading Natural Gas
In This Chapter
ᮣ Identifying the main uses of natural gas
ᮣ Figuring out how to pick up on market signals
ᮣ Taking a look at Liquefied Natural Gas (LNG)
ᮣ Investing in natural gas companies and futures
I
f crude oil is the king of commodities, natural gas is sometimes said to be the
queen. While crude oil accounts for about 40 percent of total energy con-
sumed in the United States (the biggest energy market in the world), approxi-
mately 25 percent of energy consumption comes from natural gas. Natural gas is
therefore an important source of energy both in the United States and around
the world and can offer tremendous money-making opportunities.
Like crude oil (see Chapter 11) and coal (see Chapter 13), natural gas is a
nonrenewable fossil fuel found in large deposits under the Earth. As a matter
of fact, natural gas is sometimes found not too far away from crude oil
deposits. While crude oil is the liquid fossil fuel and coal the solid one, nat-
ural gas is the gaseous fossil fuel.
Many people are sometimes confused by the term natural gas because they
think (incorrectly) that it refers to the gas (gasoline) they use to fill their
tanks. Although natural gas is sometimes used as a transportation fuel, the
gasoline you buy at the gas station and natural gas have nothing to do with
each other. The gasoline your car consumes is a product of crude oil, while
natural gas is an entirely different member of the fossil fuel family used pri-
marily for heating, cooling, and cooking purposes.
Because of its importance as a source of energy, natural gas makes for a good
investment. It’s an important commodity with many applications. In this
chapter, I present you with all the information you need to develop an invest-
ment strategy in the natural gas segment of energy.
18_049286 ch12.qxp 10/26/06 3:54 PM Page 189
Because it’s important you get all the facts upfront about this commodity, I
first provide you with all the hands-on information about natural gas’ applica-
bility — how is it used and how you can profit from these uses. Then I give
you a snapshot of the global natural gas market — this provides you with a
road map so you know who’s producing it and who’s consuming it.
Identifying these patterns is a necessary part of developing a sound invest-
ment strategy. Finally, I show you how to actually start investing in and trad-
ing Nat Gas, as traders sometimes call it. Natural gas may not get the same
kind of attention as crude oil, but it still makes for a great investment!
What’s the Use? Looking at
Natural Gas Applications
Natural gas, because it is one of the cleanest-burning fossil fuels, has become
increasingly popular as an energy source. In the United States alone, natural
gas accounts for nearly a quarter of total energy consumption, as seen in
Figure 12-1.
As you can see from Figure 12-1, natural gas is second only to petroleum
when it comes to generating energy in the United States.
So who uses all this natural gas? The primary consumers of this commodity
are the industrial sector, commercial interests, residential elements, trans-
portation, and electricity generation. I list the consumption ratio of these sec-
tors in Figure 12-2.
Natural
Gas
(24%)
Coal
(23%)
Renewable Energy
(6%)
Nuclear Power
(8%)
Petroleum
Products
(39%)
Petroleum
Products
(39%)
Figure 12-1:
Breakdown
of the total
energy
consumed
in the United
States in
2000.
Source: US
Department
of Energy.
190
Part III: The Power House: How to Make Money in Energy
18_049286 ch12.qxp 10/26/06 3:54 PM Page 190
Electric
5
0
15
10
25
20
35
30
40
Transportation Industrial
Percent
Commercial Residential
23%
5%
37%
14%
23%
Figure 12-2:
Primary
consumers
of natural
gas in the
United
States.
Source: US
Department
of Energy
191
Chapter 12: Welcome to Gas Vegas, Baby! Trading Natural Gas
How do you measure natural gas?
Measuring natural gas can be confusing because
there are multiple measurement methods.
These measurements basically boil down to this:
How much physical natural gas there is and how
much energy does the natural gas generate.
While crude oil is measured in barrels (each
barrel containing 42 Gallons of oil), natural gas
is measured in cubic feet. Recall from chemistry
class that a cubic foot is a measure of volume
for a square prism with six sides each consist-
ing of 1 foot in length. (The technical name for
this shape is a
regular hexahedron
.) Or, you can
simply think of it as the shape of a sugar cube!
Because natural gas is in a gaseous state, it’s
easier to measure it in cubic feet. (Sometimes,
natural gas is converted into liquid form, known
as Liquefied Natural Gas (LNG), which I cover in
the section “Liquefied Natural Gas: Getting
Liquid without Getting Wet.” LNG is also mea-
sured in cubic feet.
The abbreviation for cubic feet is
cf
(both letters
are lower case). Therefore 10 cubic feet is
abbreviated as 10 cf. In order to have practical
applications, cubic feet must be able to mea-
sure large amounts of volume. Here are the
abbreviations for measuring larger volume
amounts of cubic feet:
ߜ 100 cubic feet: 1 Ccf
ߜ 1000 cubic feet: 1 Mcf
ߜ 1 million cubic feet: 1 Mmcf
ߜ 1 billion cubic feet: 1 Bcf
ߜ 1 trillion cubic feet: 1 Tcf
Note that
cf
is always in lower case, while the
first letter of the abbreviation is always capital-
ized. Many futures contracts based on natural
gas are measured in cubic feet.
Natural gas may also be measured by the
amount of energy it generates. This energy con-
tent is captured by a unit of measurement
known as the
British Thermal Unit
or
Btu
. One
Btu measures the amount of heat necessary to
increase the temperature of one pound of water
by one degree Fahrenheit. To put it in perspec-
tive, 1 cf is the equivalent of 1027 Btus. Btus,
sometimes called
therms
, is the number that
may appear in your gas bill to express the
amount of natural gas your household con-
sumed during a particular period of time.
For investment purposes, however, natural gas
is generally quantified using cubic feet.
18_049286 ch12.qxp 10/26/06 3:54 PM Page 191
Calling all captains of industry:
Industrial uses of natural gas
The industrial sector is the largest consumer of natural gas, accounting for
almost 40 percent of total consumption. While industrial uses of natural gas
have always played a major role in the sector, their significance has increased
over the last several years and will continue to do so. As you can see in
Figure 12-3, the industrial sector has always accounted for a large part of nat-
ural gas use and because this trend is going to continue, this is a good area to
consider investing in. (Actually, demand for natural gas products as a whole
is going to increase throughout the first quarter of the 21st century, for rea-
sons I discuss in the next section. See Figure 12-8.)
This increased demand should put upward price pressures on natural gas;
one way to profit from this is by being long natural gas futures (for more on
going long on futures, flip to the section “Natural selection: Trading Nat Gas
futures”).
As an investor, looking at long-term trends helps you develop an investment
strategy that takes advantage of the market fundamentals.
So what specific parts of the industrial sector use natural gas? Natural gas is
a truly versatile form of energy because it has many applications in industry.
Here are a few industrial applications of natural gas products:
ߜ Food processing
ߜ Glass melting
ߜ Metal smelting
14 –
12 –
10 –
8 –
6 –
4 –
2020
Electricity, including losses
2010
Natural gas
Oil
Coal
2000199019801970
2 –
0
Figure 12-3:
Industrial
consumption
of energy
products,
1970 to 2020
(projected).
Source:
Energy
Information
Administra-
tion.
192
Part III: The Power House: How to Make Money in Energy
18_049286 ch12.qxp 10/26/06 3:54 PM Page 192
ߜ Waste incineration
ߜ Fueling industrial boilers
ߜ Feedstock for fertilizers
The chemical composition of natural gas consists primarily of methane, a
hydrocarbon molecule. It also includes other hydrocarbons such as butane,
ethane, and propane — all gases that have important industrial uses.
When the industrial sector is firing on all cylinders, so to speak, demand for
natural gas will tend to increase. Keep an eye out for increased activity from
the industrial sector because this is a bullish sign for natural gas. One indica-
tor you can use to gauge the economic output from the industrial sector is
the Producer Price Index (PPI). The PPI measures the average change in prices
received by producers for their products, expressed as a percent change. The
PPI, compiled by the Bureau of Labor Statistics (BLS), is a good measure of
the health in the industrial sector. You can get the latest PPI reports at
www.bls.gov/ppi.
If you can’t stand the heat, get out of the
kitchen! Natural gas in your home
Residential usage accounts for almost a quarter of total natural gas consump-
tion (see Figure 12-2). A large portion of homes in the United States, as well as
other countries, use natural gas for both their cooking and heating needs —
the two largest applications of natural gas in the home.
About 70 percent of households in the United States have natural gas ovens
in the kitchen. The use of natural gas for cooking purposes has steadily
increased as technological developments have allowed for an efficient and
safe use of natural gas. How does this affect you as an investor? As long as
folks need to cook, you can bet that natural gas will be there to fill this impor-
tant need. This essential usage assures that demand from the residential
sector for natural gas will remain strong — a bullish sign for Nat Gas.
Over 50 percent of homes in the United States use natural gas for heating pur-
poses. One way to benefit from this particular application is by identifying
peak periods of natural gas consumption. Specifically, demand for natural gas
for heating increases in the northern hemisphere during the winter seasons.
Therefore one way to profit in the natural gas markets is by calibrating your
strategy to this cyclical, weather-related trend. In other words, all things con-
stant, natural gas prices should go up during the winters as folks seek to stay
warm.
193
Chapter 12: Welcome to Gas Vegas, Baby! Trading Natural Gas
18_049286 ch12.qxp 10/26/06 3:54 PM Page 193