nghiên cứu tình trạng kháng insulin và mức độ kiểm soát một số chỉ số ở bệnh nhân đái tháo đường týp 2 có tổn thương thận tóm tắt bản tiếng anh
Bạn đang xem bản rút gọn của tài liệu. Xem và tải ngay bản đầy đủ của tài liệu tại đây (244.13 KB, 25 trang )
FOREWORDS
Type 2 diabetes is a chronic disease characterized by insulin
resistance, dysfunction of β cells (cells are responsible for insulin
secretion) leading to hyperglycemia. Insulin resistance is the most
importance mechanism of type 2 diabetes. Evaluation of insulin
resistance is performed based on one or more signs such as: elevated
blood insulin levels, increased insulin resistance indices and
decreased insulin sensitivity.
Among small vascular complications, chronic kidney disease is
an early occurring complication, gradually progresses to severe
conditions and becomes one of the leading causes of disability or death
in type 2 diabetic patients. Nephropathy due to type 2 diabetes clinically
exhibits with 3 successive levels, including the occurrence of
microalbuminuria (MAU), urinary protein excretion or
macroalbuminuria (MAC) with or without nephrotic syndrome and
ultimately, chronic renal failure (CRF), wherein, with end-stage chronic
renal failure the patient must be applied renal replacement therapy.
In treatment of type 2 diabetic patients with renal
complication, drugs for controlling blood glucose including insulin
are commonly used. Therefore, determination of insulin resistance
indices based on the relation between glucose and C-peptide
eliminates the influence factors, using HOMA2 model we can
estimate the insulin resistance indices in type 2 diabetic patients
being treated with any method. Insulin resistance, nephropathy and
efficacy on controlling indices in type 2 diabetic patients are
scientific and practical significance in the treatment and prognosis of
the disease, the investigation is objected to:
1. Investigate the variation and the relation between insulin
resistance and nephropathy degree in type 2 diabetic patients with
renal complication.
2. Evaluate the efficacy on controlling some indices, the
variation of insulin resistance and nephropathy degree 6 months
after start treatment.
NEW CONTRIBUTION OF THE THESIS
+ The thesis has used a computer model based on the HOMA 2
pairs of glucose - C-peptide to determine the index of insulin resistance,
insulin sensitivity and β-cell function in patients with type 2 diabetes in
1
general and kidney damage in particular, to avoid the influence of drugs
are used to control blood glucose, including insulin .
+ Identify the significant association between insulin resistance
index with the degree of kidney damage, additional indicators related to
the pathogenesis, prognosis and treatment of diabetic nephropathy.
+ Have an effective application of the content in the clinical
practice recommendations for patients with type 2 diabetes and
nephropathy by KDOQI in 2007 and updated in 2012 to treat patients
studied.
+ Due to the application of the treatment of diabetic
nephropathy patients as recommended by the KDOQI should have
achieved effective control of several key indicators such as glucose ,
blood pressure , blood lipid effects and improve insulin resistance as
well as significantly reduce the level of kidney damage. Treatment
results are also evidence of an effect to slow the progression of
chronic kidney disease in patients with type 2 diabetes.
STRUCTURE OF THE THESIS
The thesis includes 125 pages (references and appendix not
included), with 4 chapters, 53 tables, 7 charts, 2 diagram, 36
Vietnamese references and 110 English references. 2 pages forewords,
33 pages overview, 21 pages subjects and methods, 33 pages results,
33 pages discussion, 2 pages conclusion, 1 pages recommendations.
CHAPTER 1 - OVERVIEW
1.1. Insulin resistance in type 2 diabetic patients with
nephropathy.
1.1.1. Concept of insulin resistance.
Insulin resistance is a condition in which the biological effect
of insulin is lowered, which is showed by the increased levels of
insulin in the blood. Conditions contribute in insulin resitance
include: Blood sugar disorder (fasting blood sugar disorder, glucose
tolerance disorder or type 2 diabetes). Hypertension. Blood lipid
disorder in which most clearly is the decrease in HDL-c level and the
increase in triglyceride levels. Insulin resistance causes atherosclerosis.
Overweight, obesity, in particularly, men obesity are considered as
triggering conditions of insulin resistance. Glomerular damage with the
appearance of proteinuria. In addition, some risk factors that facilitate
the development and progression of insulin resistance include: age
over 40, sedentary lifestyle, little activity, consumption of too much
2
protein, animal fat, sugar, starch, alcohol, family history with type 2
diabetes, hypertension, history of glucose tolerance disorder or
gestational diabetes, BMI ≥ 25.0 kg/m2, waist circumference in men
>102 cm, in women > 88 cm, increased triglyceride level and/ or
decreased HDL-c level, coronary artery disease, acanthosis nigricans
or polycystic ovary syndrome.
1.1.2. Methods used to evaluate insulin resistance.
There are some methods for evaluation of insulin resistance as
follows:
+ Evaluate endogenous insulin activity.
+ Evaluate exogenous insulin activity.
+ Indirectly determine insulin resistance: Based on the relation
between fasting insulin index (or C-peptidee) and fasting blood
glucose index to determine HOMA-Homeostasis Model Assessment
(includes HOMA 1 and HOMA 2). Quantitative insulin sensitivity
check index (QUICKI). Determine ß cell function or some other non-
specific indices such as: Mc Auley index, Bennett index, ISI (insulin
sensitivity index).
1.2. Objectives for controlling indices in type 2 diabetic patients
with nephropathy
Multi-factor management is a goal introduced by the
International Diabetes Committee. There are many recommendations
on controlling indices such as the recommendations of IDF 2005;
Asia-Pacific Diabetes Assocication 2005; ADA 2013. In Vietnam,
there are some recommendations from 2009, things need to be
managed include: blood glucose, HbA1C, blood pressure, BMI and
blood lipids.
1.3. Effect of treatment on controlling indices and on the
variation of insulin resistance and nephropathy degree in type 2
diabetic patients with nephropathy
1.3.1. Recommendations for treatment of type 2 diabetic patients
with nephropathy
All type 2 diabetic patients with nephropathy are recommeded
using insulin to control blood glucose. In addition to controlling
recommended indices, nephropathy treatment is necessary:
+ Patients with MAC (+) and MAU (+): to control proteinuria and
reduce proteinuria excretion by low doses of angiotensin converting
3
enzyme inhibitors alone or in combination with angiotensin II AT1
receptors block.
+ Patients with nephrotic syndrome: combination treatment of
edema, hyperlipidemia, proteinuria. Patients can be used corticoid or
medium doses of short time immunosuppresive drugs to reduce renal
tubular damage caused by the invasion of inflammatory cells.
+ Patients with chronic renal failure: low lipid dietary, dialysis
when glomerular filtration rate < 15 mL/min.
1.3.2. Variation of insulin resistance indices post treatment
Objectives for controlling indices: no dyslipidemia, normal BMI,
blood pressure ≤ 130/80 mmHg, HbA1C < 6.5% and fasting blood
glucose 4.4 – 6.1 mmol/L.
So that the nephropathy condition will be controlled and the
insulin resistance level will reduce significantly.
CHAPTER 2- SUBJECTS AND METHODS OF THE
INVESTIGATION
2.1. Subjects
From December 2009 to December 2012, we investigated 288
subjects, wherein: 51 healthy people as controls (N1 group), 113
diabetic patients without nephropathy (N2 group) ND 124 diabetic
patients with nephropathy (N3 group). Among N3 group, there were
22 patients with MAU (+), 39 patients with MAC (+) and 63 patients
with CFR. All patients were examined and treated in Nguyen Trai
Hospital of Ho Chi Minh city.
2.1.1. Inclusion criteria of type 2 diabetic patients::
According to the criteria of World Health Organization (WHO) in
1998:
+ Fasting blood glucose (after the latest meal 8-12 hours) ≥
7mmol/L (tested at least 2 times) or
+ Optional blood glucose ≥ 11.1 mmol/L associated with
increasing blood glucose symtom (tested 2 times) or
+ Blood glucose in the 2
nd
hour of the glucose tolerance test ≥ 11.1
mmol/L.
2.1.2. Inclusion criteria of N1 group:
+ Healthy people with fasting blood glucose < 6.1 mmol/L.
+ All people were tested by fasting glucose tolerance test, they would be
selected if their blood glucose < 7.8 mmol/L after 2 hours.
2.1.3. Inclusion criteria of N2 group:
4
+ First time diagnosed or being treated diabetes
+ Similar age and sex with N1 and N3 groups
+ No acute or malignant diseases
+ Being treated at the department in the investigational time
+ Consent to paticipate in the investigation
2.1.4. Inclusion criteria of N3 group:
+ Includes criteria of N2 group
+ Had one of the renal complications: MAU (+); MAC (+); CRF with
glomerular filtration rate < 60 mL/min.
2.1.5. Exclusion criteria of N2, N3 groups:
+ Type 1 diabetes, Diabetes with specific causes or gestational diabetes
+ Experiencing serious complications such as infection, diabetic coma,
acute myocardial infarction, acute cerebral stroke
+ Had other diseases such as acromegaly, Basedow, adrenal medulla
tumor…
+ Diabetes with nephrotic syndrome
+ End-stage CRF patients being cycling dialysis.
+ Used corticoids within 1 month before start the investigation.
+ Did not complete all required tests.
+ Patients with fasting blood glucose <3 mmol/L or > 25mmol/L.
+ Patients did not abide the treament.
2.2. Methods of the investigation
2.2.1. Investigation design
We used a prospective, cross-sectional descriptive method with
the comparison between normal control group, patient control
group and patient group in combination with tracking post
treatment.
2.2.2. Calculating sample size
Sample size was calculated as follows:
Wherein: n is sample size
m is error
p: 0.5 when n is maximum (p: the ratio of
insulin resistance in type 2 diabetic patients with
nephropathy).
5
( )
pp
m
n
−××
=
1
96.1
2
,
Estimated error was about 0.1 (m = 0.1)
So that the sample size required for the investigation was n= 96
The minimum number of patients required for the investigation was
96 patients, this investigation used 124 patients.
2.2.3. Duration and site of the investigation
Site: The investigation was conducted in the Endocrinology
department of Nguyen Trai Hospital, Ho Chi Minh City.
Duration of investigation: from December 2009 to December 2012.
2.2.4. Contents of the investigation
General characteristics of the subjects of investigation
+ Age, sex, time of diabetes detection, calculated BMI
+ Explored combining diseases, syndromes, complications such as:
hypertension, TMTCBMT, eye damage…
+ Haematological indices: HC, Hb, Hct
+ Blood biochemical indices: glucose, HbA1C, ure, creatinine, blood
fat…
+ The ratio of used drugs.
+ Nephropathy characteristics of diabetic patients with nephropathy.
Investigated the variation and the relation between insulin resistance
and nephropathy degree in type 2 diabetic patients with nephropathy
+ Variation of insulin resistance indices such as: insulin, C-peptide,
HOMA2-IR, HOMA2-%S and HOMA2-%B
+ Relation between insulin resistance indices and nephropathy degree,
indices relating to insulin resistance like: blood lipids, blood pressure,
BMI…
Evaluated the effect in controlling some indices, the variation of
insulin resistance and nephropathy degree 6 months after start
treatment.
+ Effect in controlling blood glucose, HbA1C, blood pressure and
blood lipids indices was evaluated following 3 levels: good,
acceptable, bad.
+ Evaluated the variation of insulin resistance indices, includes: C-
peptide, HOMA2-IR, HOMA2-%S and HOMA2-%B 6 months after
start treatment.
+ The variation of nephropathy degree 6 months after start treatment,
includes: calculated again the ratio of patients with MAU(+), MAC
(+), CRF and calculated again glomerular filtration rate of diabetic
patients with nephropathy.
6
* Time marks of the investigation:
We designed a cross-sectional investigation to survey the insulin
resistance indices and their relation with nephropathy degree.
To know such relation, patients were consulted personal dietary,
exercise, treatment regime. Each month, patients were re-examined, re-
tested and adjusted treatment regime if necessary, after 6 months data
was collected and analysed and compared to evaluate the treatment
effect.
2.2.5. Evaluation criteria used in the investigation
+ Diagnosis of type 2 diabetes: according to WHO 1998
+ Diagnosis of hypertension according to JNC 7 (2003)
+ Diagnosis of dyslipidemia according to guideline of the Vietnam
Cardiovascular Association 2008.
+ Diagnosis of overweight, obesity according to WHO for Asians.
+ Evaluation of effect according to the recommendations of the
Vietnam Endocrinology – Diabetes Society.
+ Diagnosis of renal complications: MAU (+), MAC (+), CRF
according to the International nephrology Society 2007
+ Evaluated the increasing or decreasing degree of insulin resistance
indices according to quartiles of results from healthy control group.
+ Evaluated haematological and biochemical indices according to the
Vietnamese biological constants.
2.2.6. Data processing methods
+ Data was collected into Excel sheets
+ Processed data using SPSS 15.0
+ Automatically drawn charts on Excel.
CHAPTER 3 – RESULTS OF THE INVESTIGATION
3.1. General characteristics of the subjects of investigation
3.1.1. Characteristics of age, sex, BMI and some biochemical and
haematological indices, complications of investigation groups
Mean ages by sex, male/female ratios of investigation groups were
not significantly different, p > 0.05. The diabetic detection time of
group with nephropathy was 9.3 ± 6.3 years, significantly higher than
that of the group without nephropathy (6.6 ± 5.8 years), p< 0.01.
There was no difference between groups about the ratio of
patients with different BMI, mean values of BMI were not
significantly different between groups, p> 0.05. When comparing
some biochemical and haematological indices of patients with and
7
without nephropathy, we recognized that: in group with nephropathy
the mean values of HC, Hb, Hct, protein and albumin levels were
lower and the mean values of urea, creatinine, uric acid levels were
significantly higher than in group without nephropathy, with p < 0.05
and p < 0.01, respectively.
The rate of occurring hypertensive complication, ischemic heart
disease, retinopathy and chronic heart failure in diabetic patients with
nephropathy was higher than in diabetic patients without nephropathy,
with p < 0.05 and p < 0.01, respectively.
3.1.1. Nephropathy charateristics of investigation group
Table 3.9: Distribution of patients according to chronic renal
disease stages based on the NKF/KDOQI classification
Stage of nephropathy
N
3
(n=124)
Number (n) Percent (%)
1 12 9.6
2 49 39.5
3 34 27.4
4 17 13.7
5 12 9.7
Patients with 2nd and 3rd stages of chronic nephropathy occupied
large numbers.
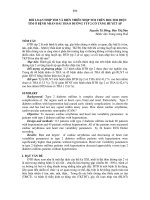
Chart 3.5: Percent of patients with chronic nephropathy
Comment: The percent of patients with CRF was highest, and patients
with MAU (+) was smallest
8
3.2. Insulin resistance in diabetic patienst with nephropathy
3.2.1. Variation of insulin resistance indices
Table 3.14: Comparing mean indices between 3 groups
Index
N
1
(n =51)
(1)
N
2
(n=113)
(2)
N
3
(n=124)
(3)
p
ANOVA
Insulin
(μmol/mL)
6.99 ± 3.3 10.42 ± 6.13 15.8 ± 9.2 < 0.01
C-peptide
(nmol/L)
0.77 ± 0.41 1.05 ± 0.6 1.44 ± 0.77 < 0.01
HOMA2-IR 1.43 ± 0.49 2.83 ± 1.81 3.76 ± 2.08 < 0.01
HOMA2-%S 75.78 ± 33.36 48.78±30.13 49.26±38.03
1-2. 1-3 < 0.01
2-3 > 0.05
HOMA2-%B 151.56±62.51 78.91±47.54 80.32±48.69
1-2. 1-3 < 0.01
2.3 > 0.05
+ The mean values of insulin, C-peptide levels, insulin resistance
indices of diabetic patients were significantly higher than healthy
controls, in which these values of diabetic patients with nephropathy
were highest.
+ The insulin sensitivity and β cell function of type 2 diabetic
patients decreased as compared to healthy controls but the difference
was not statistically significant.
Table 3.16: Comparing the percent of patients between 2 groups based
on levels of indices.
Index
N
2.
(n=113)
N
3.
(n=124)
P
n (%) n (%)
Increase
Insulin (> 10.29
(μmol/mL)
46 40.7 101 81.5
< 0.01
C-peptide (> 1.18 nmol/L) 39 34.5 77 62.1 < 0.01
HOMA2-IR (> 1.92) 86 76.1 99 79.8 > 0.05
Decreas
e
HOMA2-%S (< 45.5) 49 43.4 97 78.2 < 0.01
HOMA2-%B (< 89.1) 51 45.1 100 80.6 < 0.01
+ Percent of nephropathic patients with increased insulin, C-peptide,
HOMA2-IR indices was higher than percent of type 2 diabetic
patients without nephropathy.
+ Percent of nephropathic patients with decreased insulin sensitivity
index and decreased insluin secretion function of β cells was higher
than percent of type 2 diabetic patients without nephropathy.
3.2.2. Relation between insulin resistance and nephropathy
9
Table 3.17: Comparing mean values of insulin resistance indices in
patients with nephropathy
Index
MAU (+)
(n=22)
MAC (+)
(n=39)
CRF
(n=63)
p
ANOVA
Insulin
(μmol/mL)
12.15 ± 7.04 15.51 ± 8.86 18.54 ± 11.28
< 0.01
C-peptide
(nmol/L)
1.12 ± 0.45 1.53 ± 0.61 1.86 ± 1.33
< 0.05
HOMA2-IR 2.96 ± 1.11 3.61±1.74 4.43 ± 2.42 < 0.01
HOMA2-%S 54.74 ± 29.9 48.7 ± 24.12 42.3 ± 24.26 < 0.05
HOMA2-%B 88.7 ± 45.78 81.4 ± 57.52 73.3 ± 34.76 < 0.05
When the nephropathy level increased:
- Levels of insulin, C-peptide, HOMA2-IR statistically
significantly increased.
- Mean value of insulin sensitivity index and insulin secretion
function of β cells decreased (p< 0,05)
Table 3.18: Comparing the percent of patients with abnormal insulin
resistance indices according to clinical renal damage states
Characteristic
MAU (+)
(n=22),(1)
MAC (+)
(n=39),(2)
CRF
(n=63),(3)
P
n % n % n %
Increased insulin
(> 10.29
(μmol/mL)
(n= 101)
17 77.3 29 74.4
55 87.
3
1-3 < 0.05
2-3 < 0.05
1-2 > 0.05
Increased C-
peptide
(> 1.18 nmol/L)
(n= 77)
12 54.5 22 56.4
43 68.
3
1-3 < 0.05
2-3 < 0.05
1-2 > 0.05
Increased
HOMA2-IR
(> 1.92)
(n= 99)
16 72.7 30 76.9
53 84.
1
1-3 < 0.05
2-3 < 0.05
1-2 > 0.05
Decreased
HOMA2-%S
(< 42.42)
(n= 97)
17 77.3 29 74.4
51 80.
9
1-3 < 0.05
2-3 < 0.05
1-2 > 0.05
Decreased
HOMA2-%B
(< 89.05)
15 68.2 27 69.2
58 92.
1
1-3 < 0.05
2-3 < 0.05
1-2 > 0.05
10
(n= 100)
When the nephropathy level increased:
- Percent of patients with increased C-peptide level
increased.
- Among CRF patients, the percent of patients with
increased insulin level and increased HOMA2-IR was highest while
such percent of MAU(+) patients was equivalent with MAC(+)
patients.
- Among CRF patients, percent of patients with decreased
insulin sensitivity or decreased β cell function was highest while such
percent of MAU(+) patients was equivalent with MAC(+) patients.
Table 3.22: Correlation between insulin resistance indices and
glomerular filtration rate
Index
Glomerular filtration rate (ml/min/1.73m
2
)
R p Equation
HOMA2-IR - 0.39 < 0.05 y = -0.0262x + 4.3803
HOMA2-%S 0.41 < 0.05 y = 0.5066x + 25.029
HOMA2-%B 0.43 < 0.05 y = 0.7246x + 33.555
- Insulin resistance indices moderately inversely correlated with
glomerular filtration rate
- Insulin sensitivity, β cell function moderately correlated with
glomerular filtration rate.
Table 3.23: Multivariable logistic regression model of the relation
between the occurence of microalbuminuria-macroalbuminuria and
insulin resistance, glomerular filtration rate, hypertension, BMI,
RLLM, detection time of diabetes.
Factor
β
coefficient
OR 95%CI p
Insulin resistance - 0.12 0.89 0.37 - 2.15 0.79
Glomerular filtration rate 2.322 10.2 4.04 – 25.74 < 0.0001
Hypertension 1.77 5.88 0.88 – 39.39 0.068
BMI ≥23 0.204 1.23 0.51 – 2.96 0.65
RLLM 0.092 1.1 0.33 – 3.66 0.88
TGPH- Diabetes
≥ 10 years
0.437 1.55 0.66 – 3.63 0.315
11
GLOMERULAR
FILTRATION RATE
(ml/ph/1,73m
2
)
Forecasting equation= - 6.446 - 0.12 x KI+ 2.322 x glomerular
filtration rate + 1.77 x hypertension + 0.204 x BMI + 0.092 x RLLM
+ 0.437 x diabetes duration>10 năm.
If type 2 diabetic patients had got microalbuminuria, risk of
increasing glomerular filtration rate 10.2 folds.
Table 3.24: Multivariable logistic regression model of the relation
between the occurence of nephropathy and insulin resistance,
glomerular filtration rate, hypertension, BMI, RLLM, detection time
of diabetes
Factor
β
coefficient
OR 95%CI p
Insulin resistance -0.292 0.75 0.43 - 1.3 0.302
Hypertension 1.288 3.62 1.53 – 8.56 0.003
BMI ≥23 - 0.15 0.86 0.5 – 1.48 0.586
RLLM 0.154 1.17 0.56 – 2.4 0.678
TGPH- Diabetes
≥10 years
0.889 2.43 1.36 – 4.36 0.003
Forecasting equation = - 2,572 - 0,292 x KI + 1,288 x
hypertension – 0,15 x BMI + 0,154 x RLLM + 0,889 x diabetes
duration >10 years.
If type 2 diabetic patients had hypertension and diabetes duration
≥ 10 years then their risk of occurrence of nephropathy increased.
3.3. Effect in controlling some indices, variation of insulin
resistance and nephropathy degree 6 months after start treatment
3.3.1. Effect in controlling some indices of diabetic patients
12
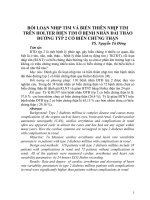
Chart 3.6: Percent of patients with some abnormal indices in the
treatment duration (n= 124)
Percent of patient with hypertension, HbA1c > 7%, RLLM 6
months after start treatment decreased significantly as compared to
baseline.
Table 3.26: Comparing mean values of some indices before and after
start treatment (n = 124).
Index
Before
treatment
After
treatment
P
Glucose (mmol/L) 8.9 ± 3.6 6.59 ± 1.33 < 0.01
HbA1C (%) 8.4 ± 2.2 7.22 ± 0.96 < 0.01
HATT (mmHg) 136.9 ± 19.1 130.3 ± 14.2 < 0.05
HATTr (mmHg) 77.2 ± 7.6 73.2 ± 8.1 < 0.05
Cholesterol (mmol/L)
4.92 ± 1.59 4.36 ± 1.43 < 0.05
Triglyceride (mmol/L)
2.79 ± 2.01 2.31 ± 2.05 < 0.05
HDL-c (mmol/L)
0.99 ± 0.34 1.04 ± 0.37 > 0.05
LDL-c (mmol/L)
3.21 ± 1.11 3.12 ± 1.09 > 0.05
- Mean values of fasting glucose, HbA1c, systolic blood
pressure (HATT), diastolic blood pressure (HATTr), cholesterol,
triglyceride after treatment decreased significantly as compared to
before treatment.
- The variation of HDL-c, LDL-c before and after treatment
was not statistically significant.
13
3.3.2. Variation of insulin resistance indices 6 months after start
treatment
Table 3.35: Comparing mean values of aome insulin resistance
indices, beta cell function, insulin sensitivity before and after
treatment (n=124)
Index
Before
treatment
After
treatment
Percent of
variation
(%)
p
C-peptide
(nmol/mL)
1.44 ± 0.77 1.17 ± 0.94 0.18 < 0.05
HOMA2-IR 3.76 ± 2.08 2.86 ± 0.83 -23.9 < 0.05
HOMA2-%S 49.3 ± 38.03 64.68 ± 18.76 31.2 < 0.01
HOMA2-%B 80.3 ± 48.69 113.13 ±
56.63
41.3 < 0.05
- Mean values of C-peptide, insulin resistance indices decreased,
insulin sensitivity, beta cell function increased significantly 6
months after start treatment (p < 0.05 and p < 0.01,
respectively).
- The increasing degree of beta cell function after treatment was
highest.
- The decreasing degree of insulin resistance after treatment was
smallest.
Table 3.36: Percent of patients with abnormal insulin resistance
indices before and after treatment (n=124)
Index
Before treatment
n (%)
After treatment
n (%)
C-peptide > 1.18 nmol/L 59 (47.6) 30 (24.2)
HOMA2-IR > 1.92 99 (79.8) 47 (37.9)
HOMA2-%S < 45.5 97 (78.2) 33 (26.6)
HOMA2-%B < 89.1 100 (80.6%) 34 (27.4%)
- 6 months after start treatment, the percent of increased
insulin resistance indices decreased.
- Percent of patients with decreased insulin sensitivity or
decreased beta cell function also decreased.
3.3.3. Variation of nephropathy degree 6 months after start
treatment
14
Table 3.37: Comparing mean value of glomerular filtration
rate before and after treatment (n=124)
Glomerular
filtration rate
(ml/min/173m
2
)
Before
treatment
After
treatment
P
Highest 104.8 106.4
Smallest 12.4 11.8
61.2 ± 23.16 74.3 ± 24.48 < 0.01
After treatment, the mean value of glomerular filtration rate
increased significantly.
15
Table 3.38: Distribution of patients according to stages of
chronic renal disease before and after treatment (n=124).
Stage
Before
treatment
After treatment
Variation
in pairs %
n % n %
1 12 9.6 19 15.3 59.4
2 49 39.5 35 28.3 -28.4
3 34 27.4 41 33.1 20.8
4 17 13.7 16 12.9 -5.8
5 12 9.7 13 10.4 7.2
- The percents of patients before and after treatment
according to stages of chronic renal disease changed differently and
unevenly.
Table 3.39: Distribution of patients according to clinical states of
chronic renal disease before and after treatment (n=124)
Clinical state
Before
treatment
After
treatment
Variation
in pairs
(%)
Number (n) Number(n)
MAU (-) 0 7 5.8
MAU (+) 22 29 63.8
MAC (+) 39 24 -38.4
CRF 63 64 1.6
- After treatment, the percent of patients with MAC (+) decreased
but the percent of patients with MAU increased, in particularly, there
were 5.8% cases of MAU(-) disappeared nephropathy when tested.
- Percent of patients with chronic renal failure slightly
increased.
CHAPTER 4- DISCUSSION
4.1. General characteristics of the subjects of investigation.
4.1.1. Age, sex, detection time of diabetes.
Advanced age is not a disease but it facilitates the occurence and
development of diseases. With type 2 diabetes, age is always
considered as an unchangeable risk factor. The percents of female
16
patients in both groups were higher than the percents of male patients
(73.4% - 73.5%). Because the percents of patients in sex were as
stated then we had to select equivalent ratio of male/female in healthy
control group to prevent the significant difference in sex with others
groups and to eliminate the factors affecting investigation indices
from sex aspect. The detection time of type 2 diabetes is an
impacting and influencing factor. The detection time relates to target
organ complications. Diabetic patients with nephropathy had longer
detection time, so, with prolonged detection time, the risk of
nephropathy complications also increased.
4.1.2. Some clinical, sub-clinical characteristics of patients
Type 2 diabetes is a disease that appears and progresses silently.
About 50% of cases are not diagnosed in time, in many cases the
disease is detected based on complications occurring before the
patients know that they have diabetes. Diabetic patients with
complications had all rick factors such as high BMI, dyslipidemia,
heart, eye and kidney complications higher than patients without
complications. Especially patients with complications had less ability
to control factors than patients without complications.
4.1.3. Ratio, characteristics of nephropathy in investigation patients
Nephropathy in diabetic patients is classified as small
vascular complication. If classify nephropathy according to BTM
stage or based on glomerular filtration rate we obtained results with
different percents, in which 2nd and 3rd stages nephropathy
accounted higher percents, 37.9% and 31.4%, respectively. If match
with glomerular filtration rate then the 3 first stages of BTM are
counted as mild conditions in which the 1st and 2nd stages haven’t
had renal failure, and the 3rd stage has had reduced glomerular
filtration rate. The 4th and 5th stages of BTM are accounted as
serious renal failure stages, among these subjects, there are 23.4% of
cases belong to the 3rd and 4th stages. If analyse according to clinical
17
states of nephropathy then we will see the difference in patient
percent, wherein the highest percent is CRF patients with 50.8% of
cases - a haft of patients have nephropathy. Two other clinical states
also have different percents, where percent of MAC(+) patients
without CRF counted 31.5%, higher than percent of MAC(+)
patients with normal glomerular filtration rate. The investigation on
complications and nephropathy characteristics of type 2 diabetic
patients with nephropathy of Nguyen Van Quynh showed that in the
first year of type 2 diabetes there are only 18.3% of cases can be
diagnosed.
4.2. Variation of insulin resistance and the relation between
insulin resistance and nephropathy degree in type 2 diabetic
patients with nephropathy.
4.2.1. Variation of insulin resistance indices.
Results from comparison of mean values of insulin resistance
indices from 3 groups showed that insulin and C-petide levels of type
2 diabetic patients with nephropathy were higher than such indices of
healthy controls and type 2 diabetic patients without nephropathy
with p<0.01. Thus, both insulin and C-peptide levels of investigation
patients were higher than healthy controls and patient controls.
Increasing blood insulin level is considered as a compensatory
response of the body to adapt to insulin resistance or reduced insulin
sensitivity condition.
Analytical results of the insulin resistance index – HOMA-IR of
type 2 diabetic patients with nephropathy were higher than such
index of both healthy controls type 2 diabetic patients without
nephropathy. So, it is clear that in among patients with nephropathy
due to diabetes leading to increased insulin resistance degree, there
always include type 2 diabetic patients.
While the insulin, C-peptide levels and insulin resistance index
-HOMA2-IR increased in type 2 diabetic patients with nephropathy,
18
the insulin sensitivity index and beta cell function changed in other
way. Accordingly, both insulin sensitivity index and beta cell
function reduced as compared to corresponding indices of healthy
controls. However, when comparing mean values of 2 said indices
between 2 patient groups, we found that the difference was not
statistically significant. Thus, both insulin sensitivity and beta cell
function reduced. The variation of 2 said indices supported and
proved the “insulin resistance” in type 2 diabetic patients with
nephropathy. But the difference of insulin sensitivity and beta cell
function between type 2 diabetic patients with nephropathy and
petients without nephropathy was not statistically significant, this
difference demonstrated that: nephropathy has not leaded to
statitically significant variation of insulin sensitivity and beta call
function.
4.2.2. Relation between insulin resistance and nephropathy
degeree.
Some authors investigated the relation between some insulin
resistance indices and nephropathy degree commented: insulin
resistance, hyperinsulinemia are independent risk factors causing
increased nephropathy in type 2 diabetic patients. Insulin resistance
and hyperinsulinemia leading to reduced nitric oxide level secrected
by endothelium and increased oxidative stress are important
mechanisms in the progression of chronic renal disease due to type 2
diabetes.
The variation of patient percents based on increased HOMA2-IR
index, or reduced insulin sensitivity and beta cell function indices
were equivalent. The percent of CRF patients with increased HOMA-
IR, reduced insulin sensitivity and beta cell function was higher than
the percents of patients with MAU (+) and MAC (+), wherein both
groups had equally percents of subjects with varied indices. Thus,
among patients with nephropathy, CRF patients with increased
19
insulin resistance indices and reduced beta cell function and insulin
sensitivity were significantly high. Insulin resistance level increased
corresponding to the nephropathy degree and became highest in
patients with chronic renal failure, it also increased corresponding to
decreasing degree of glomerular filtration rate.
When comparing mean values of insulin, C-peptide levels, insulin
resistance index, insulin sensitivity and insulin secretion function of
beta cells following BTM stages, we obtained positive results. Both
insulin and C-peptide levels gradually increased following BTM
stages in a statistically significant way. That is, when glomerular
filtration rate reduced, the insulin and C-peptide levels increased to
compensate the variation of insulin resistance and insulin sensitivity
and insulin secretion function of beta cells. If mean values of insulin
resistance indices gradually increased then insulin sensitivity and
beta cell function indices statistically significantly decreased.
As analyzed above, the relation between insulin resistance indices,
insulin level, C-peptide level, HOMA2-IR gradually increased,
insulin sensitivity and beta cell function gradully decreased when the
chronic nephropathy stages increased. The results showed that: the
insulin resistance index HOMA2-IR statistically significantly
positively correlated in a moderate degree with glomerular filtration
rate with r = -0.39; p < 0.05. Therefore, if the glomerular filtration
rate decreased then the insulin resistance index increased. Based on
the glomerular filtration rate we can estimate the respective insulin
resistance index. In 2008, Ahmed S found the correlation between
microalbuminuria and glomerular filtration rate in type 2 diabetic
patients with insulin resistance index. Accordingly, the insulin
resistance index HOMA2-IR significantly positively correlated in a
moderate degree with the AMU level and inversely correlated in a
thick degree with the glomerular filtration rate with r = -0.54; p <
0.01.
20
4.3. Effect in controlling some indices, variation of insulin
resistance, nephropathy degree before and after treatment.
4.3.1. Effect in controlling some indices of type 2 diabetic patients.
When comparing main biochemical indices of patients we found
that: the mean values of fasting glucose, HbA1c, HATT, HATTr,
cholesterol and TG levels after treatment significantly decreased as
compared to before treatment. Although this is general mean result of
all patients but it indicated the effect of treatment. When comparing
the percent of patients 6 months after start treatment based on the
variation degree of indices such as blood pressure, HbA1c and
RLLM we also recognized a significant reduce. Although all indices
had not reached normal levels but the percent of patients with
hypertension, RLLM and HbAc1 significantly reduced ≥ 7.0%. The
investigation of Pham Thi Hong Hoa found that at baseline the
percent of patients with less controlled HbA1c index made up 48.2%,
percent of patients with good controlled HbA1c index made up
23.3%. Nguyen Thanh Thuan, Nguyen Thy Khue also found a
relatively high percent of patients with less controlled HbA1c index
(52%- 91%).
Other indices such as blood pressure, blood lipids also reached
controlling object. Accordingly, all above-stated indices reached
good and acceptable levels after treatment.
4.3.2. Variation of insulin resistance indices before and after
treatment.
As analyzed above, under effect of treatment method, many main
indices had gained good and acceptable levels. Such effect is a
premise of an improvement in insulin resistance indices, insulin
sensitivity, insulin secretion function as well as C-peptide level of
patients after 6 months. Although we did not quantify insulin level
after treatment because of concerns about intervention of exogenous
insulin used in treatment but based on the variation of C-peptide
21
levels we found that: the mean C-peptide level significantly reduced
after treatment and thus we could deduce that the insulin level also
reduced. Similarly, when comparing the mean values of insulin
resistance indices, insulin sensitivity and insulin secretion function of
beta cells in patients after treatment, we found an obvious variation.
Accordingly, the insulin resistance indices reduced, insulin
sensitivity and beta cell function increased. If counting the variation
percent of each index, we received high results, in which the beta cell
function index increased with highest value (41.3% as compared to
baseline), next to insulin sensitivity index increased 31.2%, insulin
resistance index reduced 23.9%. This is the effect of treatment after 6
months of intervention, if the duration of treatment, tracking and
evaluation is prolonged, we may get better results, because beside the
need to improve indices, the stability of treatment effect is a concern
because the disease still continuing progresses.
4.3.3. Variation in characteristics of nephropathy after treatment.
Although nephropathy is a chronic complication in diabetic
patients but nephropathy is exhibited by different severities. MAU,
MAC states in nephropathy are considered as mild states while CRF
has not occurred, hence under the effect of treatment, mild damage
states can releaf. The number of patients with MAU before treatment
may return to normal state under the effect of treatment. But they
may also change to more serious state which is MAC. If we track
these patients in a short time, the probability of variation from MAU
to MAC is very small. MAC after treatment may change back to
MAU or to mild chronic renal failure. Although quitely rare, but
some cases change from MAC to normal state without nephropathy
and this phenomenon exits in a short time. While CRF state generally
progresses to more serious condition and finally reaches end-stage CRF,
but if before treatment the patients only meet mild CRF then after
22
treatment this state may revert to its previous state that is
macroalbuminuria.
The analysis results showed that: the mean glomerular
filtration rate after treatment significantly increased. this proved that
under the effect of treatment, the glomerular filtration rate - a
important index for evaluation of nephropathy had been improved.
When comparing the percents of patients before and after treatment
acoording to the stages of chronic nephropathy, we also abtained
some positive results. The percent of 1
st
stage chronic renal failure
patients after treatment increased significantly with 59.4%, this
proved that there were 7 patients reverted back to have glomerular
filtration rate > 90 ml/min/1.73 m
2
. The variations of patient percents
in next stages were different, wherein, the percents of 2
nd
and 4
th
patients after treatment decreased 28.4% and 5.8%, respectively;
while the percents of 3
rd
and 5
th
patients increased 20.8% and 7.2%,
respectively. The transfer of subjects between stages leaded to the
variation of patient percents in each stage before and after treatment.
CONCLUSION
Our investigation on insulin resistance and controlling degree of
some indices in 124 type 2 diabetic patients with nephropathy as
compared to healthy controls and patient controls obtained the
following conclusions:
1. Variation of insulin resistance and relation between insulin
resistance and nephropathy degree in type 2 diabetic patients.
+ Increase in mean values of insulin, C-peptide, HOMA2-IR
indices, decrease in mean values of HOMA2-%S, HOMA2-%B as
compared to corresponding indices in healthy controls and patient
controls.
23
+ Percent of CRF patients with increased insulin, C-peptide,
HOMA2-IR indices, reduced HOMA2-%S, HOMA2-%B as
compared to patients with MAU or MAC. Percent of patients had the
variation of such indices when they got microalbuminuria and
macroalbuminuria were equal.
+ Mean values of insulin, C-peptide, HOMA2-IR indices
increased, mean values of HOMA2-%S, HOMA2-%B reduced
following BMT stages.
+ HOMA2-IR index inversely correlated in a moderate degree
and HOMA2-%S, HOMA2-%B indices positively correlated in a
thick degree with glomerular filtration rate.
2. Effect in controlling some indices, variation of insulin
resistance, nephropathy degree after 6 months of treatment.
+ Both indices of blood glucose, HbA1c, blood pressure, blood
lipids reduced when counted in mean values and patient percents.
Percent of patients with good and acceptable ability to control blood
glucose, HbA1c, blood pressure, blood lipids indices increased while
percent of patient wit less ability to control such indices reduced.
+ Variation of indices after treatment: HOMA2-IR reduced
23.9%, HOMA2-%S, HOMA2-%B increased 31.2% and 41.3%,
respectively. Percent of patients with increased HOMA2-IR,
decreased HOMA2-%S, HOMA2-%B reduced after treatment.
+ Mean value of glomerular filtration rate increased. Percent of
patients following nephropathy degrees improved significantly.
24
RECOMMENDATIONS
Through these investigation results, we have the following
recommendations:
+ There is a need to better control risk factors promoting
nephropathy according to the recommended targets to eliminate the
rate and severity of nephropathy in type 2 diabetic patients.
+ There is a need for other investigations on the relation
between insulin resistance and the degree and stages of chronic
nephropathy in type 2 diabetic patients using a large number of
patients and a prolonged duration for avaluation after treatment to be
able to understant the progression of nephropathy under the effect of
treatment methods.
25