Plasmon exciton interaction in gold nanostructure and quantum dot conjugate and its applications in biosensing
Bạn đang xem bản rút gọn của tài liệu. Xem và tải ngay bản đầy đủ của tài liệu tại đây (4.24 MB, 137 trang )
PLASMON EXCITON INTERACTION IN GOLD
NANOSTRUCTURES AND QUANTUM DOT
CONJUGATE AND ITS APPLICATION IN
BIOSENSOR
ZHANG TAO
(B. Eng.)
A THESIS SUBMITTED FOR THE DEGREE OF
DOCTOR OF PHILOSOPHY
DEPARTMENT OF CHEMICAL AND
BIOMOLECULAR ENGINEERING
NATIONAL UNIVERSITY OF SINGAPORE
2013
I
Declaration
II
Acknowledgements
I would like to express my gratitude to all of those who have helped and
inspired me during my four year doctoral study. My utmost thankfulness goes
to my advisor, Prof. Chen Shing Bor for his patient guidance and selfless
encouragement in my research and study at National University of Singapore.
His exceptional intuition in physics and persistent desire for high quality
research has motivated all his advisees, including me. I would like to thank my
co-supervisor Prof. Lanry Yung Lin Yue for his guidance. I would like to
thank my thesis committee, Prof. Zeng Huachun and Prof. Lu Xianmao for
taking their precious time attending my thesis defense. My thanks also go to
my previous and current labmates, Dr. Chieng Yuyuan, Dr. Ma Ying, MS Ang
Yan Shan for their help during my study. My deepest gratitude goes to my
family for their unflagging love and support throughout my life, especially my
wife Wei Xiaowei whose fully support enables me to complete the work. In
the last, I would like to thank all the funding agencies. This work is supported
Ministry of Education, Singapore.
III
Table of Contents
Declaration I
Acknowledgements II
Table of Contents III
Summary VI
List of Tables IX
List of Figures X
List of Symbols XVII
Chapter 1 Introduction 1
Chapter 2 Literature Review 9
2.1 Plasmon-enhanced luminescence near noble metal nanostructures 9
2.2 Biosensing with plasmonic nanosensors. 12
2.3 Surface-enhanced Raman Scattering (SERS) based on plasmonic materials 15
Chapter 3 Material Synthesis and Characterization 20
3.1. Introduction 20
3.2. Experimental Section 23
3.2.1 Synthesis of SAuNP with diameter of 11 nm, 25 nm, and 45 nm 23
3.2.2 Preparation of gold nanorod (AuNR) with aspect ratio of 3.5 24
3.2.3 Synthesis of popcorn-shaped gold nanoparticles (PS-AuNP) 26
3.2.4 Functionalizing SAuNP with thiol and carboxyl-modified polyethelyene glycol
(SH-PEG-COOH) via ligand exchange 27
3.2.5 Two phase ligand exchange for AuNR and PS-AuNP 27
3.2.6 Conjugation of AuNP with QD to form AuNP-QD Nanoconjugates 29
3.2.7 Characterization methods 29
IV
3.3 Results and Discussion 30
3.3.1. Spherical Gold nanoparticle and quantum dots conjugate (SAuNP-QD) 30
3.3.2. Gold nanorod (AuNR) and quantum dot (QD) conjugate (AuNR-QD) 35
3.3.3. Popcorn-shaped Gold Nanoparticles (PS-AuNP) and quantum dots (QDs)
conjugate. 40
3.4. Conclusion 44
Chapter 4 Plasmon-Exciton Interactions in Single AuNP-QD conjugate:
Correlating Modeling with Experiments 46
4.1. Introduction 46
4.2 Experiment section 49
4.2.1 Characterization methods 49
4.2.2. Finite-Difference Time-Domain (FDTD) modeling 50
4.3 Results and Discussion 51
4.3.1 Steady-state photoluminescence properties of AuNP-QDs 51
4.3.2 FDTD simulation and electrodynamics calculation of PS-AuNP-QD system 57
4.3.3 Scattering properties of single SAuNP-QDs, AuNR-QDs and PS-AuNP-QD
system 62
4.4 Conclusion 81
Chapter 5 Protein Detection Based on PS-AuNP-QD Conjugate 85
5.1 Introduction 85
5.2 Experiment Section 88
5.2.1 Synthesis of Biotinylated PS-AuNP-QD 88
5.2.2 Avidin Detection Based on Biotinylated PS-AuNP-QD 89
5.2.3 Attachment of Immunoglobulin G (IgG) onto the Surface of PS-AuNP-QD 89
5.2.4 E. Coli Bacteria Detection Based on PS-AuNP-QD-IgG 90
V
5.3 Results and Discussions 90
5.3.1 Avidin Detection Based on Biotinylated PS-AuNP-QD 90
5.3.2 E. Coli Bacteria Detection Based on PS-AuNP-QD-IgG 95
5.4 Conclusion 99
Chapter 6 Strong Surface-Enhanced Raman Scattering Signals of Analytes
Attached on PS-AuNP-QD and the Application in Protein Structure Studies 101
6.1 Introduction 101
6.2 Experiment Section 104
6.2.1 Functionalizing PS-AuNPs with Thiotic Acid (TA) and 4-Mercaptobenzonic
Acid (4-MBA) via Ligand Exchange 104
6.2.2 Surface-enhanced Raman spectroscopy for 4-MBA attached on PS-AuNP-QD
104
6.2.3 Characterization Methods 105
6.3 Results and Discussions 106
6.3.1 SERS spectrum of 4-MBA attached on PS-AuNP-QD 106
6.3.2 The application of PS-AuNP-QD in avidin structure study 109
6.4 Conclusion 112
Chapter 7 Conclusion and Future Work 115
VI
Summary
Plasmon Exciton Interaction in Gold Nanostructure and Quantum Dot
Conjugate and its Applications in Biosensor
By
Zhang Tao
By synthesizing gold nanostructure (AuNP) and quantum dot (QD) conjugates, we
investigated the optical properties of this type of conjugates both experimentally and
theoretically. Also, the potential applications of the conjugates in protein detection
and surface-enhanced Raman scattering (SERS) were also explored.
We synthesized three different sizes of spherical AuNPs (SAuNPs) (11 nm, 25 nm
and 45 nm), and then functionalized them with carboxyl groups via ligand exchange.
The amine-functionalized QDs can be reacted with SAuNPs and form amide bond
between them. Dark field microscopy was employed to examine the single particle
optical properties of this SAuNP-QD conjugate. The scattering spectra of
SAuNP-QDs shows coupled modes between exciton and plasmon. According to our
numerical simulation using finite-difference time-domain (FDTD) method, we also
found that the interaction between SAuNP and QD depends on the polarization of the
excitation light. Besides, the interaction between exciton and plasmon also affects the
emission of QD in the conjugate, which has potential application in nonlinear optics.
Gold nanorods (AuNRs) with aspect radio around 2.5-3 was also synthesized. A
two-phase ligand exchange method was carried out in order to functionalize the
surface of AuNR with carboxyl groups. Then AuNRs were linked with QD using the
VII
same procedures mentioned above. The single particle scattering spectra of
AuNR-QD conjugates shows fascinating coupling modes depends on the position of
QD with respect to AuNR. The exciton mode can interact with the transverse mode or
longitudinal mode of the AuNR depending on its location at the middle or at the tip of
the rod, respectively. When there is more than one QD attached onto one AuNR, the
coupling modes became more complicated and interesting. Our FDTD simulation
results show that the interaction is also highly dependent on the polarization of the
incident light. The interaction affected the emission property of the AuNR-QD
conjugate comparing with pure QD solutions. We believe that the plasmon induced
electric field enhancement plays an important role in the nonlinear optical behavior of
QDs.
We also synthesized popcorn-shaped gold nanoparticles (PS-AuNPs) in order to
get higher electric field enhancement. PS-AuNPs were also functionalized with
carboxyl group after ligand exchange. Then QDs were attached onto PS-AuNPs using
the same chemistry mentioned above. This PS-AuNP-QD conjugate solution shows
high fluorescence enhancement (around 190 times) compared with pure QD solution
at the same experimental conditions. FDTD simulation shows that the fluorescence
enhancement factors are proportional to the electric field enhancement factors when
different excitation wavelengths are used, which is consistent with classical
electrodynamics’ calculation results. Also, the emission wavelength of the
PS-AuNP-QD solution shifts from pure QD solution centered at 530 nm to 625 nm.
This big red shift can be explained the decay of exciton into plasmon modes when the
electric field in vicinity is high enough.
The strong interaction between PS-AuNP and QD is very sensitive to the local
dielectric environment. Based on this, PS-AuNP-QD conjugate is an ideal material
for molecular detection and sensing. We further attached polyethylene glycol
(PEG)-modified biotin on to PS-AuNP in the conjugate, which makes it a sensor for
VIII
avidin. During the addition of avidin, the fluorescence enhancement becomes lower,
and the emission peak shifts back to 530 nm at certain concentration of avidin.
Also, the high electric field enhancement due to the strong interaction between
PS-AuNP and QD makes the conjugate a good candidate for SERS. Using 514 nm
Argon laser as excitation, we found that the SERS enhancement factor for certain
Raman dye can be as high as 10
8
. We also observed the binding site molecular
vibration information of biotin and avidin using the same technique, which suggests
that PS-AuNP-QD can be applied as a platform for protein confirmation dynamics
detection.
IX
List of Tables
Table 3.2. Zeta potentials of SAuNP before and after ligand exchange. (Page 31)
Table 3.4. Dynamic light scattering (DLS) results of the SAuNP and SAuNP-QD
solutions. (Page 33)
X
List of Figures
Figure 3.1. UV-Vis absorption spectra of 11 nm SAuNP (a and A), 25 nm SAuNP (b
and B), and 45 nm SAuNP (c and C). The black and red lines represent the
suspensions before and after ligand exchange, respectively. (Page 31)
Figure 3.3. SAuNP size and size distributions measured by dynamic light scattering
(DLS): a, 11 nm; b, 25 nm; c, 45 nm. The inlet pictures show the morphology of the
corresponding SAuNP characterized by TEM. (Page 32)
Figure 3.5. FE-TEM images of SAuNP(11 nm)-QD (a and b, scale bars are 20 nm
and 10 nm, respectively), SAuNP(25 nm)-QD (c and d, scale bars are 20 nm and 10
nm, respectively), and SAuNP(45 nm)-QD (e and f, scale bars are both 20 nm). (Page
34)
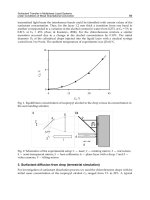
Figure 3.6. Experimental protocols of phase transfer ligand exchange for AuNR.
(Page 37)
Figure 3.7. FETEM pictures of gold nanorod after ligand exchange (a and b) and the
corresponding UV-Vis absorption spectrum. The scale bar in a and b are 50 nm and
10 nm, respectively.
Figure 3.8. Zeta potential change of AuNR before (a, +47.3 mV) and after (b, -17.6
mV) ligand exchange. (Page 38)
Figure 3.9. FETEM pictures of AuNR-QD conjugates. a: two AuNR-QD conjugates.
scale bar: 20 nm; b: QD attached on the AuNR tip; c: QD attached on the AuNR side;
d: two QDs linked on one AuNR; e: three QDs linked on one AuNR; f: four QDs
linked on one AuNR. (Page 39)
XI
Figure 3.10 (A and B) FETEM images and (C) UV-Visible absorption spectrum of
popcorn-shaped gold nanoparticles (PS-AuNP). The magnifications of (A) and (B)
are 50,000x and 600,000x respectively (scale bar: (A) 100nm and (B) 10 nm). The
UV-Visible absorption spectra of spherical AuNPs (dash line) and PS-AuNPs (solid
line) were collected at the same particle concentration in aqueous solution. (Page 42)
Figure 3.11 Zeta potential change of PS-AuNP before (a, +57.1 mV) and after (b,
-21.1 mV) ligand exchange. (Page 43)
Figure 3.12. (a and b) FETEM images of PS-AuNP-QDs and (c) EDX spectrum of
selected particles. Scale bar: (a) 100 nm and (b) 20 nm. (Page 44)
Figure 4.1 Steady-state Photoluminescence spectra of QD solution (a), 11 nm
SAuNP-QD (b), 25 nm SAuNP-QD (c) and 45 nm SAuNP-QD. All particles are
dispersed in ultrapure water at 0.08 nM (particle concentration). (Page 52)
Figure 4.2 Steady-state photoluminescence spectra of AuNR-QDs solution. All
particles are dispersed in ultrapure water at 0.08 nM (particle concentration). (Page
54)
Figure 4.3 PL spectrum of (a) QD alone and (b-e) PS-AuNP-QD solutions. The
emission spectra from (b) to (e) are for different excitation wavelengths (390 nm, 420
nm, 450 nm, 500 nm, respectively). The QD alone sample (a) was also excited at
these four excitation wavelengths, but did not show any significant difference in the
emission spectrum. The upper inset contains the enlarged scale of the QD emission
spectrum in (a). The lower inset shows the fluorescent emission of the PS-AuNP-QD
(red) and the original QD (green) at the same particle concentration. All samples have
the same particle concentration (0.08 nM). (Page 55)
Figure 4.4 The UV-visible absorption spectrum of PS-AuNP-QD solution (0.08 nM,
particle concentration). (Page 56)
Scheme 4.5 Schematic of the simulated system showing a periodical array of
PS-AuNPs each in a box of 200×200×100 nm. They are situated on a plane with a
XII
distance of d above the plane where CdSe QDs are located. The arrow marked as P in
the scheme is the polarization of the pulse incident light, which is in the z direction
and modeled using Gaussian modulated continuous wave. (Page 58)
Figure 4.6 The distribution of calculated electric field magnitude (relative to the value
of the incident light) at the plane where the QDs are located at different excitation
wavelengths: (A) 390, (B) 420, (C) 450 and (D) 500 nm. The white circles indicate
the location of QD. (Page 58)
Figure 4.7 Correlation between the experimental PL enhancement and the calculated
square of electric field intensity enhancement. Black line is the linear fitting. (Page
59)
Scheme 4.8 Radiative coupling of QDs to PS-AuNPs. A coupled QD can emit a
photon either into the free space or into the guided surface plasmons of the nearby
gold nanostructures with respective rates Γ
rad
and Γ
pl
. (Page 60)
Figure 4.9 Single particle scattering spectra of 11nm SAuNP (a), 25 nm SAuNP (b),
45 nm SAuNP (c). The inset image shows the corresponding ensemble solutions’
UV-Vis absorption spectra. (Page 63)
Figure 4.10 Experimental scattering spectrum and TEM image (inset) of an 11 nm
SAuNP-QD complex. (Page 65)
Figure 4.11 FDTD calculated scattering spectrum of 11 nm SAuNP-QD complex
under TM (a) and TE (b) mode and the corresponding electric field distributions
under each resonance peak: 605 nm (d), 510 nm (e), and 540 nm(f). (c) shows the
electric field distributions of 11 nm SAuNP at its resonance wavelength (510 nm).
(Page 67)
Figure 4.12 Experimental scattering spectrum and TEM image (inset) of an 25 nm
SAuNP-QD complex. (Page 68)
XIII
Figure 4.13 FDTD calculated scattering spectrum of 25 nm SAuNP-QD complex
under TM (a) and TE (b) mode and the corresponding electric field distributions
under each resonance peak: 610 nm (d), 510 nm (e), and 540 nm(f). (c) shows the
electric field distributions of 25 nm SAuNP at its resonance wavelength (525 nm).
(Page 69)
Figure 4.14 Experimental scattering spectrum and TEM image (inset) of an 45 nm
SAuNP-QD complex. (Page 70)
Figure 4.15 FDTD calculated scattering spectrum of 45 nm SAuNP-QD complex
under TM (a) and TE (b) mode and the corresponding electric field distributions
under each resonance peak: 610 nm (d) and 500 nm (e). (c) shows the electric field
distributions of 45 nm SAuNP at its resonance wavelength (540 nm). (Page 72)
Figure 4.16 Single particle dark field scattering spectrum and corresponding TEM
images (inset) of one AuNR (a) and one AUNR-QD (b). The scale bar in the TEM
images is 10 nm. (Page 74)
Figure 4.17 Calculated scattering spectrum of AuNR-QD complex using FDTD
method. (a): the complex is excited by TM mode source. (b) the complex is excited
by TE mode source. (Page 76)
Figure 4.18 Single particle dark field scattering spectrum and corresponding TEM
images (inset) of one AUNR-QD. The scale bar in the TEM images is 20 nm. (Page
77)
Figure 4.19 Calculated scattering spectrum of AuNR-QD complex using FDTD
method. (a): the complex is excited by TE mode source. (b) the complex is excited by
TM mode source. (Page 78)
Figure 4.20 The comparison between AuNR-QD with different relative locations of
QD on the AuNR side (a and b). The electric field distributions of the complex at 520
nm under TE mode are calculated using FDTD method (c and d). The scale bar in a
and b is 20 nm. (Page 79)
XIV
Figure 4.21 The comparison between AuNR-QDs with two QDs at different relative
locations on the AuNR (a and b) and the corresponding TEM images. The scale bar in
a and b is 20 nm. (Page 80)
Figure 4.22. Single particle scattering spectra and TEM pictures (insets) of a
PS-AuNP (a) and PS-AuNP-QD (b). The scale bars in (a) and (b) are both 20 nm.
(Page 81)
Figure 5.1. Schematic illustration of QD-FRET nanosensor for analysis of enzyme
activity. a) QD-FRET sensor for the study of protease. b) QD-FRET sensor for the
study of protein kinase. c) QD-FRET sensor for the study of DNA polymerase. (Page
88)
Figure 5.2. Experimental procedures for avidin sensor based on PS-AuNP-QD. (Page
89)
Figure 5.3. Fluorescence intensity change of biotinylated PS-AuNP-QD at 0.08 nM
during the addition of avidin. The avidin concentration is (a) 0 ng/mL, (b) 2.5 ng/mL,
(c) 6.5 ng/mL and (d) 10 ng/mL. (Page 92)
Figure 5.4. Fluorescence intensity change of biotinylated PS-AuNP-QD at 0.24 nM
during the addition of avidin. The avidin concentrations are (a) 0 ng/mL, (b) 0.1
ng/mL, (c) 0.5 ng/mL, (d) 0.9 ng/mL, (e) 1.3 ng/mL, (f) 1.7 ng/mL, (g) 2.1 ng/mL, (h)
2.5 ng/mL, and (i) 2.9 ng/mL. (Page 93)
Figure 5.5. FETEM images of aggregated PS-AuNP-QD. Scale bar of: 200 nm. (Page
94)
Figure 5.6. Fluorescence intensity change of biotinlated PS-AuNP-QD at 0.24 nM
during the addition of avidin in 0.1 nM human blood serum solution (A and B). The
avidin concentration is (a)-(g) are the PL spectrum of biotinylated PS-AuNP-QD in
human blood serum solution (0.1 nM) when the added avidin concentrations are (a) 0,
XV
(b) 0.1 ng/mL, (c) 0.21 ng/mL, (d) 0.33 ng/mL, (e) 0.46 ng/mL, (f) 0.58 ng/mL, and
(g) 0.70 ng/mL. (C): Plot of PL intensity changes at various avidin concentration in
0.1 nM human blood serum solution. The PL intensity of each sample was collected
in 10-15 minutes after the addition of avidin. Every sample was tested for 5 times and
the average value is used. Red line shows the linear fit of the data. (Page 96)
Figure 5.7 The zeta potential change of IgG and PS-AuNP-QD-IgG in different buffer
solutions (pH values are 5.5, 6.7, 7.8, and 8.3, respectively). (Page 97)
Figure 5.8 The PL profiles of PS-AuNP-QD (a) and PS-AuNP-QD-IgG (b). The
measurements are carried out at the particle concentration of 0.08 nM in water. (Page
98)
Figure 5.9 TEM images of PS-AuNP-QD/E. Coli (a) and PS-AuNP-QD-IgG/E. Coli.
The scale bars in the picture a and b are 500 nm and 200 nm, respectively. (Page 98)
Figure 5.10 PL profiles of PS-AuNP-QD-IgG/E. Coli solutions. The particle
concentration is fixed at 0.08 nM. The E. Coli concentrations in the solutions are a: 0,
b: 100 per mL, c: 10
3
per mL, d: 10
4
per mL, e: 10
5
per mL, f: 10
6
per mL, g: 10
7
per
mL and h: 10
8
per mL. (Page 99)
Figure 6.1. Surface enhanced Raman Scattering. Molecules (blue) are absorbed onto
metal nanoparticles (orange) either in suspension or on surfaces. As in ordinary
Raman scattering, the SERS spectrum reveals molecular vibration energies based on
frequencies shift between incident (green) and scattered (red) laser light. (Page 103)
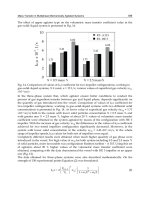
Figure 6.2. Raman spectra of 4-MBA attached on PS-AuNP-QD (a); on PS-AuNP (b),
and in methanol solution at 1mM (c). The particle concentration for PS-AuNP-QD
and PS-AuNP are both 0.08 nM. The concentration of 4-MBA was estimated using
the added amount of it during the ligand exchange. (Page 108)
Figure 6.3. The distribution of calculated electric field magnitude (relative to the
value of the incident light) near the surface of PS-AuNP in PS-AuNP-QD conjugate
(a) and in PS-AuNP (b). (Page 109)
XVI
Figure 6.4. Monomeric avidin (displayed as ribbon diagram) with bound biotin
(displayed as spheres). (Page 111)
Figure 6.5. SERS Spectra of biotin-avidin complex on the surface of PS-AuNP-QD in
aqueous solution. The particle concentration of PS-AuNP-QD was 0.24 nM. (Page
112)
XVII
List of Symbols
ω
B
: Metal’s bulk plasmon frequency
ω
S
: Metal’s surface plasmon
P
SERS
: Scattering power of surface-enhanced Raman scattering
I
L
: Intensity of the incident light
A(υ
l
)and A(υ
s
): The local enhancement factors for the laser and for the Raman
scattered field, respectively
σ
ads
R
: Raman cross-section of the molecules
: High-frequency dielectric constant of gold
: Plasma strength of gold
D
: Plasma frequency of gold
D
: Drude damping constant of gold
L
: Lorentz oscillator strength of gold
L
: Lorentz line width of gold
ε
QD,∞
: High frequency permittivity of CdSe
f: Lorentz permittivity of CdSe
ω
0
: Emission angular frequency of the QD
γ
QD
: Damping constant for CdSe
XVIII
Г
rad,0
(ω
PL
): Radiative decay rate of pristine QD without metal
Γ
rad,enh
: Enhanced radiative decay rate of QD
E
enh
and E
0
: Mean strengths of the enhanced electric field and the original electric
field of the incident pulse respectively
Γ
rad
: Radiative decay rate of QD’s emission into free space
Γ
non-rad
: Non-radiative decay rate of QD
Γ
pl
: Radiative decay rate of QD’s emission into plasmon
λ: Surface plasmon wavelength of gold
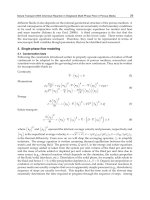
1
Chapter 1 Introduction
When a piece of metal is placed in electromagnetic field, the collective
oscillation of free electron density is called plasmons. According to electron
jellium model, the plasmon oscillating frequency is determined by the electron
density n
0
, which is the well-known bulk plasmon
frequency
eB
men
2
0
4
1
, where m
e
is the effective mass of the free
electron; n
0
is the number of electrons involved in oscillation; e is the charge
of one electron. On the other hand, when plasmon oscillations are confined at
interfaces between metal and dielectric, it is called surface plasmons (SPs)
which normally have lower frequency compared with bulk plasmon
frequency
1
. For example, for an infinite planar surface, the SP frequency
is
2
Bs
. The concept of SP is proposed by Ritchie, who theoretically
studied the energy loss of fast electron shooting through a thin metallic film in
1957
2
. The existence of SPs was later proven by Powell and Swan’s
experiments
3
.
In the past three decades, the development of nanotechnology makes it
possible to prepare different sizes and shapes of metallic particles. SPs can
also be excited by shedding light on metallic nanostructures. Normally,
electromagnetic waves can be strongly scattered and absorbed by the
nanostructure when its frequency matches with the resonance frequency of
SPs on the structure. By varying the size and shapes of the metallic
nanostructures, the SP resonance can be collected in a wide range all the way
from UV to middle infrared region. Numerous novel nanostructures and
devices have been created and characterized recently with either lithography
or chemical techniques. This growing interest on interactions between SPs and
electromagnetic fields breeds a fast expanding discipline in the past decades
2
named plasmonics
4
, attracting a wide spectrum of scientists including
physicists, chemists, and even biologists.
One important interest for plasmonics roots from its promising applications
covering a broad range of disciplines. For example, a lot of scientists and
engineers from electrical and computer science are interested in using metallic
nanowires as the next generation of interconnects in CPUs because
conventional copper electrical interconnects have been becoming the major
bottleneck for the IC industry
5
. Due to limitations in fabrication methods,
thermal effects during signal transportation, copper electrical interconnects
cannot satisfy the increasing demand for information transportation recently.
Optical fibers are good candidate because of their high transportation speed
and no thermal effect. However, its size is limited by diffraction; they cannot
be made smaller than half of the light wavelength, normally hundreds of
nanometers, which will make the devices quite bulky compared with
traditional ICs which is usually in tens of nanometer scale. Plasmonics solve
this problem because it can combine together high speed optics and the
miniaturization of electronics. The problem still blocking the way is that
nonradiative SPs are not able to couple with electromagnetic radiations
6
. So
there are both theoretical and practical importance to study the interaction
between SPs and electromagnetic radiations. In theoretical research, dipole
radiation has often been explored because it is easy to model and, most of
times, it is the basis for many complex situations
7
. In practice, organic dyes or
semiconductor quantum dots (QDs) are widely used material which can be
treated as dipole radiation during their emission.
QDs are small semiconductor nanocrystals which have been attracting more
and more attention since two or three decades ago. Optical excitations in QD
are defined by the electronic levels in the conduction and valence bands. As a
3
result of quantum confinement, the electronic levels are discrete in one or
more dimensions and can be tuned by size and shapes. The fundamental
optical excitations are transitions between these discrete levels in the
conduction and valence bands that lead to the formation of bound
electron-hole pairs or excitons. Interactions between excitons and SPs occur
when metal and QD are in close proximity. Usually this interaction can be
divided into two opposite cases: weak and strong coupling. In the weak
coupling regime, wave functions and electromagnetic modes of excitons and
plasmons are considered unperturbed and exciton-plasmon interactions are
often described by the coupling of the exciton dipole with the electromagnetic
field of the SP. In one of Drexhagen’s paper, this model was employed to
study the change of excitation decay rate of an emission dipole in the vicinity
of a plane metal surface
8
. In general, well-known phenomena including
enhanced absorption cross section, increased radiative rates, and the
exciton-plasmon energy transfer are described in the weak coupling regime. In
most published papers in this area, the calculation of electric field based on
finite-difference method or modelling the emitter as dipole source is still
widely used
9
. The change remains to properly calculate the electromagnetic
field in the proximity of metal nanoparticles of irregular shape and to take into
account exciton wave function beyond the point dipole approximation. The
strong coupling regime is considered when resonant exciton-plasmon
interactions modify exciton wave function and SP modes and lead to changes
of exciton and SP resonance energies that are larger than their natural line
widths. In this regime, the excitation energy is shared and oscillates between
the plasmonic and excitonic systems (Rabi oscillation)
10
, and a typical
anticrossing and splitting of energy levels at the resonance frequency is
observed. In Chapter 2 and 3, different shapes of AuNPs are used to study the
interaction between SP and excitons in this research. Also, one thing in strong
4
coupling regime deserving special attention is the decay of exciton into guided
SP modes. This coupling, also called Purcell effect, is normally caused by the
geometrical effect and the local electric field enhancement. This guided
transportation of photon has great potential application in next generation IC
devices. In Chapter 3, we presented the decay of exciton into the SP modes
supported by PS-AuNP.
In addition, chemists found plasmonics interesting because of its prosperous
application in sensing. As plasmons are resonating with the incoming
electromagnetic field, the localized charges on the metal surface will
dramatically enhance the electric field nearby. The electric field can be
amplified more than 100-1000 –fold in some cases, which renders them an
efficient platform for surface-enhanced spectroscopies, such as
surface-enhanced Raman scattering (SERS) and surface-enhanced
fluorescence
9a, 11
. Raman scattering occurs during inelastic collision of
photons with molecules. During this scattering process, photon can gain or
loss energy to the molecule they collide, which produce a change in the
frequency. The frequency shift of the incident photons is related to the
characteristic molecular vibrations. Therefore, several different Raman lines
are generated during the scattering, which provides a vibrational “fingerprints”
of a molecule. Using Raman scattering to detect molecules and molecular
interactions especially for biomolecule has two outstanding advantages: First,
there is no need to tag the target molecules like currently used fluorescence
method; second, the fingerprint spectrum obtained by Raman scattering can
give us rich molecular structure information. For some biomolecules like
proteins, the functions are highly dependent on their conformational changes.
Therefore, Raman scattering provides an ideal method for monitoring the
protein conformation dynamic in cellular systems. However, Raman scattering
is a very weak effect. In practice, typical Raman scattering cross-sections are
5
between 10
-31
and 10
-29
cm
2
per molecule. Even in resonance Raman scattering,
the cross-sections are typically between 10
-27
and 10
-25
cm
2
per molecule. For
comparison, fluorescence spectroscopy normally has effective cross-sections
between 10
-17
and 10
-16
cm
2
per molecule
12
. So, the intensity of Raman
scattering signals must be enhanced in order to have practical applications. In
1977, surface enhanced Raman scattering (SERS) was first discovered by Van
Duyne and Jeanmaire. In the past few decades, SERS has become a hot
research area. The sensitivity of SERS has been proven for research at single
molecule level. It has been widely accepted that the SERS phenomenon is
caused by two different effects. First of all, the electromagnetic field
enhancement caused by metallic structures plays the dominant role. According
to Kneipp’s work
9b
, the power of SERS can be expressed as follows:
R
ads
slLSERS
AAINP
22
(1)
where N is the number of the molecules involved in this process; I
L
is the
intensity of the incident light; A(υ
l
)and A(υ
s
) express the local enhancement
factors for the laser and for the Raman scattered field, respectively; σ
ads
R
is the
Raman cross-section of the molecules. In low frequency region, A(υ
l
) and
A(υ
s
) can be taken as the same. So, P
SERS
is proportional to the fourth power of
the field enhancement factor. The other effect is called chemical or electronic
enhancement that is associated with electronic coupling between molecules
and nearby metal. In this research, we found that the PS-AuNP-QD had
outstanding SERS properties, and the details will be presented in Chapter 5.
Besides, localized surface plasmon resonance (LSPR) is another way
utilizing plasmons for sensing purpose. The optical property of noble metals
nanoparticles is highly sensitive to its local dielectric environment. By
monitoring the LSPR shift of the optical spectrum, the presence of the targeted
molecules can be detected. However, this method has some serious drawbacks.
6
First of all, metallic nanoparticles tend to absorb small molecules, making
most LSPR sensor poor at selectivity. In order to solve this problem, the
surface of metallic nanoparticles must be well protected by some inert layers,
which at the same time reduces the sensitivity of the sensor. Secondly, the
shift in LSPR spectrum is usually small when something absorbed onto the
surface of metallic nanoparticles. As such, the detection limit of LSPR sensor
is not as good as other sensors. In this research, we modified LSPR sensor into
AuNP-QD conjugate based sensor. The interaction between plasmon and
exciton is sensitive to not only the local dielectric environment, but also the
gap size between AuNP and QDs. We will present this conjugate-based
protein sensor in Chapter 4.
The field of plasmonics received another boost from the theoretical
investigation. Rapid growth of computational power enables researchers to
fully simulate the electromagnetic fields generated by plasmonic effect.
Numerical algorithms like Finite-Difference Time-Domain (FDTD), Finite
Element Method (FEM), etc. solve the Maxwell equations with brute force by
discretizing the space and time, allowing for accurate modeling of
nanostructures with almost any complexity. The advancements in numerical
simulations benefit experimentalists for testing and optimizing nanodevices
before actual synthesis or fabrication. In this research, we also use FDTD
method to calculate the electric field distributions at different modes in the
conjugate system.
The thesis will be organized as follows: In Chapter 3, we present all the
methodologiesused for synthesizing the conjugates composed of gold
nanostructures and QDs, including SAuNP-QD (spherical AuNPs and QD),
AuNR-QD (gold nanorod and QD), and PS-AuNP-QD (popcorn-shaped
AuNP and QD). In Chapter 4, we present the results for the optical property of