tổng hợp tất cả các bài báo nghiên cứu khoa học hay nhất đã được đăng trên tạp chí
Bạn đang xem bản rút gọn của tài liệu. Xem và tải ngay bản đầy đủ của tài liệu tại đây (31.02 MB, 389 trang )
Environ Sci Pollut Res (2013) 20:8132–8140
DOI 10.1007/s11356-013-2060-8
REVIEW ARTICLE
The potential environmental risks of pharmaceuticals
in Vietnamese aquatic systems: case study of antibiotics
and synthetic hormones
Hoang Thi Thanh Thuy & Tuan Dinh Nguyen
Received: 1 July 2013 / Accepted: 1 August 2013 / Published online: 13 August 2013
# Springer-Verlag Berlin Heidelberg 2013
Abstract Presently, many pharmaceuticals are listed as emerging contaminants since they are considered to be great potential
threats to environmental ecosystems. These contaminants, thus,
present significant research interest due to their extensive use and
their physicochemical and toxicological properties. This review
discusses a whole range of findings that address various aspects
of the usage, occurrence, and potentially environmental risks of
pharmaceuticals released from various anthropogenic sources,
with emphasis on the aquatic systems in Vietnam. The published
information and collected data on the usage and occurrence of
antibiotics and synthetic hormone in effluents and aquatic systems of Vietnam is reported. This is followed by a potential
ecological risk assessment of these pollutants. The extensive
use of antibiotics and synthetic hormones in Vietnam could cause
the discharge and accumulation of these contaminants in the
aquatic systems and potentially poses serious risks for ecosystems. Vietnam is known to have extensively used antibiotics and
synthetic hormones, so these contaminants are inevitably detected in aquatic systems. Thus, an appropriate monitoring program
of these contaminants is urgently needed in order to mitigate their
negative effects and protect the ecosystems.
Keywords Pharmaceuticals . Antibiotics . Synthetic
hormones . Aquatic systems . Resistant bacteria . Endocrine
disruptors
Background and purposes
Pharmaceuticals comprise an array of products, including
chemical formulations and multiple biological targets.
Responsible editor: Philippe Garrigues
H. T. Thanh Thuy (*) : T. D. Nguyen
Ho Chi Minh City University for Natural Resources and
Environment, Ho Chi Minh City, Vietnam
e-mail:
Recently, a variety of pharmaceutical compounds have been
detected in the environment as well as their potential negative
ecological significance on nontarget species. In particular,
aquatic systems are highly susceptible to be at risk for potential contamination by various pharmaceutical products due to
increasing human population density and intensive animal
farming techniques. For example, both human and veterinary
antibiotics have been also discovered in various surface waters
and, recently, studies showed that some of which have been
linked to ecological impacts at trace concentrations
(Sanderson et al. 2003). The presence of antibiotic residues
in different environmental compartments is a growing problem of unexpected consequences, i.e., appearance of resistant
bacteria as occurring in the Escherichia coli crisis in Germany
during 2011 or the decline of vulture population in India due
to the bioaccumulation of diclofenac taken from carcasses of
dead livestock (Ginebreda et al. 2010). In addition, synthetic
hormone 17α-ethinyl estradiol (EE2), which is a main composition of birth control pharmaceutical, is now collectively
known as endocrine-disrupting compound, which could mimic natural hormones in the endocrine systems of animals (Kidd
et al. 2007).
Therefore, reports of occurrence of pharmaceuticals (EE2
and antibiotics) in aquatic systems have raised substantial
concern among the public and regulatory agencies. The contamination due to the EE2 and pharmaceutical residues have
been reported in effluents of wastewater treatment plants
(WWTPs) (Gracia-Lor et al. 2011; Gros et al. 2006) and in
rivers and lakes around the world (Kasprzyk-Hordern et al.
2008; Kolpin et al. 2002). However, the literature related with
this topic in Vietnam remains scare. As other developing
countries, antibiotics and synthetic hormones are widely used
in Vietnam. In addition, most of the wastewater is not treated
or only primary treated so that poses a negative impact on the
environment.
Thus, the present review does focus on antibacterial agents
including fluoroquinolones (FQs), tetracyclines (TCs),
Environ Sci Pollut Res (2013) 20:8132–8140
cephalosporins (CEPHs), and xenoestrogen 17α-ethinyl estradiol (EE2) because of their high consumption and their
observed persistence in the aquatic environment. The recent
literature published on the topic of consumption, occurrence,
and potential risks of these contaminants in Vietnamese aquatic systems will be cited and reviewed.
Usage of antibiotics and synthetic hormones
Human pharmaceuticals Presently, there are no trusted data
available about the total consumption for antibiotics in
Vietnam. According to the number of registered brands
and unofficial information from pharmacies and hospitals,
β-lactams, macrolides, and FQs are the most widely used
types (Duong et al. 2008).
Another survey carried out with GARP-Vietnam, University of Oxford and Vietnamese Ministry of Health has shown
high consumption of antibiotics in most hospitals in Vietnam,
with an increased use of new generation and expensive antibiotics like carbapenems. In general, CEPHs are the most
common used antibiotics in all hospitals, followed by penicillins, macrolides, and quinolones (GARP-Vietnam 2010).
The recent study by our group was conducted during
April–May 2012. The interviews were based on an extensive
questionnaire. Altogether, 10 hospitals and 17 pharmacies
were interviewed in the key economic zone of South Vietnam
(Hochiminh City, Binh Duong and Dong Nai provinces). The
results confirmed that FQs, TCs, and CEPHs are still widely
used (Table 1). In addition, these antibiotics are also bestselling antibiotics in pharmacies.
This study has also revealed the extensive use of synthetic
hormones in Vietnamese hospitals; follitropin, estrogens, and
progesterone are frequently used. In addition, the data from
pharmacies indicated that many contraceptive medicines are
sold. The most popular synthetic hormones of these medicines
are ethinyl estradiol, desogestrel, dydrogesterone, levonorgestrel, etc. (Table 2).
Veterinary pharmaceuticals Agriculture, including aquaculture, is an increasingly important economic sector in Vietnam
and in which antibiotics are extensively used as growth promoters as well as for prophylaxis and treatment of infections.
For example, integrated agricultural operations, such as
Vietnam’s common “vegetable, aquaculture, caged-animal”
system, may present an increased risk of human exposure to
antibiotics and antibiotic-resistant bacteria/genes (Suzuki and
Hoa 2012).
The other data indicate that 70 % of all pharmaceutical
products used in the animal sector are antibiotics (National
Agro-Forestry-Fisheries Quality Assurance Department
2009). The data reported from husbandry showed the consumption of antibiotics as follows:
8133
Table 1 The frequency (%) of antibiotics using and selling in South
Vietnam (based on a survey of 10 hospitals and 17 pharmacies)
Group/substance
Hospital
Pharmacies
Internal treatment External treatment
Fluoroquinolones
Ciprofloxacin
Levofloxacin
Norfloxacin
Tetracyclines
Doxycycline
Tetracycline
Oxytetracycline
Cephalosporins
Cefaclor
Cefotaxime
Cefoperazone
Cefepime
Cefazolin
Cefdinir
Ceftazidime
Ceftriaxone
Cephalexin
Cefadroxil
–
–
40
40
10
90
90
40
100
100
47
50
30
–
100
60
30
100
88
–
20
70
50
30
30
10
10
20
90
20
50
10
0
20
10
0
0
0
90
10
94
41
12
6
–
–
–
–
94
82
FQs, enrofloxacin (ENRO-7 %) and norfloxacin (NOR5 %)
TCs, tetracycline (TC-4 %).
More precisely, for Vietnamese shrimp farming, the most
common antibiotics used can be divided into the following
five groups: (1) FQs (ENRO, NOR, ciprofloxacin (CIP), and
oxolinic acid (OXLA)), (2) sulfonamides (sulfamethoxazole,
sulfadiazine), (3) TCs (oxytetracycline (OTC)), (4)
diaminopyrimidines (trimethoprim, ormetoprim), and (5) unclassified (griseofulvin and rifampicin) (Thuy et al. 2011).
Occurrence in wastewater and aquatic system
FQs Several studies have reported the occurrence of FQs in
Vietnamese wastewaters as well as aquatic systems. Duong
et al. (2008) have reported the maximum concentrations of the
FQs (CIP) and NOR in aqueous grab samples from the hospital wastewater effluents varied from 10 to 15 μg/l (Table 3).
Other FQs like levofloxacin (LEV), ofloxacin (OFL), and
lomefloxacin were below the detection limit. The levels of
CIP and NOR in Vietnam were generally in the same order of
magnitude as in Switzerland. The removal of the analyzed
FQs from the water stream during wastewater treatment was
between 80 and 87 %, presumably mainly through sorption to
8134
Environ Sci Pollut Res (2013) 20:8132–8140
Table 2 Types of contraceptive hormones sold in South Vietnam
No Commercial Active substance
name
Manufacturer
1.
Ciclomex
Ethinyl Estradiol
2.
3.
Diane 35
Drasperin
4.
Duphaston
Ethinyl Estradiol
Droprrenone, Ethinyl
estradiol
Dydrogesterone
5.
Genestron
Levonorgestrel
6.
Marvelon
7.
Mercilon
8.
9.
Mifestad
Newchoice
Desogestrel, Ethinyl
estradiol
Desogestrel, Ethinyl
estradiol
Mifepriston
Levonorgestrel,
Ethinyl Estradiol
Levonorgestrel,
Ethinyl estradiol
Desogestrel, Ethinyl
estradiol
Lynestrenol
Levonorgestrel
Desogestrel, Ethinyl
estradiol
Ethinyl estradiol,
Levonorgostrel
Ethinyl estradiol,
Levonorgostrel
Laboratorios Recalcine S.A.
Chile
Schering AG, Germany
Laboratorios Recalcine S.A.
Chile
Solvay Pharmaceuticals
GmbH, Germany
Laboratorios Recalcine S.A.
Chile
Ampharco USA
10. Nordette
11. Novynette
12. Orgametril
13. Postinor
14. Regulon
15. Rigevidon
16. Triregol
N.V Organon, Ireland
Stada, Vietnam
Nam ha, Vietnam
Wyeth Medica, Ireland
Gedeon Richter, Hungary
N.V Organon
Gedeon Richter, Hungary
Gedeon Richter, Hungary
Gedeon Richter, Hungary
Consilient Health, England
particulates. These elimination rates are in agreement with the
values reported in the literature.
Related with the shrimp culture, Le and Munekage (2004)
have reported the occurrence of NOR at 0.06–6.06 mg/l in the
water column and 6.51–2,615 mg/kg in the sediment of intensive ponds and improved extensive ponds. OXLA could be
detected in the water column at a concentration similar to that
of NOR (0.01–2.5 mg/l), but not in the sediment. The “water
column concentration” indicates present inflow, while the
“sediment concentration” indicates the value integrated over
time (Takasu et al. 2011). Thus, the presence of antibiotics in
both samples suggests that the antibiotics are presently used
and retained in the sediment.
Another study reported by Takasu et al. (2011) showed that
OFL/LEV and NOR were found to be major FQs in waters of
Vietnam, including city canals, hospital wastewater, pig farm
wastewater, and aquaculture sites. This suggests that OFL/
LEV and NOR have been widely used for human and veterinary purposes. OFL and NOR were confirmed as major
environmental contaminants. A recent decrease in drug application and/or dilution effects may explain the improved contamination situation in aquaculture settings.
The most recent study showed that CIP is still a commonly
used FQ for shrimp larvae in Vietnam (Thuy and Loan 2012).
In shrimp pond water samples, CIP concentrations varied
from 0.35 to 1.23 μg/l. At the outlet, the CIP levels ranged
from 0.65 to 0.98 μg/l and 1.54–1.88 μg/kg in water and
sediment samples, respectively.
TCs A recent study by Shimizu et al. (2013) has shown that
OTC was predominant in livestock wastewater. The mean value
of Vietnamese pig farm effluents was 175 ng/l. The level of other
tetracycline pharmaceuticals (TC and doxytetracycline (DOX))
was relatively low, almost below LOD and LOQ. In the suburban
and city canals as well as in Mekong delta, only OTC was
detected, whereas TC and DOX were below the detection limit.
The geometric means of urban and suburban canal samples were
5 and 45 ng/l, respectively. In the Mekong delta, the concentrations of TC, DOX, and OTC were relatively low. TC and DOX
were not detected in all samples, and OTC was detected only at
one site. The dilution with non-contaminated river water has
decreased the level of TCs in Mekong delta.
CEPHs This antibiotic group belongs to β-lactam antibiotics,
which are widely used to treat bacterial infections of various
organs (e.g., bovine mastitis, pneumonia, arthritis, etc.). In
contrast to their high consumption, the data related with
occurrence of CEPHs in Vietnamese effluent as well as receiving water bodies were not readily available.
EE2 The xenoestrogen EE2 is the major compound of the
contraceptive pill and eventually gets excreted in urine. Studies abroad have shown that the concentrations of EE2 in the
environment are mostly lower than 5 ng/l, whereas concentrations in the WWTP effluent can exceed 50 ng/l (Moschet
2009). Due to the higher persistence of EE2 in the WWTP, the
concentrations of this pharmaceutical in the environment is
analogous to concentrations of the natural estrogens, despite
the fact that it is excreted in much smaller amounts. However,
no data related with this compound in effluent and aquatic
system for Vietnam could be found.
Environmental fate of pharmaceuticals in aquatic system
The detection of antibiotics like FQs and TCs in Vietnamese
agricultural and hospital wastewater as listed in Table 3 is
probably due to the fact that these antibiotics are not fully
absorbed either by target organisms and/or human beings.
This observation is consistent with previous studies showing
excretion rates of 30–85 and 60–90 % for FQs and TCs,
respectively (Table 4). In addition, due to the wide variation
of antibiotic’s degradability, some of them still remain in
treated wastewater and after that enter the receiving water
bodies. This is the case of FQs, which are frequently detected
Environ Sci Pollut Res (2013) 20:8132–8140
8135
Table 3 Occurrences of antibiotics (μg/l or μg/kg) in Vietnam
Substance
Surface water
Sediment
Wastewater
References
FQs
CIP
0.65–0.98
1.54.–1.88
Agricultural wastewater
Shrimp larvae: 0.35–1.23
Hospital wastewater
Raw: 1.1–10.9b; 25.8±8.1c
Treated: 3.7±1.3c
Thuy and Loan 2012
Duong et al. 2008
NOR
Surface layer: 60–6,060
Bottom layer: 80–4,040
6,510–2,616×103
Le and Munekage 2004
Hospital wastewater:
Raw: b.d. −15.2b; 6.8±1.1c
Treated: 1.4±0.2 (c)
OXLA
OFL/LEV
TCs
DOX
Surface layer: 10–2,500
Bottom layer: 10–2,310
City canal: 185–782
1,810–426.31×10³
Le and Munekage 2004
Takasu et al. 2011
b.d.
TTC
b.d.
OTC
Urban canal: b.d.−0.0053 (2/12)a
Suburban canal: b.d.−0.216 (2/29)a
River water: b.d.−0.004 (1/25)a
a
Duong et al. 2008
Agricultural wastewater/sewage sludge
b.d.
Sewage sludge: b.d.−0.3163 (1/7)a
Agricultural wastewater
Pig farm: 0.031–0.9 (5/14)a
Aquaculture: b.d.
Shimizu et al. 2013
Shimizu et al. 2013
Number of detected samples/total samples
b
One grab samples of untreated water (duplicated analysis)
c
Hourly sampling
and to a lesser extent of TCs. The environmental fate of each
pharmaceutical group can be summarized as follows:
Table 4 Excretion and removal rates for antibiotics and EE2
Group
Excretion Removal rate (%) References
rate (%)
FQs
30–85
78–93
TCs
60–90
CEPHs 92.6
EE2
35
Lindberg et al. 2005; Isidori
et al. 2005
Li and Zhang 2010; Watkinson
et al. 2009; Gulkowska et al.
2008; Lindberg et al. 2006;
Lindberg et al. 2005
Hirsch et al. 1999; Isidori et al.
2005
70–98
Li and Zhang 2010; Gulkowska
et al. 2008; Lindberg et al.
2005
Harada et al. 1976
95
Homem and Santos 2011
Johnson et al. 2000
80–90
Baronti et al. 2000; Layton et al.
15.8–70.9 (MBR
2000; Yang et al. 2012
without/with
PAC)
MBR membrane bioreactors and PAC powdered activated carbon
FQs Previous studies have reported that FQs are insensitive to
hydrolysis and increased temperatures but are degraded by
UV light (Burhenne et al. 1997; Ge et al. 2010; Knapp et al.
2005; Lai and Lin, 2009). For example, CIP—a frequently
detected FQ—has a solubility of 35 g/l (Kümmerer 2009). In
addition, laboratory tests confirmed that CIP biodegradation
seems to be insignificant. The calculated half-lives for CIP are
about 25 days (Thuy et al. 2012). However, the
photodegradability of FQs is pH dependent, so it is probably
one of the reasons why FQs are so frequently detected in pond
water as well as surface water. In addition, FQs are sensitive to
sorption into soil and clay. Giger et al. (2003) and Golet et al.
(2002) have reported the persistence of FQs in sludge-treated
soils several months after application. FQs have also been
found to adsorb onto sediments. Córdova-Kreylos and Scow
(2007) have measured the sorption of CIP in sediment samples from three Californian salt marshes. Sediments were
exposed to a CIP concentration gradient (0–200 mg/l). The
correlation of sorption coefficients (log Kd) was positive
with clay content (r2 =0.98) and negative with pH (r2 =
0.99).
8136
TCs Some instability in aquatic systems could be demonstrated for some TCs (Halling-Sørensen 2000). In general, the
hydrolysis rates for OTC increase as the pH deviates from
pH 7 and as temperature increases. The half-lives of OTC vary
due to differences in temperature, light intensity, and flow rate.
In addition, TCs are susceptible to photodegradation. For
example, Samuelsen (1989) has investigated the sensitivity
of OTC towards light in seawater as well as in sediments. This
antibiotic proved to be stable in sediments rather than in
seawater. Oka et al. (1989) have also reported that no other
photodegradation process is known for this antimicrobial
molecule. Thus, TCs remain in the sediment for a long period,
as shown by Lunestad and Goksøyr (1990).
CEPHs The environmental fate and impacts of CEPHs are still
unclear. Jiang et al. (2010) have studied the degradation of four
CEPHs (cefradine, cefuroxime, ceftriaxone, and cefepime) from
each generation in the surface water and sediment of Lake
Xuanwu, China. The CEPHs are degraded abiotically in the
surface water in the dark with half-lives of 2.7–18.7 days, which
are almost the same as that in sterilized surface water. Under
exposure to simulated sunlight, the half-lives of the CEPHs
decrease significantly to 2.2–5.0 days, with the maximal decrease
for ceftriaxone from 18.7 days in the dark to 4.1 days under light
exposure. Elimination rates of the CEPHs in oxic sediment (halflives of 0.8–3.1 days) are higher than in anoxic sediment (halflives of 1.1–4.1 days), mainly attributed to biodegradation. Thus,
it can be concluded that abiotic hydrolysis is the primary process
for the elimination of cefradine, cefuroxime, and cefepime. In the
case of ceftriaxone, direct photolysis is the major degradation
mechanism in the surface water of the lake. In addition, biodegradation is responsible for the elimination of the CEPHs in the
sediment (Jiang et al. 2010).
EE2 The synthetic hormone EE2 is excreted in urine and
feces in a ratio of about 4:6. In the environment, this steroid
hormone can be degraded in different ways. This includes
sorption, photolytic degradation, as well as microbial degradation. There is a lot of literature dealing with sorption (e.g.,
Cirja et al. 2007; Lee et al. 2003), but less about photolytic
degradation has been reported (e.g., Liu et al. 2003; Zuo et al.
2006). However, the most important process to eliminate this
xenoestrogen is the microbial degradation. Sorption and to
minor extent photodegradation can also play a role in the
elimination of EE2 in the aquatic system.
Hazards and risks
Antibiotic resistance
The concern regards the effect these antibiotics may have on
aquatic systems after receiving effluents from various sources.
Environ Sci Pollut Res (2013) 20:8132–8140
The most obvious concern relates to how these antibiotics will
affect the nontarget bacteria in the aquatic system, since the
role of antibiotics are to kill bacteria. Moreover, as mentioned
before, most seriously negative effects on the aquatic ecosystems are not the only fear with antibiotics, but also the risk for
the development of resistance amongst bacteria towards these
compounds. Such a resistance can evolve either through selective pressure on bacterial strains, mutation, or through the
acquisition of new DNA from other resistant bacteria
(Tenover 2006). The resistance can later spread to bacteria
causing human diseases (Kumar et al. 2005). Thus, it is
necessary to mitigate unnecessary prescriptions of the drugs,
especially for developing countries like Vietnam, where people already overuse antibiotics, often without prescriptions.
FQs Since FQs are not natural compounds, it is believed that
bacteria do not possess FQ resistance genes. However, bacteria resistant to FQs can be found easily (Duong et al. 2008;
Takasu et al. 2011). The reason for that is due to the long halflives in the environment, so FQs pose a selective pressure for
environmental bacteria in the environment. Previous studies
have shown that FQs are relatively stable in water and sediment (Kümmerer 2009; Le and Munekage 2004), which
might be due to sorption onto particulates (Lai and Lin
2009; Nowara et al. 1997). A broad range of bacteria can
acquire resistance to FQs including common bacteria
(Escherichia coli), pathogenic bacteria (e.g., Acinetobacter),
and aquatic bacteria (e.g., Brevundimonus). Proteobacteria
and Actinobacteria are the major taxa of FQ-resistant bacteria,
indicating that FQ-resistant bacteria are not limited to specific
groups (Takasu et al. 2011). In addition, Takasu et al. (2011)
have found that there is no relationship between the concentration of FQs in the environment and the rate of bacterial
resistance. Therefore, despite the lower level of contamination, the occurrence rate of FQ-resistant bacteria has been
found to be higher in Vietnam than in Thailand (Takasu
et al. 2011). Thus, the aquatic environment is hypothesized
to be a natural reservoir of FQ-resistant bacteria and resistance
genes.
TCs The wide application as human and veterinary medicines
has been accompanied by an increased frequency of TCs
resistance (Akinbowale et al. 2007; Gao et al. 2012; Ryu
et al. 2012). Presently, more than 40 different tetracycline
resistance determinants have been reported (Roberts 2005).
In aquaculture ecosystems, several tetracycline resistance determinants tet(A)–tet(W) have been identified in fish pathogenic bacteria from a number of geographical locations and
fish species (Akinbowale et al. 2007; Gao et al. 2012; Seyfried
et al. 2010) as well as amongst commensals (Ryu et al. 2012).
In addition, bacteria resistant to OTC, a TC derivative, have
been reported in fish pathogens and environmental bacteria
(Nonaka et al. 2007).
182
Tetracycline
17α10
Ethinylestradiol
Hormone
LC50 (48 h)
(mortality)
110.1
Oxytetracycline
LOEC (21 days)
(fertilization rate)
LC50 (96 h)
LC50 (48 h)
(mortality)
Chlortetracycline 78.9
Tetracyclines
EC50 (growth rate) HallingSørensen
2000
NOEC (growth
Eguchi et al.
inhibition)
2004
Grung et al. 2007
Pawlowski et al.
2004
Nordic Council of
Ministers 2012
44.8
0.2
EC50 (21 days)
(reproduction)
Ando et al. 2007
PNEC (72 h) (reproduction) Yamashita et al.
2006
0.09
0.183
EC50 (growth rate) HallingSørensen
2000
Lin et al. 2008
Jones et al. 2002;
Lin et al. 2008
21900
0.002
Jones et al. 2002;
Lin et al. 2008
Jones et al. 2002;
Lin et al. 2008
Jones et al. 2002;
Lin et al. 2008
Jones et al. 2002;
Lin et al. 2008
Jones et al. 2002;
Lin et al. 2008
Golet et al. 2002;
Lin et al. 2008
Golet et al. 2002;
Lin et al. 2008
Golet et al. 2002;
Lin et al. 2008
Ref.
200
90
40
Cefotaxime
0.05
Holten Lützhøft
et al. 1999
Schlabach 2009
40
Ando et al. 2007 150
Yamashita et al.
2006
20
1250
Park and Choi
2008
16
EC50 (72 h)
(growth
inhibition)
EC50 (72 h)
(growth
inhibition)
NOEC (growth
inhibition)
NOEC (96 h)
growth
inhibition
Ref.
Cefazolin
EC50 (48 h)
(immobilization)
4.01
0.300
Grung et al. 2008 0.18
Wollenberger
et al. 2000
Isidori et al. 2005
Park and Choi
2008
Yamashita et al.
2006
Halling-Sørensen
et al. 2000
Ecotoxicity Toxicological
data
endpoint
PNEC
(ng/l)
2500
225
NOEC (21 days)
(reproduction)
EC50 (7 days) (population
growth inhibition)
LC50 (48 h)
NOEC(21 days)
reproduction
NOEC (21 days)
reproduction
NOEC
Ref.
Algae
Lowest PNEC
Cephalexin
Cephalosporins
Sarafloxacin
0.38
Oxolinic acid
62.3
3.13
Park and Choi 2008
Kim et al. 2009
Ofloxacin
Norfloxacin
Marbofloxacin
LC50 (96 h)
(mortality)
60
0.031
100
Halling-Sørensen
et al. 2000
Levofloxacin
NOEC
5
100
Ecotoxicity Toxicological
data
endpoint
Ecotoxicity Toxicological
data
endpoint
Ref.
Crustacean
Fish
Ecotoxicological data (μg/l)
Enrofloxacin
Ciprofloxacin
Fluoroquinolones
Compound
Table 5 Toxicity data of pharmaceuticals
Environ Sci Pollut Res (2013) 20:8132–8140
8137
8138
Environ Sci Pollut Res (2013) 20:8132–8140
These finding are consistent with the study of Zhang et al.
(2009), which have indicated that among the TCs resistance
genes, the tet(M) is one of the most widely distributed tetracycline resistance determinants. The host range for the tet(M)
covers 42 genera, and this gene continues to have the widest
host range of any tet genes (Roberts 2005). Suzuki et al.
(2008) reported that the tet(M) has been also isolated in
coastal aquaculture areas and sediments in Mekong River,
Vietnam.
(PNECs) are calculated applying a safety factor. The acute and
chronic toxicity as well as lowest PNECs of studied pharmaceuticals were listed in Table 5. It was found that the maximum levels of antibiotics (FQs and TCs) in Vietnamese
aquatic system have exceeded the PNECs, which could lead
to seriously negative impacts on the ecosystem.
CEPHs The potential resistance of Enterobacteriaceae family against the third generation of CEPHs has been reported by
Arikan and Aygan (2009). The highest resistance is detected
to the Ceftizoxime and the lowest one is to the Ceftriaxone in
both sampling periods (October 2006–February 2007 and
June–October 2007). Klebsiella pneumonia shows the highest
resistance to all three antibiotics compared to the Enterobacter
aerogenes and E . coli.
Thus, it could be concluded that in spite of low concentrations in the aquatic system, the development of antibiotic
resistance should be taken into account.
Presently, relatively little is known about the situation in
developing countries like Vietnam, where the pharmaceutical
market is rapidly growing. Pharmaceuticals are widely used as
human and veterinary medicines as well as animal feed additives. Due to their relatively high excretion rate, ineffective
removal, and improper disposal, the pharmaceuticals could
enter into the aquatic system via many pathways such as
hospital, domestic, and agricultural wastewaters. In fact, a
great variety of antibiotics have been detected in wastewater
and even in surface water in Vietnam up to now. Once entered
into aquatic systems, the pharmaceuticals have been found to
be rather persistent, which strengthened the assumption of
them constituting a very high risk.
Thus, in conclusion, the results of this study underline the
importance of the negative impacts of antibiotics and synthetic
hormones in Vietnamese aquatic systems. This also further
emphasizes the need for appropriate monitoring program of
these contaminants in order to mitigate their negative effects
and protect the ecosystems.
Endocrine disruption effect
As mentioned above, EE2 belongs to the endocrine disruptors,
and the concentration levels known to have effects are extraordinarily low. For example, effects due to EE2 have been
documented at the sub-ppt level in surrounding water (i.e.,
0.05 ng/l) (Larsen et al. 2008). This means that if they exceed
this level in the environment, it can lead to a misbalance of the
endocrine system in animals. Effects like feminization of male
fish have already been observed near WWTP effluents, including decreased growth of the testes and vitellogenin (an
egg yolk precursor protein) production in male fish which
results in reduced reproduction. Purdom et al. (1994) for
example have found that EE2 concentrations in the range of
1–10 ng/L (i.e., concentrations that have been observed in
rivers) could induce vitellogenin production in male rainbow
trout.
Toxicity data
The selected pharmaceuticals are now known to pose considerable risks, and low concentrations are not related with low
toxicity. Presently, toxicity data of antibiotics is greatly needed
for the understanding of their ecological impacts and the
performance of environmental risk assessments. Studies about
the toxicity effects of antibiotics have been performed with
aquatic organisms in recent years, including luminescent bacteria, algae, invertebrates, and fishes. The toxic effects of
antibiotics in aquatic environments can be expressed as median effective concentration or no observed effect concentration.
Based on toxicity data, the predicted no-effect concentrations
Conclusions
Acknowledgments The authors would like to thank Prof. Lewis
Hinchman and Dr. Paul Truong for editing the English manuscript and
two anonymous reviewers for comments that greatly improved the
manuscript. This research was supported by the Ministry of Natural
Resources and Environment, Project TNMT.04.30.
References
Akinbowale OL, Peng H, Barton MD (2007) Diversity of tetracycline
resistance genes in bacteria from aquaculture sources in Australia. J
Appl Microbiol 103:2016–2025
Ando T, Nagase H, Eguchi K, Hirooka T, Nakamura T, Miyamoto K et al
(2007) A novel method using cyanobacteria for ecotoxicity test of
veterinary antimicrobial agents. Environ Toxicol Chem 26(4):601–
606
Arikan B, Aygan A (2009) Resistance variations of third generation of
cephalosporins in some of the Enterobacteriaceae members in hospital sewage. Int J Agric Biol 11:93–96
Baronti C, Curini R, D’Ascenzo G, Di Corcia A, Gentili A, Samperi R
(2000) Monitoring natural and synthetic estrogens at activated treatment plants and in receiving river water. Environ Sci Technol
34:5059–5066
Burhenne J, Ludwig M, Nikoloudis P, Spiteller M (1997) Photolytic
degradation of fluoroquinolone carboxylic acids in aqueous
solution. Part 1. Primary photoproducts and halflives. Environ Sci
Pollut Res 4(1):10–15
Environ Sci Pollut Res (2013) 20:8132–8140
Cirja M, Zuehlke S, Ivashechkin P, Hollender J, Schaffer A, Corvini PFX
(2007) Behavior of two differently radiolabelled 17 alphaethinylestradiols continuously applied to a laboratory scale membrane bioreactor with adapted industrial-activated sludge. Water Res
41:4403–4412
Córdova-Kreylos AL, Scow KM (2007) Effects of ciprofloxacin on salt
marsh sediment microbial communities. ISME J 1(7):585–595
Duong HA, Pham NH, Nguyen HT, Hoang TT, Pham HV, Pham VC,
Berg M, Giger W, Alder AC (2008) Occurrence, fate, and antibiotic
resistance of fluoroquinolone antibacterials in hospital wastewaters
in Hanoi, Vietnam. Chemosphere 72(6):968–973
Eguchi K, Nagase H, Ozawa M, Endoh YS, Goto K, Hirata K, Miyamoto
K, Yoshimura H (2004) Evaluation of antimicrobial agents for veterinary use in the ecotoxicity test using microalgae. Chemosphere
57:1733–1738
Gao P, Mao D, Luo Y, Wang L, Xu B, Xu L (2012) Occurrence of
sulphonamide and tetracycline-resistant bacteria and resistance
genes in aquaculture environment. Water Res 46:2355–2364
GARP-Vietnam (2010) Situation Analysis of Antibiotic Use and Resistance in Vietnam. Project Report
Ge L, Chen J, Wei X, Zhang S, Qiao X, Cai X, Xie Q (2010) Aquatic
photochemistry of fluoroquinolone antibiotics: kinetics, pathways,
and multivariate effects of main water constituents. Environ Sci
Technol 44:2400–2405
Giger W, Alder AC, Golet EM, Kohler HPE, McArdell CS, Molnar E,
Siegrist H, Suter MJF (2003) Occurrence and fate of antibiotics as
trace contaminants in wastewater, sewage sludges, and surface
water. Chimia (Aarau) 57:485–491
Ginebreda A, Munoz I, de Alda ML, Brix R, Lopez-Doval J, Barcelo D
(2010) Environmental risk assessment of pharmaceuticals in rivers:
relationships between hazard indexes and aquatic macro invertebrate diversity indexes in the Llobregat River (NE Spain). Environ
Int 36:153–162
Golet EM, Alder AC, Giger W (2002) Environmental exposure and risk
assessment of fluoroquinolone antibacterial agents in wastewater
and river water of the Glatt Valley Watershed, Switzerland. Environ
Sci Technol 36:3645–3651
Gracia-Lor E, Sancho JV, Hernández F (2011) Multi-class determination
of around 50 pharmaceuticals, including 26 antibiotics, in environmental and wastewater samples by ultra-high performance liquid
chromatography-tandem mass spectrometry. J Chromatogr A
1218:2264–2275
Gros M, Petrović M, Barceló D (2006) Development of a multi-residue
analytical methodology based on liquid chromatography–tandem
mass spectrometry (LC–MS/MS) for screening and trace level
determination of pharmaceuticals in surface and wastewaters.
Talanta 70:678–690
Grung M, Heimstad ES, Moe M, Schlabach M, Svenson A, Thomas K,
Woldegiorgis A (2007) Human and Veterinary Pharmaceuticals,
Narcotics, and Personal Care Products in the Environment. Swedish
Environmental Research Institute
Grung M, Källqvist T, Sakshaug S, Skurtveit S, Thomas KV (2008)
Environmental assessment of Norwegian priority pharmaceuticals
based on the EMEA guideline. Ecotoxicol Environ Saf 71:328–340
Gulkowska A, Leung HW, So MK, Taniyasu S, Yamashita N, Yeung
LWY, Richardson BJ, Lei AP, Giesy JP, Lam PKS (2008) Removal
of antibiotics from wastewater by sewage treatment facilities in
Hong Kong and Shenzhen, China. Water Res 42:395–403
Halling-Sørensen B (2000) Algal toxicity of antibacterial agents used in
intensive farming. Chemosphere 40:731–739
Halling-Sørensen B, Holten Lützhøft HC, Andersen HR, Ingerslev F
(2000) Environmental risk assessment of antibiotics, comparison
of mecillinam, trimethoprim, and ciprofloxacin. J Antimicrob
Chemother 46(suppl 1):53–58
8139
Harada Y, Matsubara S, Kakimoto M, Noto T, Nehashi T (1976)
Ceftezole, a new cephalosporin C derivative II. Distribution and
excretion in parenteral administration. J Antibiot 29(10):1071–1082
Hirsch R, Ternes T, Haberer K, Kratz KL (1999) Occurrence of antibiotics in the aquatic environment. Sci Total Environ 225:109–118
Holten Lützhøft HC, Halling-Sørensen B, Jørgensen SE (1999) Algal
toxicity of antibacterial agents applied in Danish farming. Arch
Environ Contam Toxicol 36:1–6
Homem V, Santos L (2011) Degradation and removal methods of antibiotics from aqueous matrices—A review. J Environ Manage
92:2304–2347
Isidori M, Lavorgna M, Nardelli A, Pascarella L, Parrella A (2005) Toxic
and genotoxic evaluation of six antibiotics on nontarget organisms.
Sci Total Environ 346:87–98
Jiang M, Wang L, Ji R (2010) Biotic and abiotic degradation of four
cephalosporin antibiotics in a lake surface water and sediment.
Chemosphere 80(11):1399–1405
Johnson AC, Belfroid A, Di Corcia A (2000) Estimating steroid estrogen
inputs into activated sludge treatment works and observations on
their removal from the effluent. Sci Total Environ 256:163–173
Jones OAH, Voulvoulis N, Lester JN (2002) Aquatic environmental
assessment of the top 25 English prescription pharmaceuticals.
Water Res 36:5013–5022
Kasprzyk-Hordern B, Dinsdale RM, Guwy AJ (2008) The occurrence of
pharmaceuticals, personal care products, endocrine disruptors, and
illicit drugs in surface water in South Wales, UK. Water Res
42:3498–3518
Kidd KA, Blanchfield PJ, Mills KH, Palace VP, Evans RE,
Lazorchak JM, Flick RW (2007) Collapse of a fish population
after exposure to a synthetic estrogen. Proc Natl Acad Sci U S
A 104:8897–8901
Kim JW, Ishibashi H, Yamauchi R, Ichikawa N, Takao Y, Hirano M,
Koga M, Arizono K (2009) Acute toxicity of pharmaceutical and
personal care products on freshwater crustacean (Thamnocephalus
platyurus) and fish (Oryzias latipes). J Toxicol Sci 34:227–232
Knapp CW, Cardoza LA, Hawes JN, Wellington EMH, Larive CK,
Graham DW (2005) Fate and effects of enrofloxacin in aquatic
systems under different light conditions. Environ Sci Technol
39:9140–9146
Kolpin DW, Furlong ET, Meyer MT, Thurman EM, Zaugg SD, Barber
LB, Buxton HT (2002) Pharmaceuticals, hormones, and other organic wastewater contaminants in US streams, 1999–2000: a national reconnaissance. Environ Sci Technol 36:1202–1211
Kumar K, Gupta SC, Chander Y, Singh AK (2005) Antibiotic use in
agriculture and its impact on the terrestrial environment. Adv Agron
87:1–54
Kümmerer K (2009) Antibiotics in the aquatic environment—a review
-part I. Chemosphere 75:417–434
Lai HT, Lin JJ (2009) Degradation of oxolinic acid and flumequine in
aquaculture pond waters and sediments. Chemosphere 75:462–468
Larsen M, Hansen K, Henriksen P, Baatrup E (2008) Male zebrafish
(Danio rerio) courtship behavior resists the feminizing effects of
17α-ethinyloestradiol—morphological sexual characteristics do
not. Aquat Toxicol 87(4):234–244
Layton AC, Gregory BW, Seward JR, Schultz TW, Sayler GS (2000)
Mineralization of steroidal hormones by biosolids in wastewater
treatment systems in Tennessee USA. Environ Sci Technol
34(18):3925–3931
Le TX, Munekage Y (2004) Residues of selected antibiotics in water and
mud from shrimp ponds in mangrove areas in Vietnam. Mar Pollut
Bull 49:922–929
Lee LS, Strock TJ, Sarmah AK, Rao PSC (2003) Sorption and dissipation
of testosterone, estrogens, and their primary transformation products
in soils and sediment. Environ Sci Technol 37(18):4098–4105
8140
Li B, Zhang T (2010) Biodegradation and adsorption of antibiotics in the
activated sludge process. Environ Sci Technol 44:3468–3473
Lin AYC, Yu TH, Lin CF (2008) Pharmaceutical contamination in
residential, industrial, and agricultural waste streams: risk to
aqueous environments in Taiwan. Chemosphere 74(1):131–141
Lindberg RH, Wennberg P, Johansson MI, Tysklind M, Andersson BAV
(2005) Screening of human antibiotic substances and determination
of weekly mass flows in five sewage treatment plants in Sweden.
Environ Sci Technol 39(10):3421–3429
Lindberg RH, Olofsson U, Rendahl P, Johansson MI, Tysklind M, Andersson
BAV (2006) Behavior of fluoroquinolones and trimethoprim during
mechanical, chemical, and active sludge treatment of sewage water and
digestion of sludge. Environ Sci Technol 40:1042–1048
Liu B, Wu F, Deng NS (2003) UV-light induced photodegradation of 17
alpha-ethynylestradiol in aqueous solutions. J Haz Mat 98(1–3):311–
316
Lunestad BT, Goksøyr J (1990) Reduction in the antibacterial effect of
oxytetracycline in seawater by complex formation with magnesium
and calcium. Dis Aquat Organ 9:67–72
Moschet C (2009) Microbial degradation of steroid hormones in the
environment and technical systems. />aquaticchemistry/teaching/archive_past_lectures/term_paper_08_09/
HS08_CHRISTOPH_MOSCHET_rev_termpaper.pdf
National Agro-Forestry-Fisheries Quality Assurance Department (2009)
Monthly report of antibiotic residue in aquaculture. http://www.
nafiqad.gov.vn/d-chuong-trinh-giam-sat/a-duluong/ (in Vietnamese)
Nonaka L, Ikeno K, Suzuki S (2007) Distribution of tetracycline resistance gene, tet(M), in Gram-positive and Gram-negative bacteria
isolated from sediment and seawater at a coastal aquaculture sites in
Japan. Microbes Environ 22:335–364
Nordic Council of Ministers (2012) PPCP Monitoring in the Nordic
Countries – Status Report
Nowara A, Burhenne J, Spiteller M (1997) Binding of fluoroquinolone
carboxylic acid derivatives to clay minerals. J Agric Food Chem
45:1459–1463
Oka H, Ikai Y, Kawamura N, Yamada M, Harada K, Ito S, Suzuki M
(1989) Photodecomposition products of tetracycline in aqueous
solution. J Agric Food Chem 37:226–231
Park S, Choi K (2008) Hazard assessment of commonly used agricultural
antibiotics on aquatic ecosystems. Ecotoxicology 17:526–538
Pawlowski S, van Aerle R, Tyler CR, Braunbeck T (2004) Effects of 17ethinylestradiol in a fathead minnow (Pimephales promelas) gonadal
recrudescence assay. Ecotoxicol Environ Saf 57:330–345
Purdom CE, Hardiman PA, Bye VVJ, Eno NC, Tyler CR, Sumpter JP
(1994) Estrogenic effects of effluents from sewage treatment works.
Chem Ecol 8(4):275–285
Roberts MC (2005) Update on acquired tetracycline resistance genes.
FEMS Microbiol Lett 245:195–203
Ryu SH, Park SG, Choi SM, Hwang YO, Ham HJ, Kim SU, Lee YK,
Kim MS, Park GY, Kim KS, Chae YZ (2012) Antimicrobial resistance and resistance genes in Escherichia coli strains isolated from
commercial fish and seafood. Int J Food Microbiol 152:14–18
Samuelsen OB (1989) Degradation of oxytetracycline in seawater at two
different temperatures and light intensities and the persistence of
oxytetracycline in the sediment from a fish farm. Aquaculture 83:7–16
Environ Sci Pollut Res (2013) 20:8132–8140
Sanderson H, Johnson DJ, Wilson CJ, Brain RA, Solomon KR (2003)
Probabilistic hazard assessment of environmentally occurring pharmaceuticals toxicity to fish, daphnids, and algae by ECOSAR
screening. Toxicol Lett 144:383–395
Schlabach M (2009) Environmental screening of selected organic compounds. Swedish Environmental Research Institute
Seyfried EE, Newton RJ, Rubert KF IV, Pedersen JA, McMahon KD
(2010) Occurrence of tetracycline resistance genes in aquaculture
facilities with varying use of oxytetracycline. Microb Ecol 59:799–
807
Shimizu A, Takada H, Koike T, Takeshita A, Saha M, Rinawati NN,
Murata A, Suzuki T, Suzuki S, Chiem NH, Tuyen BC, Viet PH,
Siringan MA, Kwan C, Zakaria MP, Reungsang A (2013) Ubiquitous occurrence of sulfonamides in tropical Asian waters. Sci Total
Environ 452–453:108–115
Suzuki S, Hoa PTP (2012) Distribution of quinolones, sulfonamides,
tetracyclines in aquatic environment and, antibiotic resistance in
Indochina. Front Microbiol 3:1–8
Suzuki S, Kobayashi T, Suehiro F, Tuyen BC, Tana TS (2008) High
occurrence rate of tetracycline (TC)-resistant bacteria and TC resistance genes relates to microbial diversity in sediment of Mekong
river main waterway. Microbes Environ 23:149–152
Takasu H, Suzuki S, Reungsang A, Viet PH (2011) Fluoroquinolone (FQ)
contamination does not correlate with occurrence of FQ-resistant
bacteria in aquatic environments of Vietnam and Thailand. Microbes
Environ 26:135–143
Tenover FC (2006) Mechanisms of antimicrobial resistance in bacteria.
Am J Med 119(6):3–10
Thuy HTT, Loan TTC (2012) Antibiotic residues from shrimp farming in
coastal wetland. Nat Resour Environ 2(2012):61–63 (in
Vietnamese)
Thuy HTT, Nga LP, Loan TTC (2011) Antibiotic contaminants in coastal
wetlands from Vietnamese shrimp farming. Environ Sci Pollut Res
18:835–841
Thuy HTT, Loan TTC, Nga LP, Quoc DP, Phuong TH (2012) Fate of
fluoroquinolone antibiotics in Vietnamese coastal wetland ecosystem. Wetl Ecol Manag 20:399–408
Watkinson AJ, Murby EJ, Kolpin DW, Constanzo SD (2009) The occurrence of antibiotics in an urban watershed: from wastewater to
drinking water. Sci Total Environ 407:2711–2723
Wollenberger L, Halling-Sørensen B, Kusk KO (2000) Acute and chronic
toxicity of veterinary antibiotics to Daphnia magna. Chemosphere
40:723–730
Yamashita N, Yasojima M, Miyajima K, Suzuki Y, Tanaka H (2006)
Effects of antibacterial agents, levofloxacin and clarithromycin, on
aquatic organisms. Water Sci Technol 53:65–72
Yang W, Zhou H, Cicek N (2012) Removal mechanisms of 17β-estradiol
and 17α-ethinylestradiol in membrane bioreactors. Water Sci
Technol 66(6):1263–1269
Zhang XX, Zhang T, Fang HH (2009) Antibiotic resistance
genes in water environment. Appl Microbiol Biotechol
82:397–414
Zuo YG, Zhang K, Deng YW (2006) Occurrence and photochemical
degradation of 17 alpha ethinyl estradiol in Acushnet river estuary.
Chemosphere 63(9):1583–1590
Quang et al. Journal of Animal Science and Technology (2015) 57:35
DOI 10.1186/s40781-015-0068-y
RESEARCH
Open Access
Effect of concentrate supplementation on
nutrient digestibility and growth of
Brahman crossbred cattle fed a basal diet
of grass and rice straw
Do Van Quang1, Nguyen Xuan Ba2, Peter T. Doyle3, Dau Van Hai1, Peter A. Lane4, Aduli EO Malau-Aduli4,
Nguyen Huu Van2 and David Parsons4*
Abstract
Background: An experiment was conducted in Vietnam to test the hypothesis that total dry matter (DM) intake
and liveweight (LW) gain would increase in a curvilinear manner with increasing amounts of concentrate offered.
Method: There were five treatments: a basal diet of Guinea grass fed at 1 % of LW and rice straw fed ad libitum
(T0), or this diet supplemented with concentrate at 0.6 (T1), 1.2 (T2), 1.8 (T3), or 2.4 % of LW (T4). The concentrate
comprised locally available ingredients, namely cassava chips, rice bran, crushed rice grain, fishmeal, salt, and urea,
mixed manually.
Results: Concentrate intake increased from T0 to T3, but there was no difference in concentrate intake between T3
and T4. Total feed intake increased in a curvilinear manner from 4.0 to 6.4 kg DM/d as the quantity of concentrate
consumed increased. The substitution of concentrate for grass and rice straw increased with increasing consumption
of concentrate and was as high as 0.49 kg DM reduction per kg of concentrate consumed. LW gain increased
curvilinearly, with significant differences between T0 (0.092 kg/d), T1 (0.58 kg/d) and T2 (0.79 kg/d); but there were no
significant differences in LW gain between T2, T3 (0.83 kg/d) and T4 (0.94 kg/d).With increasing amount of concentrate
in the diet, the digestibilities of dry matter, organic matter, crude protein, and crude fat increased, but NDF digestibility
decreased.
Conclusion: Based on these results, young Vietnamese Brahman-cross growing cattle will respond to a locally-sourced
concentrate mix offered at a level of up to 1.2 % of LW.
Keywords: Bos indicus, Concentrate, Crossbred, Digestibility, Rice Straw, Vietnam, Yellow cattle
Background
Beef cattle production in Central Vietnam is concentrated in low-input and small-scale enterprises. Farmers
generally have limited knowledge in terms of breed improvement, and feed and feeding management; hence,
livestock production and enterprise productivity remain
low. Little published information is available for the region; however there are some indicators of low performance. For example, a survey of cattle performance
* Correspondence:
4
Tasmanian Institute of Agriculture and School of Land and Food, University
of Tasmania, Sandy Bay 7001, Australia
Full list of author information is available at the end of the article
in Binh Dinh and Phu Yen provinces found that the
average calving interval is longer than one year
(476 days for Binh Dinh and 397 days for Phu Yen) [1].
For growing animals, basal diets of grass and straw can
result in liveweight gains of 0.1 to 0.2 kg/day [2, 3].
Opportunities exist to improve feed efficiency and
growth rate in cattle in Central Vietnam through effective supplement utilisation to enhance the intake of digestible energy and protein.
Many cattle in the region graze native grasses during
the day and are often provided with crop products and
by-products at night [4]. In general, native grass and rice
straw can only meet the maintenance requirements of
© 2015 Quang et al. Open Access This article is distributed under the terms of the Creative Commons Attribution 4.0
International License ( which permits unrestricted use, distribution, and
reproduction in any medium, provided you give appropriate credit to the original author(s) and the source, provide a link to
the Creative Commons license, and indicate if changes were made. The Creative Commons Public Domain Dedication waiver
( applies to the data made available in this article, unless otherwise stated.
Quang et al. Journal of Animal Science and Technology (2015) 57:35
cattle, as they are low in metabolisable energy and protein [5, 6]. Ba et al. [7] showed that a range of introduced grasses can be productive in this environment,
and a small but growing proportion of farmers confine
cattle and feed basal diets of cut-and-carry native or
sown grasses with by-products, such as rice straw, sugar
cane tops, groundnut tops, and sweet potato leaves.
While these crop by-products are useful sources of digestible and metabolisable energy for maintenance of
cattle, they are often deficient in meeting the energy and
protein requirements for growth in young beef cattle.
Thus, some farmers provide locally available products
(such as rice grain, rice bran, cassava leaves, and maize)
that are not only highly digestible, but may also contain
reasonable protein concentrations.
Supplementing Vietnamese cattle with energy-rich
feeds and a source of protein can increase growth rates
and reduce the time taken to attain market weight in
finishing [2, 3]. However, the responses in liveweight
(LW) gain to increasing amounts of supplementation
vary depending on the composition of the concentrate
and the interactions between the basal diet and supplement [8]. There are numerous reports in the published
literature of substantial increases in liveweight gain
(LWG) in cattle consuming low quality forages supplemented with energy and protein-rich feeds [9].
Diets and supplementary feed mixes for cattle in
smallholder systems should be based on locally available
forages, crop residues, and feed ingredients from agricultural by-products, because commercial complete mixed
rations and feed supplements are in limited supply and
are usually costly. A key challenge in Central Vietnam is
to design diets and supplements that provide adequate
metabolisable energy and protein for acceptable growth
rates of young cattle. The objective of this research was
to determine the effect of the amount of supplement
(formulated from locally-available ingredients) on intake,
nutrient digestibility, and growth of young cattle. We
hypothesised that total DM intake and LWG would increase in a curvilinear manner with increasing amounts
of concentrate offered.
Methods
Animals and experimental design
Twenty male cross-bred Brahman bulls of 11–12 months
of age and weighing between 190–200 kg were fed at the
Institute of Animal Sciences research station (Ben Cat
District, Binh Duong Province) in Southern Vietnam. All
experimental procedures were in accordance with the
University of Tasmania Animal Ethics Committee guidelines, the 1993 Tasmania Animal Welfare Act and the
2004 Australian Code of Practice for the Care and Use of
Animals for Scientific Purposes. Cattle were blocked on
the basis of LW and allocated into 4 treatment groups of
Page 2 of 8
5 animals per treatment. All animals were treated for internal and external parasites and vaccinated against foot
and mouth disease, pasteurellosis, and rinderpest prior to
the experiment. Cattle were kept in individual feeding
stalls throughout adaptation and feeding periods. They
were observed daily for any signs of discomfort caused by
the housing, and daily feed intake was monitored and
recorded.
The experimental design was a randomized complete
block design with a control and four amounts of supplement: Control (T0) - basal diet of Guinea grass (fed
at 1.0 % LW) and rice straw fed ad libitum; T1- the
basal diet + concentrate fed at 0.6 % LW; T2: the basal
diet + concentrate fed at 1.2 % LW; T3 - the basal diet
+ concentrate fed at 1.8 % LW; T4 - the basal diet +
concentrate fed at 2.4 % LW.
The experiment had a duration of 98 days, comprising:
an adaptation period of 14 days (26 Sep 2010 to 10 Oct
2010), a treatment period of 84 days (11 Oct 2010 to 11
Jan 2011), and a digestibility period of 7 days (the final
7 days of the treatment period).
Feeds and their nutritive characteristics
Rice straw was purchased in one lot to minimise variation in characteristics throughout. It was dried, properly stored in a dry and well ventilated barn, chopped
into 5-10-cm lengths and mixed well before feeding.
Guinea grass was harvested at 30–40 days of re-growth,
chopped into 5-10-cm lengths, and mixed well before
feeding. Concentrate ingredients included cassava chips
(34 % DM basis), rice bran (30 %), crushed rice grain
(30 %), fishmeal (3 %), salt (1 %), and urea (2 %), which
were manually mixed. The nutritive characteristics of
the ration ingredients are shown in Table 1.
Feeding regime
The basal diet of Guinea grass was fed at 1.0 % LW in
roughly two equal portions at 0800 and 1300 hours, with
any residuals collected and weighed at 1800 hours. Rice
straw was fed ad libitum once daily at 1830 hours, at
20 % above the previous day’s intake. The amount offered to each animal was adjusted once a week based on
Table 1 Nutritive characteristics of the Guinea grass, rice, straw,
and concentrate used in the experiment
Nutritive Characteristic
Dry matter (%)
Guinea grass Rice straw Concentrate
21.8
93.5
87.0
5.3
17.5
7.5
Neutral detergent fibre (% DM)
72.5
73.6
11.4
Crude protein (% DM)
12.4
4.1
15.9
Ash (% DM)
Ether extract (% DM)
Gross energy (MJ/kg DM)
1.6
1.1
5.0
19.5
15.8
18.2
Quang et al. Journal of Animal Science and Technology (2015) 57:35
LW. Straw residues were collected at 0700 hrs prior to
feeding grass each morning.
Mixed concentrate was offered to cattle twice daily in
separate feeding troughs from the Guinea grass and rice
straw. Concentrate was fed prior to offering the grass
just before 0800 and at 1300 hours. Where the animals
did not consume all of the concentrate within a short
period after it was offered, they were allowed free access
throughout the day. Residues were collected daily at
0700 hrs and weighed.
At the beginning of the adaptation period, all supplemented animals were fed a maximum of 0.5 kg of the
mixed concentrate per day. The amount of concentrate
was gradually increased by approximately 0.5 kg every
second day up to the amount for the treatment. Each
animal had free access to a 5-kg mineral block and
water.
Measurements
Cattle were weighed at 0630 hrs on two consecutive days
at the start and end of the adaptation phase and weekly
throughout the experimental period, to calculate daily
LW change. The amounts of each feed offered and refused were weighed and sub-samples collected for dry
matter determination daily. Additional sub-samples of
each feed offered were collected daily, bulked within
each 7 day period, and stored for analysis.
Digestibility trial
During the last consecutive 7 days of the experimental
period, total faecal output was manually collected for
each animal. The output was thoroughly mixed each day
and subsamples taken for DM determination (dried to a
constant weight at 105 °C) and for laboratory analyses
(about 5 % of the total). The subsamples for analyses
were stored at −20 °C and bulked over the 7 days, after
which they were defrosted, mixed, and further samples
taken for nutrient composition analyses.
Laboratory analysis
Dry matter of feeds, residues from individual animals,
and faecal samples were determined by drying at 105 °C
to a constant weight. Samples for chemical analysis were
dried at 60 °C. Ash content was determined by heating
samples in a furnace at 550 °C for 4 hours and organic
matter (OM) content calculated as DM minus ash [10].
Neutral detergent fibre (NDF) was determined as described by Van Soest et al. [11]. Ether extract (EE) was
determined using the standard Soxhlet fat extraction
method [10]. Total nitrogen (N) was measured by the
Kjeldahl procedure and crude protein (CP) calculated
as N x 6.25. Gross energy (GE) of feed, residues and
faeces was determined by bomb calorimetry (Bomb
Calorimeter 6300, Parr Instrument Company).
Page 3 of 8
Calculations and statistical analyses
Liveweight gain was calculated from the difference between final and initial weights. Apparent digestibility of
DM and OM, and digestibility of NDF were calculated
as intake (kg DM/day) minus faecal output (kg DM/day)
divided by intake (kg DM/day) expressed as a percentage. Substitution rate was calculated as the difference
between control roughage (grass and rice strass) intake
and treatment roughage intake, divided by concentrate
intake.
Intake, LWG, and digestibility response variables were
analysed in SAS (SAS Institute: The SAS system for
Windows. v. 9.1. Cary, NC; 2003) [12] using PROC
GLM with concentrate as a fixed effect, and a random
block. Fisher’s protected LSD was used to test differences (P < 0.05) among means where the overall F test
was significant. Regression equations were developed
using the PROC GLM procedure, based on initial body
weight and amount of concentrate offered and their
quadratic terms as explanatory variables. Variables were
dropped from the regression model if non-significant
(P < 0.05) in the presence of other explanatory variables,
and the regression re-calculated until only significant
variables remained. The coefficient of determination
(r2) and the overall F-test significance of the regression
were determined. The regression equation is not presented where the overall F-test was not significant.
Results
Summary statistics (mean, standard deviation, and range)
for the key outputs are shown in Table 2. Table 3 contains
regression results and Table 4 contains analysis of variance
results.
The effect of concentrate on intake
There was a significant (p < 0.0001) non-linear effect of
treatments on concentrate intake (Table 3), with intake
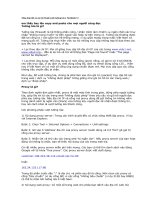
increasing from T0 to T3, but no difference in concentrate intake between T3 and T4 (Table 4). Guinea grass
intake declined linearly with increasing concentrate offered (Table 3) and concentrate consumed (Fig. 1). Rice
straw intake declined curvilinearly with increasing concentrate offered (Table 3) and concentrate consumed
(Fig. 1).
Total dry matter intake increased curvilinearly from
4.0 to 6.4 kg/d as the amount of concentrate consumed
increased (Fig. 1). The substitution rate of concentrate
for Guinea grass and rice straw increased linearly with
amount of supplement consumed (Table 3), and was as
high as 0.49 kg DM/kg DM (Table 4).
The intakes of OM, CP, EE, and GE, increased curvilinearly with increasing concentrate offered (Table 3);
however there were no significant differences between
the T3 and T4 treatments (Table 4). The ANOVA
Quang et al. Journal of Animal Science and Technology (2015) 57:35
Page 4 of 8
Table 2 Summary statistics of feed intake, liveweight, average daily gain and organic matter digestibility by treatment group
Treatment
0
0.6
1.2
1.8
2.4
Mean ± SD Range
Mean ± SD Range
Mean ± SD Range
Mean ± SD Range
Mean ± SD Range
Feed Intake (kg
DM/d)
4.06 ± 0.70
3.23 - 4.92
5.36 ± 0.71
4.74 - 6.38
6.24 ± 1.3
4.87 - 7.45
6.49 ± 0.89
5.24 - 7.32
6.54 ± 1.8
4.42 - 8.14
Initial liveweight
(kg)
179 ± 38
133 - 225
181 ± 42
130 - 233
184 ± 35
149 - 221
179 ± 35
135 - 221
183 ± 54
117 - 235
Final liveweight
(kg)
207 ± 34
167 - 249
255 ± 36
228 - 307
267 ± 50
222 - 327
265 ± 43
219 - 323
279 ± 76
191 - 347
Liveweight gain
(kg/d)
0.091 ±
0.081
0.018 0.202
0.585 ±
0.095
0.470 0.702
0.792 ±
0.125
0.679 0.917
0.836 ±
0.095
0.714 –
0.940
0.943 ±
0.169
0.750 1.107
51.0 - 60.0
60.6 ± 2.1
57.7 - 62.7
62.8 ± 3.8
57.6 - 66.1
66.9 ± 2.3
64.5 - 70.0
75.1 ± 2.4
72.8 - 78.3
OM Digestibility (%) 54.3 ± 4.1
Table 3 Regression equations to estimate intake, digestibility, faecal N, and liveweight
Regression equation 1,2
r2
Sig. of regression
Y = −2.39 + 0.0117(I) + 2.68(C) - 0.348(C2)
0.97
<0.0001
Intake
Concentrate intake (kg DM/d)
Guinea grass intake (kg DM/d)
Y = 0.701 + 0.00782(I) - 0.321(C)
0.69
0.0002
Rice straw intake (kg DM/d)
Y = 0.747 + 0.00539(I) - 0.00808(C) - 0.209(C2)
0.93
<0.0001
Substitution rate (kg DM/kg DM)
Y = 1.16 - 0.00589(I) + 0.215(C)
0.85
<0.0001
3
OM intake (kg/day)
Y = −0.996 + 0.0227(I) + 2.30(C) - 0.535(C2)
0.95
<0.0001
4
GE intake (MJ/d)
Y = −18.9 + 0.438(I) + 43.8(C) - 10.1(C2)
0.94
<0.0001
5
CP intake (kg/d)
Y = −0.278 + 0.00307(I) + 0.407(C) - 0.0693(C2)
0.97
<0.0001
6
EE intake (kg/d)
Y = −0.114 + 0.000818(I) + 0.144(C) - 0.0221(C )
0.97
<0.0001
7
NDF intake (kg/d)
Y = 1.27 + 0.00886(I) - 0.240(C)
0.48
0.0036
OM digestibility (%)
Y = 54.4 + 8.00(C)
0.84
<0.0001
2
Digestibility period
Digestible OM intake (kg/d)
Y = −0.149 + 0.0106(I) 0.971(C)
0.88
<0.0001
Gross energy digestibility (%)
Y = 75.0 + 13.6(C) - 4.36(C2)
0.43
0.0086
Digestible energy intake (MJ/d)
Y = −7.39 + 0.311(I) + 38.5(C) - 8.75(C )
0.89
<0.0001
CP digestibility (%)
Y = 56.9 + 6.09(C)
0.63
<0.0001
EE digestibility (%)
Y = 9.28 + 0.0884(I) + 38.8(C) - 7.62(C2)
0.93
<0.0001
NDF digestibility (%)
Y = 59.8 - 8.06(C)
0.63
<0.0001
Faecal N (kg/d)
Y = −0.00168 + 0.000129(I) + 0.0203(C) - 0.00589(C )
0.89
<0.0001
2
2
Liveweight
Initial liveweight (kg)
n.a.
n.a.
0.9905
Final liveweight (kg)
Y = −13.7 + 1.12(I) + 64.9(C) - 15.6(C2)
0.97
<0.0001
Liveweight gain (kg/d)
Y = −163 + 1.43(I) + 773(C) - 185(C2)
0.90
<0.0001
1
I: Initial body weight (kg)
2
C: Amount of concentrate offered (% of liveweight)
3
OM: Organic matter
4
GE: Gross energy
5
CP: Crude protein
6
EE: Ether extract
7
NDF: Neutral detergent fibre
Quang et al. Journal of Animal Science and Technology (2015) 57:35
Page 5 of 8
Table 4 Least squares means, for the effect of different amounts of a concentrate mix on intake, digestibility, faecal N, and
liveweight
Concentrate Treatment (% of liveweight)
0
0.6
1.2
1.8
2.4
SE
Pr > F
Intake
0.00
a
2.19
a
Rice straw intake (kg DM/d)
1.83
a
Substitution rate (kg DM/kg DM)
n.a.
Concentrate intake (kg DM/d)
Guinea grass intake (kg DM/d)
1.27
b
2.17
a
2.66
c
1.94
ab
3.78
d
4.29
d
0.22
<0.0001
1.56
b
1.53
b
0.22
1.72
a
0.0198
1.56
a
1.11
b
0.61
c
0.10
a
0.11
<0.0001
0.25
ab
0.37
bc
0.49
c
0.10
0.0143
4.63
b
5.59
c
5.93
c
5.96
c
0.25
<0.0001
89.7
b
108.0
c
114.5
c
115.3
c
4.9
<0.0001
0.732
c
0.850
d
0.910
d
0.037
<0.0001
0.192
c
0.244
d
0.266
d
0.011
<0.0001
2.38
a
2.56
a
0.33
0.2994
66.9
c
75.1
d
2.2
<0.0001
3.69
cd
4.25
d
0.27
<0.0001
83.2
ab
3.1
0.0171
97.2
c
5.3
<0.0001
1
OM intake (kg/day)
3.57
a
2
GE intake (MJ/d)
69.3
a
0.540
b
0.121
b
2.86
a
62.8
bc
3.27
c
83.3
ab
93.3
c
73.03
c
3.1
0.0019
76.7
a
3.9
<0.0001
3
CP intake (kg/d)
0.343
a
4
EE intake (kg/d)
0.053
a
2.97
a
3.01
a
54.3
a
60.7
b
1.89
a
2.58
b
Gross energy digestibility (%)
75.3
c
80.0
bc
87.8
a
Digestible energy intake (MJ/d)
55.7
a
71.2
b
92.7
c
CP digestibility (%)
57.04
ab
62.1
ab
62.36
ab
66.6
bc
EE digestibility (%)
25.5
d
51.4
c
59.7
b
71.8
a
NDF digestibility (%)
59.7
a
57.4
a
48.6
b
41.9
b
43.1
b
4.0
0.0012
Faecal N (kg/d)
0.025
a
0.0321
b
0.0413
c
0.0422
c
0.0386
c
0.0022
<0.0001
199
a
206
a
200
a
195
a
200
a
31.4
0.9983
Final liveweight (kg)
208
a
248
b
266
bc
271
c
279
c
6.2
<0.0001
Liveweight gain (kg/d)
0.092
a
0.577
b
0.792
c
0.843
c
0.943
c
0.074
<0.0001
5
NDF intake (kg/d)
Digestibility period
OM digestibility (%)
Digestible OM intake (kg/d)
Liveweight
Initial liveweight (kg)
a-d
In each row, least squares means followed without a common superscript are significantly different (P < 0.05) according to Fisher’s LSD
OM: Organic matter
GE: Gross energy
3
CP: Crude protein
4
EE: Ether extract
5
NDF: Neutral detergent fibre
1
2
analysis indicates no significant effect of treatments on
NDF intake (Table 4); however the regression analysis
indicates a linear decline in NDF intake as the amount
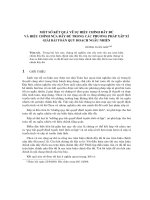
of concentrate consumed increased (Table 3). These results are reflected in Fig. 2 which shows concentrate
consumed plotted against NDF, CP, and OM intake.
Over the experimental range, as the level of concentrate
intake increased, the OM, and CP intakes increased,
however the NDF intake decreased.
The effect of concentrate intake on liveweight gain
Fig. 1 Effects of amount of concentrate consumed on total dry
matter intake, rice straw intake, and Guinea grass intake. Values
are averages of intakes (n = 4) measured across the whole
experimental period
The mean weight gain of bulls ranged from 0.09 kg/d
(T0) to 0.94 kg/d (T4) (Table 4). The concentrate treatments had a significant (p < 0.0001) effect on LWG
(Table 3). There were significant differences in LWG between T0 to T1 to T2, but no difference in LWG between T2, T3 and T4 (Table 4). These results are
Quang et al. Journal of Animal Science and Technology (2015) 57:35
Fig. 2 Effects of amount of concentrate consumed on organic
matter intake, NDF intake, and CP intake. Values are averages of
intakes (n = 4) measured across the whole experimental period
reflected in Fig. 3, which shows a curvilinear relationship
with LWG increasing as concentrate intake increases,
but at a declining rate of increase.
The effect of concentrate intake on digestibility
The digestibilities of dry matter, organic matter, crude protein, and crude fat increased with increasing concentrate
level offered; however NDF digestibility decreased (Table 3).
The faecal nitrogen content significantly (P < 0.0001)
increased up until 1.2 % of LW, after which there was no
increase with increasing amount of concentrate offered
(Table 4).
Discussion
The results support the hypothesis that total dry matter
and organic matter intakes would increase in a curvilinear response as the amount of the formulated concentrate offered increased up to 2.4 % LW. There was
no significant difference in concentrate intake between
treatments containing concentrate levels of 1.8 and
2.4 % LW. Roughage intake declined with increasing
intake of concentrate. This result is consistent with
previously published reports where supplements have
been fed to provide energy and/or protein to cattle
consuming low quality forages [9, 13, 14]. Intake of rice
straw or basal forage diets declines as the amount of
concentrate containing cassava powder consumed increases [2, 15, 16]. If the amount of fermentable carbohydrate in cattle diet is higher than 15 % of total dry
matter intake, roughage intake decreases [17].
There are many factors that affect the total dry matter and roughage intakes in ruminants, including diet
quality and feeding management. In our study, there
was no increase in Guinea grass intake at the lowest
level of concentrate supplementation, because all of the
offered grass was consumed. The positive effects of small
amounts of supplement on intake of low and medium
quality forages have been reported elsewhere [14, 18, 19].
Page 6 of 8
However, with increasing concentrate, substitution invariably occurs [20] and increases as the amount of concentrate consumed increases [2].
The decline in NDF digestibility with increasing concentrate consumption is consistent with reports by Ba et
al. [2, 3] and Dung et al. [21]. There is evidence to suggest that the digestibility of NDF in mature forages may
be depressed more than that of fresh herbages when the
rumen environment is altered by feeding concentrates
[22, 23]. Dixon and Stockdale [24] suggest that reduced
NDF digestion is a primary cause of substitution. Many
studies have concluded that increased concentrate intake
contributes to a reduction of rumen pH and cellulolytic
bacterial activity, which decreases the digestion of fibre
[25–27]. It was not feasible to estimate the digestibility
of different dietary ingredients in this experiment. However, if the digestibility of concentrate NDF remained
constant across T1 to T4, then the digestibility of
Guinea grass and/or rice straw NDF must have declined
markedly as the amount of concentrate consumed increased. This indicates that the amount of metabolisable
energy derived from Guinea grass and rice straw declined due to substitution and negative associative effects on their NDF digestibility as the amount of
concentrate consumed increased.
The present results support the hypothesis that LWG
increases curvilinearly with increasing amounts of concentrate, and that a maximum level of LWG is reached.
This relationship is described by the following equation:
À Á
LW gain ðkg=day Þ ¼ 163 þ 1:43ðIÞ þ 773ðCÞ −185 C2
À
R2 ¼ 0:90; p < 0:0001
Á
where I indicates the initial body weight (kg) and C indicates the level of concentrate treatment (% of LW). The
equation does not indicate the optimum economic level
Fig. 3 Effects of amount of concentrate consumed on liveweight gain
of cattle fed a basal diet of Guinea grass and rice straw, measured
across the whole experimental period. Values are for individual bulls
Quang et al. Journal of Animal Science and Technology (2015) 57:35
of supplementation, which needs to also take into account purchased input prices and selling price.
The improved LWG for these experiments is likely due
to the increased DM intake, OM intake and OM digestibility resulting from increased intake of concentrate. The
results are similar to those of previous experiments. A
number of studies reported that LWG increased linearly
as the concentrate intake increased [2, 21, 28, 29]. We
purposefully included high amounts of concentrate supplementation to show that the linear relationship would
not hold across a wide range in amounts of supplement
offered or consumed and that there are diminishing responses at high amounts of supplementation. This has important consequences in terms of the profit derived from
supplementary feeding.
Conclusions
This experiment examined the effects of supplementing
young Vietnamese Brahman-cross growing cattle with a
concentrate mix based on ingredients locally available in
Central Vietnam. Liveweight gain increased with increasing the level of supplementation up to 1.2 % of LW; however there was minimal change in LW with increasing
amounts of supplementation beyond 1.2 %. An equation
for estimating LWG based on the amount of supplementation was developed, and could be used for determining
the optimal supplementation strategy if combined with
information on input costs and cattle sale prices.
Abbreviations
CP: Crude protein; DM: Dry matter; EE: Ether extract; GE: Gross energy;
LW: Liveweight; LWG: Liveweight gain; NDF: Neutral detergent fibre;
N: Nitrogen; OM: Organic matter.
Competing interests
The authors declare that they have no financial or non-financial competing
interests.
Authors’ contributions
DVQ, NXB, PD, AM, NHV and DP participated in the design of the study. DVH
and DVQ were responsible for the daily running of the experiment. DP
performed the statistical analysis and prepared the manuscript. DVQ, NXB,
PD, AM and DP helped to draft the manuscript. All authors read and
approved the final manuscript.
Acknowledgments
We would like to thank the staff and students who were involved in this
study, including Phí Như Liễu, Nguyên Van Tiến, Do Thi Lan Anh, and
Nguyen Thanh Thuy. The study was funded by the Australian Centre for
International Agricultural Research (ACIAR).
Author details
1
Institute of Animal Science Southern Vietnam, Ho Chi Minh, Vietnam.
2
Faculty of Animal Sciences, Hue University of Agriculture and Forestry, Hue
City, Vietnam. 3Peter Doyle Consulting, 4 Red Bean Close, Byron Bay, NSW
2481, Australia. 4Tasmanian Institute of Agriculture and School of Land and
Food, University of Tasmania, Sandy Bay 7001, Australia.
Received: 26 November 2014 Accepted: 18 September 2015
Page 7 of 8
References
1. Dung DV, Mui NT, Ba NX, Van NH, Smith RDP, Corfield JP. Reproductive
constraints to improved productivity of smallholder cow-calf systems in
South Central Coast Vietnam – insights from recent surveys. In: Yuangklang
C, editor. The 5th International Conference on Sustainable Animal
Agricultural for Developing Countries 26–30 October 2015. Pattaya,
Thailand: SAADC Conference; 2015.
2. Ba NX, Van NH, Ngoan LD, Leddin CM, Doyle PT. Effects of Amount of
Concentrate Supplement on Forage Intake, Diet Digestibility and Live
Weight Gain in Yellow Cattle in Vietnam. Asian Australas J Anim Sci.
2008;21:1736–44.
3. Ba NX, Van NH, Ngoan LD, Leddin CM, Doyle PT. Amount of cassava
powder fed as a supplement affects feed intake and live weight gain in
laisind cattle in Vietnam. Asian Australas J Anim Sci. 2008;21:1143–50.
4. Parsons D, Lane PA, Ngoan LD, Ba NX, Tuan DT, Van NH, Dung DV, Phung LD:
Systems of cattle production in South Central Coastal Vietnam. Livestock Res
Rural Dev 2013, 25. />5. Doyle PT, Devendra C, Pearce GR. Rice Straw as a Feed for Ruminants.
Canberra: International Development Programme of Australian Universities
and Colleges; 1986.
6. Wilson JR, Minson DJ. Prospects for improving the digestibility and intake of
tropical grasses. Trop Grassl. 1980;14:253–9.
7. Ba NX, Van NH, Scandrett S, Vy LV, Tung HV, Nghi NT, Tuan DT, Lane PA,
Parsons D: Improved forage varieties for smallholder cattle farmers in South
Central Coastal Vietnam. Livestock Research for Rural Development 2014, 26.
ISSN 0121-3784 (2014)
8. Doyle PT, Stockdale CR, Ba NX, Van NH, Ngoan LD. Understanding interactions
between forages and concentrates is important for formulating feeding
strategies for growing cattle in central Vietnam. Aust J Exp Agric. 2008;48:821–4.
9. Hennessy DW, Murison RD. Cottonseed meal and molasses as sources of
protein and energy for cattle offered low quality hay from pastures of the
north coast of New South Wales. Aust J Exp Agric. 1982;22:140–6.
10. AOAC International. Official Methods of Analysis of AOAC International. 19th
ed. Gaithersburg, MD, USA: AOAC International; 2012.
11. Van Soest PJ, Robertson JB, Lewis BA. Methods for dietary fiber, neutral
detergent fiber, and nonstarch polysaccharides in relation to animal
nutrition. J Dairy Sci. 1991;74:3583–97.
12. SAS Institute. The SAS System for Windows v.9.1. Cary NC: SAS Institute; 2003.
13. Hennessy DW, Kohun PJ, Williamson PJ, Brown DA, Nolan JV. The effect of
nitrogen and protein supplementation on feed-intake, growth and digestive
function of steers with different bos-indicus, bos-taurus genotypes when fed a
low-quality grass hay. Aust J Agric Res. 1995;46:1121–36.
14. Lee GJ, Hennessy DW, Nolan JV, Leng RA. Responses to nitrogen and maize
supplements by young cattle offered a low-quality pasture hay. Aust J Agric
Res. 1987;38:195–207.
15. Van NH, Ba NX, Dung DV, Phung LD, Ngoan LD, Cuong VC. Effects of
concentrate levels on feed intake, nutrient digestibility, nitrogen balance and
rumen characteristics Vietnamese yellow cattle. J Agric Rural Dev Viet Nam.
2012;3:46–53.
16. Wanapat M, Khampa S. Effect of levels of supplementation of concentrate
containing high levels of cassava chip on rumen ecology, microbial N
supply and digestibility of nutrients in beef cattle. Asian Australas J Anim
Sci. 2007;20:75–81.
17. Trach NX. Utilisation of Crop Residue for Ruminants. Hanoi: Agricultural
Publishing House; 2004.
18. Cohen RDH. Effect of molasses–urea supplements on digestibility of mature
carpet grass (Axonopusaffinis) and liveweight change of beef steers. Aust J
Expt Agric Anim Husb. 1974;14:589–92.
19. Ernst AJ, Limpus JF, O’Rourke PK. Effect of supplements of molasses and urea
on intake and digestibility of native pasture hay be steers. Aust J Expt Agric
Anim Husb. 1975;15:451–5.
20. Doyle PT. Supplements other than forages. In: Hacker JB, Ternouth JH, editors.
The Nutrition of Herbivores. Sydney: Academic Press; 1987. p. 429–64.
21. Dung DV, Ba NX, Van NH, Phung LD, Ngoan LD, Cuong VC, et al. Practice on
improving fattening local cattle production in Vietnam by increasing crude
protein level in concentrate and concentrate level. Trop Anim Health Prod.
2013;45:1619–26.
22. Huhtanen P. Associative effects of feeds in ruminants. Nor J Agric Sci.
1991;5:37–57.
23. Mould FL, Orskov ER, Mann SO. Associative effects of mixed feeds. 1. Effects of
type and level of supplementation and the influence of the rumen fluid ph on
Quang et al. Journal of Animal Science and Technology (2015) 57:35
24.
25.
26.
27.
28.
29.
Page 8 of 8
cellulolysis invivo and dry-matter digestion of various roughages. Anim Feed
Sci Technol. 1983;10:15–30.
Dixon RM, Stockdale CR. Associative effects between forages and grains:
consequences for feed utilisation. Aust J Agric Res. 1999;50:757–73.
Agle M, Hristov AN, Zaman S, Schneider C, Ndegwa PM, Vaddella VK. Effect
of dietary concentrate on rumen fermentation, digestibility, and nitrogen
losses in dairy cows. J Dairy Sci. 2010;93:4211–22.
Moorby JM, Dewhurst RJ, Evans RT, Danelon JL. Effects of dairy cow diet
forage proportion on duodenal nutrient supply and urinary purine
derivative excretion. J Dairy Sci. 2006;89:3552–62.
Plaizier JC, Krause DO, Gozho GN, McBride BW. Subacuteruminal acidosis in
dairy cows, the physiological causes, incidence and consequences. Vet J.
2009;176:21–31.
Manni K, Rinne M, Huhtanen P. Comparison of concentrate feeding
strategies for growing dairy bulls. Livest Sci. 2013;152:21–30.
Paeng-Koum P, Tatsapong P. Effect of different levels of protein on feed
intake, digestibility and growth rate of Thai native beef fed pangola grass as
roughages. In: Oshio S, Otsuka M, Sommart K, editors. Establishment of a
Feeding Standard of Beef Cattle and a Feed Database for the Indochinese
Peninsula. Tsukuba, Ibaraki, Japan: JIRCAS; 2009. p. 76–8.
Submit your next manuscript to BioMed Central
and take full advantage of:
• Convenient online submission
• Thorough peer review
• No space constraints or color figure charges
• Immediate publication on acceptance
• Inclusion in PubMed, CAS, Scopus and Google Scholar
• Research which is freely available for redistribution
Submit your manuscript at
www.biomedcentral.com/submit
J Indian Acad Wood Sci (June 2013) 10(1):26–31
DOI 10.1007/s13196-013-0089-4
ORIGINAL ARTICLE
Kiln drying for bamboo culm parts of the species Bambusa
stenostachya, Dendrocalamus asper and Thyrsostachys siamensis
Thi Kim Hong Tang • Johannes Welling • Walter Liese
Received: 22 January 2013 / Accepted: 1 April 2013 / Published online: 9 April 2013
Ó Indian Academy of Wood Science 2013
Abstract In South Vietnam Bambusa stenostachya,
Dendrocalamus asper and Thyrsostachys siamensis are the
major commercial species. Their culms are used for housing and for manufacturing of furniture to export. Our previous study resulted that the kiln drying of 1.4 m culm parts
of the bamboos can be conducted successfully using proper
schedules defining temperature and relative humidity. In
this paper, the effective schedules were further investigated
for longer culm parts treated with boron. Culm parts with
2.0 and 2.2 m length after pressure treatment were dried in
industrial kilns using three schedules with mild, severe and
highly severe drying intensity. The moisture loss, drying
time and drying defects were determined. The species
T. siamensis is the easiest to dry. It takes 8 days for culm
parts to reach 10 % starting from an initial moisture content
above 120 % with a highly severe drying schedule.
B. stenostachya dries moderately fast in 10 days using a
severe drying schedule. D. asper is the most difficult species to dry and requires a mild schedule. It is prone to
checking and splitting and needs 13 days of drying.
T. K. H. Tang Á W. Liese (&)
Department of Wood Science, University Hamburg,
Leuschnerstr. 91, 21031 Hamburg, Germany
e-mail:
T. K. H. Tang
e-mail:
T. K. H. Tang
Faculty of Forestry, Nong Lam University of HCM, Linh Trung,
Thu Duc-District, Ho Chi Minh City, Vietnam
e-mail:
J. Welling
Thu¨nen Institute of Wood Research, Leuschnerstr. 91,
21031 Hamburg, Germany
e-mail:
123
Keywords Kiln drying Á Bambusa stenostachya Á
Dendrocalamus asper Á Thyrsostachys siamensis
Introduction
Drying is an important stage of the manufacturing process
of bamboo products. Well-dried culms have the desired
appearance, finish and structural properties to meet the
requirements for the successful export into demanding
markets. The drying of bamboo occurs mainly as culm
parts. They are round, separated by nodes and inside
mostly hollow, called lacuna. At their ends, the metaxylem
vessels are the main pathways for releasing moisture. In
bamboo the radial passage of moisture is slower than for
wood because no ray cells exist (Liese 1998). Generally,
the anatomical structure of the bamboo culm makes drying
as well as treatment with preservatives more difficult than
for wood (Laxamana 1985; Kumar et al. 1994; Liese and
Kumar 2003).
Commonly, air-drying has been used since long in rural
areas and in small bamboo factories. It has some disadvantages, like long drying time, depending largely on climatic conditions and danger of infection by fungi and
beetles. Kiln drying provides a technique for overcoming
such limitations. Specially, for large-scale operations kiln
drying is more efficient than air-drying and can ensure high
quality and continuous supply. With the increasing export
of bamboo products, the manufacturers need to expand kiln
drying. However, considerable problems exist with drying
for the main Vietnamese bamboo species, as no adequate
research is available.
So far a few investigations on drying bamboo have been
done. Rehman and Ishaq (1947) studied air seasoning of
the species Dendrocalamus strictus, Bambusa arundinacea,
J Indian Acad Wood Sci (June 2013) 10(1):26–31
27
B. butans and B. tulda. A comprehensive investigation on air
drying and kiln drying culm parts of several species was done
by Glenn et al. (1954), giving a classification of the drying
rate into three categories: high, intermediate and low. Laxamana (1985) researched culm parts and splits of Bambusa
vulgaris, Dendrocalamus merillanus, Phyllostachys nigra
and Schizostachyum diffusum by air drying and kiln drying
and reported that the drying rate is influenced by species as
well as the drying condition. Wu (1992) explored hightemperature drying round bamboo of Phyllostachys makinoi.
Montoya Arango (2006) studied drying round and split
bamboo of Guadua angustifolia by air-drying, solar drying
and kiln drying. In Vietnam, only Pham (2006) investigated
kiln drying for Bambusa procera and provided some kiln
drying schedules for culm parts and splits.
As not much literature is available on drying round
bamboo in Vietnam, investigations on the kiln drying of
the important commercial species Bambusa stenostachya,
Dendrocalamus asper and Thyrsostachys siamensis were
done. The three bamboos are distributed in natural stands
of South Vietnam, widely planted throughout the country
and sufficiently available. Their culms are principally used
for constructions and manufacturing of furniture, mainly
for export. The previous study on culm parts with
1.4 m length of these species has shown that kiln drying
can be conducted successfully with proper drying schedules defining temperature and relative humidity (Tang et al.
2012). In this paper, the drying behaviour of longer culm
parts treated with boron was investigated in industrial dry
kilns.
Materials and methods
The study was carried out at the factory of the Bamboo
Nature Company, Binh Duong province, South Vietnam,
from June to October 2009 and from December 2010 to
January 2011 in close cooperation with the first author.
Bamboo Nature Company. The skin was removed by
machine sanding, which is a common process in bamboo
furniture production in Vietnam. Table 1 contains diameter, wall thickness and internode length of the culm parts
used for the investigation.
Dry-kiln
The experiments were done in dry kilns of 5.2 m length,
2.7 m height and 3.2 m width. Its heating system was
capable of maintaining temperatures up to 80 °C by steam
heated coils located vertically near the kiln roof. The relative humidity was adjusted by hot water spraying and
venting. The air circulation system consisted of four fans
with 60 cm diameter and was reversed every 6 h. The air
velocity was maintained at a constant speed of 3.8 m/s. The
kiln was operated by an automatic-controller, ensuring the
drying schedule by adjusting temperature and relative
humidity.
Kiln drying
Culm parts, after boron pressure treatment (Tang and Liese
2011), were stacked with 1.5 cm distance on a kiln car.
Each kiln load comprised six cars with one species. To
estimate moisture loss, five control samples with their ends
sealed with PVA-glue were distributed in two cars nearby
the kiln doors. Since these control samples with only
1.6 m length were shorter than the culm parts in the kiln
load, this sealing should lead to a similar drying behaviour
as in the long culm parts.
During the drying process, the conditions in the kiln
were adapted to predefined set-point values. These values
were adjusted according to the average moisture content
development determined by means of the control samples
at various times during the run. To compute the moisture
loss, the controls were weighed daily.
Drying schedules
Bamboo materials
From the bottom of a culm, parts of 2.0 and 2.2 m length
were taken as they are mainly used for products in the
The schedules from the previous experiments (Tang et al.
2012) were applied with three drying intensities: mild,
severe and highly severe (Table 2). For each species, two
Table 1 The dimensions of the culm parts tested
Species
Average diameter at the ends (mm)
Average wall thickness at the ends (mm)
Average internode length (cm)
Lower
Upper
Lower
Lower
T. siamensis
42
35
solid
12
16
28
B. stenostachya
78
74
13
10
25
30
D. asper
82
80
14
12
35
40
Upper
Upper
123
28
J Indian Acad Wood Sci (June 2013) 10(1):26–31
Table 2 The conditions (set-point values) of the three drying schedules
Step
Moisture content (%)
Schedule no.1 mild
No. 2 severe
No. 3 highly severe
T (°C)
RH (%)
T (°C)
RH (%)
T (°C)
RH (%)
1
Over 90
50
80
55
80
65
80
2
90–70
50
70
55
75
65
60
3
70–50
60
60
60
65
70
45
4
50–40
60
50
65
50
70
35
5
40–30
60
30
65
35
70
30
6
30–20
65
30
70
25
75
25
70
20
75
15
7
20–10
65
20
Conditioning with 50 °C temperature and 70 % relative humidity
schedules were tested: schedule no. 1 with mild drying
severity for B. stenostachya and D. asper, schedule no. 2
with severe drying conditions for all three species and
schedule no. 3 with highly severe drying conditions only
for T. siamensis.
Moisture content
The moisture content (MC) was determined by oven drying
and calculated as:
MCð% Þ ¼
Wor À Wo
 100
Wo
with Wor as original weight of samples and Wo as oven dry
weight.
For determination of the average initial moisture content, sections of 10 cm length were cut from both ends of
the samples. Five control samples and twenty five further
culm parts of each kiln charge were used.
To evaluate the final moisture content and the moisture
gradient, sections of 10 cm were taken from both ends and
from the middle of 54 culm parts for each kiln charge. The
moisture gradient of each culm part (DMC) was determined with the following formulae:
DMC ¼ MCm À
Results and discussion
Drying rate and drying time
Describing the functional relation of moisture loss over
drying time resulted in high coefficients (R2 [ 98 %) using
regression analysis as shown in Figs. 1, 2 and 3.
The drying rate revealed notable differences between the
three species (Fig. 4) as also demonstrated in the previous
experiments with shorter culm parts (Tang et al. 2012). The
bamboo T. siamensis dried fastest, followed by B. stenostachya and D. asper. This can be explained by the differences in specific gravity and structural features. The
oven-dried density of T. siamensis ranges from 0.41 to
0.46 g/cm3, whereas B. stenostachya shows a density
between 0.65 and 0.72 g/cm3 and D. asper between 0.71
and 0.78 g/cm3 (Hoang and Tang 2007). Moreover, T.
siamensis has the shortest internode length (Table 1). The
study on bamboo seasoning by Glenn et al. (1954) and
Laxamana (1985) concluded for bamboo species with a
MCe1 þ MCe2
2
with MCm and MCe1 MCe2 as moisture content of the
sections at the middle and the ends of the culm part.
The drying rate was determined by the relationship
between moisture decrease and drying time.
Drying defects
All culm parts were visually inspected for defects, like
collapse, cracking and splitting. Drying defects were
expressed as percentage of all culm parts in each kiln
charge.
123
Fig. 1 Relationship between drying time and moisture content of
B. stenostachya
J Indian Acad Wood Sci (June 2013) 10(1):26–31
Fig. 2 Relationship between drying time and moisture content of D.
asper
29
Fig. 4 Drying rate of the three bamboos by the schedule 2
Final moisture content
Fig. 3 Relationship between drying time and moisture content of T.
siamensis
lower specific gravity and shorter internodes a faster drying
rate.
With the mild schedule no. 1, the drying time of B.
stenostachya accounted to 303 h for reducing the initial
MC from 125 to 9 %. Bamboo D. asper dried in 327 h with
a reduction of MC from 120 to 10 %. Schedule no. 1 was
not applied for T. siamensis as the previous experiments
had shown that this species can be safely dried using a
more severe drying intensity (Tang et al. 2012).
By applying the severe schedule no. 2, the drying time
for B. stenostachya was reduced to 254 h and for D. asper
to 279 h, but for T. siamensis 236 h.
The highly severe schedule no. 3 was only used for T.
siamensis resulting in a drying time of 198 h. This schedule
was not applied for B. stenostachya and for D. asper due to
severe defects experienced when applying highly severe
drying for shorter culm parts (Tang et al. 2012).
Table 3 presents the average final moisture content of the
three species.
In a large industrial kiln, a variation in final moisture
content often exists between culm parts of each drying
charge, which can negatively affect the later processing. To
reduce such variation, a conditioning period of 12 h was
applied for B. stenostachya and D. asper, but only 5 h for
T. siamensis.
Comparing the results to the timber drying quality
requirements defined in EN 14298 (2004), the final moisture content meets this standard at a target moisture content
of 10 % with the schedules no. 1 and 2 for the three
bamboos and a target of 7 % with the schedule no. 3 for T.
siamensis.
Ideally, the moisture distribution within a kiln-dried
culm part should be uniform. However, in practice moisture gradients develop by the faster moisture evaporation
from the ends and culm surface compared to the diffusion
rate from the middle section towards the ends and from the
inner culm towards its surface. Results in Table 3 showed
that the moisture at the middle section was slightly higher
than at the ends. The average moisture gradient for the
different kiln runs ranged from 1.0 to 1.3 % with a standard
deviation 0.2 to 0.4.
Drying defects
The influence of the drying intensities from mild to severe
for defects is shown in Fig. 5. The species T. siamensis is
less susceptible than B. stenostachya and D. asper.
With the schedule no. 1 B. stenostachya showed 5 %
defects and D. asper 8 %, mostly as light splits.
123
30
J Indian Acad Wood Sci (June 2013) 10(1):26–31
Table 3 The average initial moisture content with samples n = 30 and the average final moisture content with n = 54 of the three bamboos
Species
Schedule
Moisture content (%)
Initial
Final
SD
Mean
1
125
6.7
10.1
1.1
7.2
11.4
1.1
0.3
2
119
7.4
9.6
0.8
6.7
10.5
1.0
0.2
D. asper
1
2
124
118
7.2
8.9
10.2
9.3
1.0
1.4
8.1
7.6
11.7
12.1
1.2
1.3
0.3
0.4
T. siamensis
2
120
7.8
9.8
1.3
7.4
10.9
1.1
0.2
3
127
5.8
6.9
1.2
5.1
8.9
1.3
0.3
B. stenostachya
SD
Min
Max
DMC
Mean
SD
SD standard deviation, DMC gradient of moisture content
Conclusions
Fig. 5 Drying defects of the three bamboos
While applying the schedule no. 2 for D. asper, 21 % of
the culm parts exhibited defects, but for B. stenostachya
only 7 % and for T. siamensis 5 %. The bamboo D. asper
was liable to splits, end checks and node checks.
Using the schedule no. 3 for T. siamensis 6.5 % of the
culm parts showed mostly end checks at the internal layer.
Comparison of the drying results of the boron treated
culm parts and the untreated ones from the previous
experiments revealed that the formers had less splits.
Similarly, Sharma et al. (1972) recommended a chemical
pre-treatment of round bamboo to prevent the occurrence
of splitting. These observations need further studies.
In drying bamboo, discolourating fungi can grow at high
moisture content in kilns operating at low temperature and
high humidity. As being shown in the previous experiments
(Tang et al. 2012), the application of a low temperature
schedule of 40 °C and a relative humidity of 85 % during
the initial stage of drying led to mould development on
culm parts of D. asper. Mould was prevented by an initial
phase with 80 °C and a relative humidity of 90 % for 2 h.
123
Kiln drying of bamboo culm parts treated with boron can
be applied successfully using suitable schedules of temperature and relative humidity. All drying schedules
investigated for the three species meet the specification for
the final moisture content in EN 14298 (2004). Considering
practical points for reducing seasoning time and defects,
the following drying schedules are recommended:
Bambusa stenostachya dried moderately fast using a
severe schedule with an initial temperature of 55 °C and
RH of 80 % and a final temperature of 70 °C and 20 % RH
for 10 days.
Dendrocalamus asper is a difficult species to dry and
susceptible to drying defects. It therefore needs a mild
schedule with initial temperature of 50 °C and RH of 80 %
and a final temperature of 65 °C and RH of 20 % for
13 days.
Thyrsostachys siamensis is easy to dry applying a highly
severe drying schedule with temperature of 65 °C at initial
stage and relative humidity of 80 % and towards the end
with 75 °C and 15 % RH for 8 days.
As a consequence of the results achieved by this
study, South Vietnamese bamboo processing companies
with kiln drying facilities, like Bamboo Nature Company
and Bamboo Villages Co., have already applied these
effective schedules for drying boron treated culm parts.
The drying schedules should be further investigated for
bamboo treated with CCB as well as other commercial
species, such as Bambusa vulgaris and Dendrocalamus
barbatus.
Acknowledgments We would like to thank the Bamboo Nature
Company and its staff, Binh Duong Province, Vietnam, for caring out
the experiments. We also thank for the assistance of Ms. Ho Thuy
Dung, at the Centre of Research and Transfer of Technology for
Forest Products Processing, Nong Lam University of Ho Chi Minh
City, Vietnam.
J Indian Acad Wood Sci (June 2013) 10(1):26–31
References
EN 14298 (2004) Sawn timber-assessment of drying quality. European Committee for Standardization, p 1–8
Glenn HE, Brock DC, Byars EF et al (1954) Seasoning, preservative
treatment and physical property studies of bamboo. Clemson,
South Carolina Bulletin No.7, p 27–36
Hoang TTH, Tang TKH (2007) Structural features and physical
properties of some important South Vietnam bamboo species.
J Agric For Sci Technol Nong Lam Univ of HCM 3:15–22
Kumar S, Shukla KS, Dev I, Dobriyal PB (1994) Bamboo preservation techniques: a review. International Network for Bamboo and
Rattan (INBAR) and Indian Council of Forestry Research
Education (ICFRE), p 18–19
Laxamana MG (1985) Drying of some commercial Philippine
bamboos. J For Prod Res Dev Instit Philipp FPRDI 14(1 &
2):8–19
Liese W (1998) The anatomy of bamboo culms. INBAR Tech Rep
18:152–161
Liese W, Kumar S (2003) Bamboo preservation compendium.
INBAR Tech Rep 22:82–87
31
Montoya Arango JA (2006) Trocknungsverfahren fu¨r die Bambusart
Guadua angustifolia unter tropischen Bedingungen. Dissertation
University Hamburg
Pham NN (2006) Establishing process of kiln drying for the bamboo Lo
o and the rattan Song may. Department of Science and Technology of Ho Chi Minh-City, Vietnam, Research Report, No. 11
Rehman MA, Ishaq SM (1947) Seasoning and shrinkage of bamboo.
For Res Inst Dehra Dun India 4(2):1–20
Sharma SG, Tewari MC, Sharsa RD (1972) Chemical seasoning of
bamboo in the round for handicrafts. J Timber Dev Assoc India
13(1):17–23
Tang TKH, Liese W (2011) Pressure treatment of the Vietnamese
common bamboos with boron and CCB. J Bamboo Rattan
10(1&2):1–12
Tang TKH, Welling J, Ho TD, Liese W (2012) Investigation on
optimization of kiln drying for the bamboo species Bambusa
stenostachya, Dendrocalamus asper and Thyrsostachys siamensis. J Bamboo Sci Cult 25(1):27–35
Wu KT (1992) The effect of high-temperature drying on the antisplitting of makino bamboo culm (Phyllostachys makinoi Hay.).
J Wood Sci Technol 26:271–277
123
LY L U A N - THLfC TifiN - K I N H NGHlfiM
giai phap nang cao chat luging
7 nhom
cong tac can ho d
TICN G I R N G
PHAM DUNG
Ban To chdc Tinh uy
T
hue hidn dudng ldi ddi mdi ciia Dang,
nhi't la tfl khi cd Nghi quyd't Trung
uong 3 (khda VIII) vd chid'n lupc can
bd thdi ky CNH. HDH, Ban Thudng vu Tinh
iiy Tldn Giang, cic cip iiy dang da ban hanh
nhidu nghi quydt, chuong trinh, ke' hoach,
hudng din... dd Ianh dao, chi dao cdng tic cin
bd v i xiy dung ddi ngfl cin bd, dam bao dupc
su chuydn bidn lidn tuc, viing chic giiia eae thd
hd cin bd.
Cdng tie ein bd d Tidn Giang thdi gian
qua da bam sit nhidm vu chinh tri, ddi mdi ve
quan didm, ndi dung, cich lam theo hudng
phit huy din chu, edng khai, tridn khai ddng
bd cie khiu ciia cdng tie can bd, bao dam
nguydn tic tip trung din ehii. Dang thdng
nhit lanh dao edng tic can bd v i quan ly ddi
ngfl can bd, ddng thdi dd cao vai tro trach
nhidm cua ngudi dung diu eo quan. don vi.
Ddi ngu cin bd cie cip ngiy cing trudng
thanh, tang sd lupng, dupc d i o tao co ban vd
chuydn mdn, nghidp vu, ly luin ehinh tri.
kidn thflc quan ly n h i nudc, ngoai ngfl, tin
hpc...; sd can bd tre ngiy eing viing ving thd
hidn dupe ban llnh, tinh ndng ddng, sing tao,
cd kha ndng dap flng ydu ciu nhidm vu ehinh
tri va mdt phin ydu ciu hdi nhip kinh tdqudc
td.
Tiiy nhidn, vide td ehflc thuc hidn nghi
quydt, chu truong cua Dang, Nha nudc vd cdng
tie ein bd cd Ilie cdn chim, lung tdng. Phuong
phap tuydn chpn ngudn cin bd dua vio quy
hoach nhu tao ngudn tfl sinh vidn khi, gioi.
xui't sic d cac trudng dai hpc. cao ding thuc
hidn chua hieu qua. Vin dd chuin hda ddi ngu
can bd eo sd chua thuc hidn tdt; chinh sich,
mdi trudng, didu kien lam vide chua thit su
khoi diy tai nang, khuydn khich tinh thin edng
hie'n v i thu hut nhin tai vao bd miy cua Dang,
Nha nudc, doan the. Viec bd tri, sfl dung cin
bd mdi chii y de'n yeu eiu hoin thanh nhidm
vu trudc mit, con nang vd qua trinh, thim nidn
cdng tie, chua manh dan bdi dudng phat huy
nhin td tich cue, ndi trdi, tridn vpng phat trien
Iiu dai. Cdng tic quy hoach, dao tao can bd
con khep kin trong don vi, thie'u tinh kha thi,
chi gidi han trong nhidm ky. Ty Id can bd tre,
nir cdn thap, tudi ddi binh quin d cip uy cic
cip, lanh dao cae nganh cd chidu hudng gia
tang, mit cdn ddi trong 3 dd tudi... Mdt bd
phin can bp, cdng chflc thidu tfnh chu ddng,
nang ddng trong edng tie tham muu, de xuit;
vide am hieu v i eip nhit vd phap luit chua
dupe thudng xuydn, ky nang giao tidp, ddi
ngoai cdn han chd'. Mdt sd cin bd cd bieu hien
quan lidu, thUe dung, thidu trieh nhidm, thidu
tu giic ren luyen, p h ^ di'u.
De phit huy kd't qua dat dupc va khic phuc
ban che. Ban Thudng vu Tinh uy Tien Giang
ngay tfl diu nhidm ky 2010-2015 da ban hinh
Nghi quydt chuydn dd "Ndng eao chit lupng
cdng tic can bd v i xiy dung ddi ngfl can bd
cic cip dip flng yeu ciu, nhidm vu trong thdi
ky diy manh CNH, HDH", ttong dd tip tmng
Xiy dung Dang sd 5-2012
33
LY L U A N - THl/C TifiN - KINH NGHlfiM
kip thdi thay thd nhflng ein bd kdm phim chit,
vio 7 nhdm giai phip cu thd sau:
1. Ndng eao nhdn thdc vd y thdc trdch ning lire, khdng hoin thinh nhiem vu dd thuc
nhiim cua edp iiy. td chdc ddng, Idnh dao cdchidn tdi phuong chim "cd Idn. cd xudng, c6
ngdnh, edc cap vi cdn bd vd cdng tdc cdn bd. vio, cd ra", gdp phin xiy dung ddi ngfl cin bfl
Tid'p tuc quin tridt siu sic quan didm, dudng phil tridn toin didn. Cdn cfl vio yeu ciu.
Id'i, chii truong. chinh sach ciia Dang vd cin bd nhiem vu, tidu chuin ein bd. phim chit, ning
vi cdng tic can bd. Ting cudng vai trd Ianh Iuc vi tridn vpng phit tridn eua cin bd dd bd
dao cua cic ci'p uy. td chfle dang trong vide tri. sfl dung vi cit nhic ein bd kip thdi, dung
xiy dung vi ning cao chi't Iupng cic chuong luc; td chflc thuc hidn tdt co chd, chfnh sich
trinh hinh ddng. kd hoaeh, hudng din thue phit hidn, tuydn chon. bdi dudng, trpng dung
hidn cac chii truong, nghi quyd't. quydt dinh nhflng ngudi thit sir cd dflc. cd tii.
eua Dang vd cin bd vi edng tie ein bd. Ddi
3 Tdng cUdng ehdt lugng cdng tdc quy
mdi cich nghi, eich lim dd khic phuc cd hidu hoach, ddo tao, bdi dudng vd rin luyin cdn
qua nhung ban chd, ydu kdm trong cdng tic hd. Xui't phit tfl ydu ciu, nhidm vu chfnh tri,
cin bd; ting eudng edng tic kidm tra, giim sit chii ddng, cd tim nhin xa. cd quy hoach xiy
thuc hidn cdng tic cin bd; so kd't viec thuc dung ddi ngu cin bd cho trudc mit vi Iiu dii,
hien nghi quydt giu'a nhiem ky vi tdng kdt cudi xiy dung quy hoach ngay tfl diu nhidm ky cip
nhidm ky cip uy.
Liy. Ting cudng tao ngudn cin bd tre, ein bfl
2. Ddi mdi edng tde ddnh gid, sddung vd bd'nfl dua vio quy hoach. Kdt hpp quy hoach cin
tri cdn bd. Td chfle thue hidn td't quy chd dinh bd Ianh dao, quan I^ vdi quy hoach cin bfl
gii cin bd theo Quyd't dinh 286-QDAW ngiy chuydn mdn nghidp vu, quan tri doanh nghiep,
8-2-2010 cua Bd Chfnh tri, bao dam nguyen nghidn cflu khoa hoc. ehuydn gia diu nginh;
tic tip trung din ehii, cdng khai, minh bach, thuc hidn tdt phuong chim quy hoach "ddng"
khich quan, toan dien, edng tim; Iiy chit va "md"; xic dinh quy hoach cip iiy Ii ndi
lupng, hieu qua hoin thinh chfle trieh nhiem dung trpng yd'u trong quy hoach can bd Ianh
vu lam thude do chinh vd ning Iuc, phim chi't dao, quan Iy; sd' lupng dua vio quy hoaeh cip
can bd. Ting cudng cdng tic giio due, quan ly uy dat gi'p 2 Iin sd Iupng eip uy duong nhiem.
cin bd gin vdi vide tidp tuc thuc hidn hpc tip
Trdn co sd quy hoach, lip trung cdng tic
vi lim theo tim guong dao dflc Hd Chf Minh dio tao, dio tao lai, bdi dudng cin bd theo tieu
vi vdi cdng tic phdng, ehdng tham nhung, chuin chfle danh cin bd, ehii trpng vide cip
quan lieu, lang phi. Thuc hien dung quy trinh nhit kid'n thflc mdi vd mpi linh vuc eho cin bd
liy phie'u tin nhiem, bd nhidm. biu cu dd chpn lanh dao, quan l;y, trang bi kidn thflc vd hfli
dung ngudi. bd tri dung vide; md rdng quydn nhip kinh td qudc td', luit phip, thdng le qu6c
flng cfl, dd cfl, tidn efl vi gidi thidu nhidu td, ngoai ngfl, tin hpc, ky ning giao tidp, xft Iy
phuong an nhin su dd lua chpn, biu efl cd sd tinh hudng... Xiy dung kd hoach, dd in dio
du. Thi didm vide tuydn chpn cin bd Ianh dao tao, bdi dudng cin bd tfl nay ddn 2015 vi dinh
cip tnrdng phdng thudc sd, ban, nginh tinh, hudng ddn nim 2020: Di in dio tao sau dai
huyen, thanh phd, thi xa thdng qua thi tuydn, hpc trong vi ngoii nudc; dd in dio tao sau dai
chd dd thuc tip, tip su lanh dao; nhit thd hda hpc theo chuong trinh Md Kdng 1.000 (Tidn
chflc danh Ianh dao co quan dang, chfnh quydn Giang 100); dd in dio tao cin bd du ngudn 6
d cip huyen. Hiuc hien tdt ehddd didu chuydn CO sd Ii sinh vidn tdt nghidp dai hpc; dd in dio
vi tri cdng tic d nganh, linh vuc do Chfnh phu tao giang vidn cd trinh dd tidn sT cho cic
quy dinh; midn nhidm, tfl ehflc, cho thdi viec. trudng dai hpc, cao ding giai doan 2010-2020
34 XivdunaDinasd 5-2012